

Key Points
MM cells overexpress NF-ĸB–responsive genes IL27RA and JAM2, providing candidate targets for therapeutic intervention.
IL-27Rα-mediated signaling via STATs upregulates CD38, a target of monoclonal antibody–mediated therapy, in MM cells.

Abstract
Multiple myeloma (MM) shows constitutive activation of canonical and noncanonical nuclear factor κB (NF-κB) signaling via genetic mutations or tumor microenvironment (TME) stimulations. A subset of MM cell lines showed dependency for cell growth and survival on the canonical NF-κB transcription factor RELA alone, suggesting a critical role for a RELA-mediated biological program in MM pathogenesis. Here, we determined the RELA-dependent transcriptional program in MM cell lines and found the expression of the cell surface molecules interleukin-27 receptor-α (IL-27Rα) and the adhesion molecule JAM2 to be responsive to RELA at the messenger RNA and protein levels. IL-27Rα and JAM2 were expressed on primary MM cells at higher levels than on healthy long-lived plasma cells (PCs) in the bone marrow. IL-27 activated STAT1, and to a lesser extent STAT3, in MM cell lines and in PCs generated from memory B cells in an IL-21–dependent in vitro PC differentiation assay. Concomitant activity of IL-21 and IL-27 enhanced differentiation into PCs and increased the cell-surface expression of the known STAT target gene CD38. In accordance, a subset of MM cell lines and primary MM cells cultured with IL-27 upregulated CD38 cell-surface expression, a finding with potential implications for enhancing the efficacy of CD38-directed monoclonal antibody therapies by increasing CD38 expression on tumor cells. The elevated expression of IL-27Rα and JAM2 on MM cells compared with that on healthy PCs may be exploited for the development of targeted therapeutic strategies that modulate the interaction of MM cells with the TME.
Introduction
Multiple myeloma (MM) is an incurable malignancy of germinal center-derived long-lived plasma cells (PCs) that undergo clonal growth at multiple sites throughout the bone marrow (BM).1 MM is the second most common blood cancer, accounting for 13% of hematologic cancers.2,3 It is characterized by a molecularly heterogeneous pattern of genetic aberrations that promote pathogenesis through the dysregulated expression of oncogenes or the inactivation of tumor-suppressor genes.4,5 Disease progression is frequently associated with genetic mutations that affect the nuclear factor κB (NF-ĸB) signal transduction pathway.4 MM growth, survival, and migration/dissemination is also influenced by interactions between MM cells and the tumor microenvironment (TME).1,6 MM cells respond to cytokines and growth factors secreted by cells in the TME, such as interleukin (IL-6) and the NF-ĸB pathway activating cytokines B-cell activating factor (BAFF) and A proliferation-inducing ligand (APRIL),7,8 whereas the adhesion of MM cells to extracellular matrix proteins is associated with the expression of cell-cycle regulators and prosurvival proteins.9
There have been, in the past decade, substantial improvements in the clinical management of MM that has favorably affected patients’ survival and quality of life.10 Drugs currently used in the treatment of MM include proteasome inhibitors, immunomodulatory agents, and monoclonal antibodies (mAbs) against cell surface antigens, such as CD38, SLAMF7 and BCMA, which are highly expressed on the tumor cells.11 However, patients soon become refractory to these classes of drugs and biologicals (triple-class refractory MM), which is associated with a poor, truncated survival consequential to the development of a relapsed refractory state (relapsed refractory MM [RRMM]) as well as the emergence of treatment-resistant clones.1 The latter is associated with tumor cell–intrinsic factors as well as with the TME that mediate drug resistance or immunosuppression in the BM. For example, CD38-directed mAb therapy with daratumumab or isatuximab can cause downregulation of CD38-expression on MM cells.12,13 Overall, there is a need to further improve the efficacy of existing therapeutic approaches and identify additional Achilles’ heels to develop reagents that target MM cells or the TME more effectively.
NF-ĸB is constitutively activated in at least 80% of patients with MM14,15 via cell-surface receptor engagement in the TME (eg, BAFF or APRIL) or through genetic mutations, identifying this pathway as a suitable therapeutic target. Receptor activation can follow 2 routes, the canonical or the noncanonical NF-ĸB pathway.16,17 The canonical route leads to nuclear translocation of RELA/p50 and c-REL/p50 heterodimers resulting in transcription of NF-ĸB target genes. Of note, in PCs and MM cells, c-REL is expressed at very low amounts or is absent,18,19 thus identifying the RELA/p50 heterodimer as the principle downstream mediator of the canonical pathway. The noncanonical route leads to the release of NF-ĸB-inducing kinase (NIK) that, in turn, induces processing of the NF-ĸB p100-subunit to p52, resulting in the nuclear translocation of the RELB/p52 heterodimer. Genetic aberrations in NF-ĸB pathway components are detected in ∼50% of patients newly diagnosed with MM and in up to 60% of those with RRMM.14,20-24 The mutations can affect regulators of both canonical (CYLD, NFKBIA) and noncanonical (TRAF2/3, cIAP1/2, and NIK) NF-ĸB pathways, with the majority of mutations occurring in upstream regulators of the noncanonical pathway, causing dysregulated activation of NIK. Of note, MM cell lines with NIK-deregulating mutations required both NF-ĸB pathways for cell growth.14,24 It is now clear that the majority of MM cell lines shows activation of both the canonical and noncanonical NF-ĸB pathways,24,25 and because inhibition of either pathway impaired cell growth,24-26 both are considered essential for MM growth/survival in a mutually exclusive fashion.
Previously we demonstrated that germinal center-derived long-lived PCs require the RELA subunit for their development, suggesting that RELA controls a biological program that establishes the PC-phenotype,27 which has been corroborated by independent evidence.28 Thus, we hypothesized that in MM cell lines with aberrant NF-ĸB activation, ablation of RELA alone would impair cell growth/survival. Here, we report that short hairpin RNA (shRNA)-mediated knockdown of RELA was toxic to a panel of MM cell lines with aberrant NF-ĸB activity. We identified the common RELA-dependent transcriptional program by performing RNA sequencing (RNA-seq) and focused on the identification of the RELA-responsive genes IL27RA and JAM2 that have potential roles in the interaction between primary MM cells and the TME in patients, representing putative targets for therapeutic intervention.
Methods
Clinical samples
Patient BM aspirates (BMAs) were obtained from patients with MM in the UKMRA Myeloma XII (ACCoRd) trial, which recruited patients who relapsed. Healthy control BMAs were obtained from patients undergoing elective orthopedic surgery for nonunion fracture repair. Approval for the study was granted by the Leeds (East) National Research ethics committee. Written informed consent was obtained from all patients, and experiments were conducted in accordance with the Declaration of Helsinki.
Cell lines
MM cell lines JJN3, KMS18, U266, KMS28PE, OC1-My1, LP1, L363, and EJM were maintained as described in supplemental Methods, which also provide details on retroviral transduction, monitoring and analysis, the in vitro PC generation assay, and culturing of MM cells.
Cell sorting and RNA-seq
At day 3 after doxycycline induction, the YFP+DsRed+ cell population was isolated via flow sorting (see supplemental Methods for details). RNA quality was verified before messenger RNA polyA–selected library preparation. RNA was sequenced on a NextSeq500 (Illumina), with a read length of 75 base pairs, single-end sequencing. For details on the RNA-seq data analysis, see “supplemental Methods.” The differential expression analysis was conducted using DESeq2 package. The differentially expressed genes were determined based on the following cut-offs: padj < 0.05 and log2 fold change > log2(1.2) for upregulation or log2 fold change < log2(1.2) for downregulation.
ADCC assay
CD38-directed antibody-dependent cellular cytotoxicity (ADCC) assay was performed using MM cell line target cells stimulated with and without interleukin-27 (IL-27), followed by labeling with 2 or 0.2 μM cell trace violet (CTV, Thermo Fisher), respectively, and then mixing in a 1:1 ratio (see “supplemental Methods” for details). The target cell mix was incubated, with daratumumab (ProteoGenix) or human immunoglobulin G1κ as the control. Purified peripheral blood natural killer (NK) cells were activated overnight with IL-15, and NK effector cells were added to the target cells in a 1:1 ratio. The extent of MM cell killing was assessed via flow cytometry.
Statistical analysis
Statistical significance was determined using one-way analysis of variance (ANOVA) and Tukey multiple comparison test or Student t test (nonsignificant [ns]; ∗P < .05; ∗∗ P < .01; ∗∗∗P < .001).
Results
shRNA-mediated downregulation of RELA is toxic to MM cell lines
In MM, most of genetic mutations cause constitutive activation of NIK, resulting in the aberrant activation of both the canonical and noncanonical NF-ĸB pathways,14,24,29 which reflects the NF-ĸB inducing conditions in the TME. To determine the extent to which the canonical NF-ĸB subunit RELA is required for cell growth/survival in a panel of 8 MM cell lines with aberrant NIK activity, we performed retrovirus-mediated inducible shRNA-mediated knockdown of RELA, using an shRNA targeting the Renilla luciferase gene (shRenilla) as a control (supplemental Figure 1A). The vectors contained a yellow fluorescent protein (YFP) gene to indicate successful transduction and a doxycycline-inducible dsRed gene that is coexpressed with the shRNA upon doxycycline administration to the cultures. Compared with the shRenilla control, which in supplemental Figure 1A is set at 100%, 7 of 8 MM lines (JJN3, KMS18, U266, KMS28PE, L363, EJM, and OCI-My1) showed loss of shRELA-expressing cells over time, indicating that the downmodulation of RELA expression was toxic to the cells.
A previous publication showing that RELA knockdown in 2 MM cell lines (U266 and RPMI-8226) increased the fraction of annexinV+ cells relative to that of the control suggested apoptosis as the underlying cell death mechanism.26 In agreement, we found an increased proportion of active caspase-3+ cells in KMS18 RELA–knockdown cells compared with that in shRenilla cells 3 days after induction of shRNA knockdown (supplemental Figure 1B). Together, there is increasing evidence for the dependency of a subset of MM cell lines on the canonical NF-ĸB subunit RELA for cell growth and survival that cannot be compensated by other NF-ĸB heterodimers (eg, RELB/p50), suggesting RELA plays a critical role in MM biology.
Identification of RELA-responsive genes in MM cell lines
To determine the genes that are differentially expressed as the result of RELA activity, we performed an RNA-seq analysis of RELA-knockdown vs control samples for the JJN3, KMS18, and U266 cell lines, in which growth was strongly impaired by RELA knockdown because only 20% of the cells in the cultures comprised shRELA-expressing YFP+dsRed+ cells at day 14 (supplemental Figure 1A). We chose day 3 after induction for analysis because the cultures still predominantly contained live cells, although the apoptotic process had already started because caspase-3+ cells were detectable (supplemental Figure 1B). Each cell line was transduced with retroviral vectors comprising 1 shRenilla and 2 separate shRELAs (Figure 1A). To confirm shRNA-mediated downregulation of RELA protein expression, we flow cytometrically isolated YFP+dsRed+ cells (indicating shRNA expression) at day 3 after induction and performed western blot analysis (Figure 1B). KMS18 and U266 showed ∼80% to 90% reduction of RELA protein in the shRELA vs the shRenilla samples. A reduction was also observed, albeit less pronounced (∼50%), in JJN3.
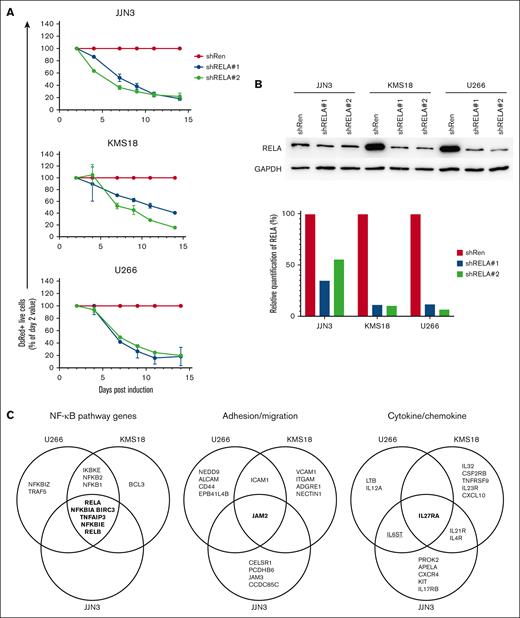
Identification of RELA-responsive genes in MM cell lines. (A) RELA was knocked down in 3 MM cell lines (JJN3, KMS18, and U266) using an inducible retroviral transduction system with 2 shRELAs (shRELA1 and 2) or a control sh Renilla (shRen). Inhibition of cell growth upon RELA knockdown was assessed by normalizing the percentage of viable shRELA-expressing cells to the percentage of shRen-expressing cells on day 2 via flow cytometry (identified as YFP+dsRed+). Triplicate values within 1 experiment are shown ± standard error of the mean and is representative of more than 3 experiments. (B) Cells expressing shRNA (YFP+dsRed+) were sorted via flow cytometry at day 3 after viral transduction, and the extent of RELA knockdown assessed via western blotting (top). Quantification of images (bottom; ratio of RELA:GAPDH adjusted volume intensity with shRen for each cell line defined as 100% expression). (C) RNA was prepared from YFP+dsRed+ flow cytometrically sorted cells from triplicate samples of each shRNA and cell line on day 3 after viral transduction and then sequenced. Genes differentially expressed between shRen and shRELA samples are shown in the Venn diagrams for each cell line. All genes are downregulated with the exception of IL6ST (underlined). (D) The reads per kilobase of transcript per million mapped reads (RPKM) expression values of RELA, JAM2, and IL27RA are shown for control (shRen) and for the 2 shRELA knockdown MM cell lines. (E) Cell surface expression of IL-27Rα and JAM2 (black histogram) was confirmed on JJN3, KMS18, and U266 relative to isotype control (solid gray histogram) as assessed via flow cytometry.
For the RNA-seq analysis, YFP+dsRed+ cells transduced with the respective shRNA vectors were isolated via fluorescence-activated cell sorting at day 3 after induction from triplicate cultures per the condition and cell line (supplemental Figure 2A depicts the strategy). To determine the differentially expressed genes, supervised analysis of the corresponding 3 shRELA#1 and shRenilla, and 3 shRELA#2 and shRenilla repeats was performed. (The genes identified for each cell line and the condition are listed in supplemental Table 1, with the respective padj and log2 fold change values).
To identify RELA-associated gene expression changes with high stringency, genes were only considered if they were differentially expressed relative to the control in 2 independent shRNA experiments, defining the MM cell line–specific RELA-responsive genes. (supplemental Table 2; supplemental Figure 2B depicts Venn diagrams). Specifically, the overlap for JJN3 comprised 385 downregulated (ie, genes with decreased expression upon shRELA induction) and 233 upregulated genes; for U266, 92 downregulated and 123 upregulated genes; and for KMS18, 101 downregulated and 31 upregulated genes.
To define the common RELA MM cell line signature, we determined the overlap of RELA-responsive genes identified in at least 2 of the 3 cell lines (supplemental Figure 1A; Table 1 for shRELA downregulated genes and supplemental Table 3 for shRELA upregulated genes). Excluding RELA, 69 differentially expressed genes were identified, comprising 40 genes that were downregulated and 29 that were upregulated. In total, 12 genes were commonly identified in all 3 cell lines, 10 of which were downregulated after RELA knockdown.
Genes commonly downregulated upon shRNA knockdown in MM cell lines
| Gene | Gene name | Category | JJN3 | U266 | KMS18 |
|---|---|---|---|---|---|
| BIRC3 | Baculoviral IAP repeat containing 3 | NF-κB pathway, negative regulator | + | + | + |
| NFKBIA | IκBα | NF-κB pathway, negative regulator | + | + | + |
| TNFAIP3 | TNFα-induced protein 3 | NF-κB pathway, negative regulator | + | + | + |
| NFKBIE | NF-κB inhibitor epsilon | NF-κB pathway, negative regulator | + | + | + |
| RELA | RELA subunit (target of shRNA) | NF-κB pathway, subunit | + | + | + |
| RELB | RELB subunit | NF-κB pathway, subunit | + | + | + |
| IKBKE | Inhibitor of NF-κB kinase subunit ε | NF-κB pathway, negative regulator | + | + | |
| NFKB2 | NF-κB2, p100/p52 subunit | NF-κB pathway, subunit | + | + | |
| NFKB1 | NF-κB1, p105/p50 subunit | NF-κB pathway, subunit | + | + | |
| IL27RA | IL-27 receptor subunit α | Cytokine/chemokine (receptor) | + | + | + |
| IL21R | IL-21 receptor | Cytokine/chemokine (receptor) | + | + | |
| IL4R | IL-4 receptor | Cytokine/chemokine (receptor) | + | + | |
| CD70 | TNFSF7, ligand for CD27 | Immune response/TNF receptor family member | + | + | |
| CD83 | CD83 molecule | Immune response/antigen presentation | + | + | + |
| JAM2 | Junctional adhesion molecule, CD322 | Adhesion/migration | + | + | + |
| ICAM1 | Intercellular adhesion molecule 1 | Adhesion/migration | + | + | |
| FAS | CD95, Fas cell surface death receptor | Apoptosis, pro | + | + | |
| DOCK10 | Dedicator of cytokinesis 10 | Signaling | + | + | |
| PTGER4 | Prostaglandin E receptor 4 | Signaling | + | + | |
| CAMK4 | Calcium/calmodulin-dependent protein kinase IV | Signaling/calcium | + | + | |
| NFE2L3 | Nuclear factor, erythroid 2-like 3 | Cell cycle/proliferation (control) | + | + | + |
| GINS2 | GINS complex subunit 2 | Cell cycle/proliferation | + | + | |
| CDCA7 | Cell division cycle-associated protein 7 | Cell cycle/proliferation | + | + | |
| CDC25A | Cell division cycle 25A | Cell cycle/proliferation | + | + | |
| CCND1 | Cyclin D1, BCL1, BCL-1 oncogene | Cell cycle/proliferation (control) | + | + | |
| MIR30A | microRNA 30A | Posttranscriptional regulation/microRNA | + | + | + |
| MYB | c-Myb, MYB proto-oncogene, transcription factor | Transcriptional regulation/transcription factor | + | + | |
| SLC25A43 | Solute carrier family 25 member 43 | Metabolism | + | + | |
| GALNT6 | Polypeptide N-acetylgalactosaminyltransferase 6 | Protein metabolism/glycosylation | + | + | |
| BCAT1 | Branched chain amino acid transaminase 1 | Metabolism | + | + | |
| KHDRBS3 | KH RNA binding domain cont., signal transduction associated 3 | RNA metabolism | + | + | |
| APOBEC3B | Apolipoprotein B messenger RNA editing enzyme catalytic subunit 3B | RNA metabolism | + | + | |
| MSH2 | MutS homolog 2, DNA mismatch repair protein Msh2 | DNA repair | + | + | |
| AP3M2 | Adapter-related protein complex 3 subunit μ 2 | Intracellular trafficking/transport | + | + | |
| SCRN1 | Secernin 1 | Intracellular trafficking/transport | + | + | |
| RFTN1 | Raftlin, lipid raft linker 1 | Intracellular trafficking/transport | + | + | |
| UNC13C | Unc-13 homolog C | Intracellular trafficking/transport | + | + | |
| WWC3 | WWC family member 3 | Intracellular trafficking/transport | + | + | |
| MTCL1 | Microtubule crosslinking factor 1 | Cytoskeleton | + | + | |
| NRM | Nurim, nuclear envelope membrane protein | Cytoskeleton/nuclear | + | + | |
| IGLL5 | Immunoglobulin λ–like polypeptide 5 | Immunoglobulin genes | + | + |
The RELA MM cell line signature comprised 6 genes (BIRC3, TNFAIP3, NFKB2, NFKBIE, RELB, and NFKBIA) that were part of the 11 gene MM NF-ĸB target gene signature defined by Annunziata et al14 (supplemental Table 4A). Ten genes of the signature, TNFAIP3, NFKBIE, RELB, NFKBIA, CD83, MYB, CCND1, NFKB1, NFKB2, and FAS, have been described as direct NF-ĸB targets in the Gilmore Laboratory NF-ĸB target gene list (The Gilmore Lab, NF-ĸB Transcription Factors, Boston University, Boston) www.bu.edu/nf-kb/gene-resources/target-genes/. Ten genes (BIRC3, TNFAIP3, NFKB2, NFKBIE, RELB, NFKBIA, CD83, ICAM1, NFKB1, and FAS) of the signature were identified as direct RELA target genes induced by TNF in primary fibroblasts to mimic the inflammatory response; 10 other genes were identified in either 1 of the cell line–specific signatures (supplemental Table 4B).30 Overall, the occurrence of established NF-ĸB and/or RELA-specific target genes among the RELA MM cell line signature corroborated our experimental strategy of identifying RELA-responsive genes in MM cell lines.
We assigned the genes of the common RELA MM cell line signature to categories (see Table 1 for shRELA downregulated genes; see supplemental Table 3 for shRELA upregulated genes). Among the 40 downregulated RELA-responsive genes, NF-ĸB pathway genes comprised the largest category with 8 genes, including the NF-ĸB subunits RELB, NFKB1, and NFKB2, and negative regulators of the NF-ĸB pathway, namely BIRC3, NFKBIA, NFKBIE, TNFAIP3, and IKBKE (Figure 1C). This finding suggests a critical function of the canonical pathway in MM cells in setting up both canonical and noncanonical NF-ĸB signaling components, presumably to ensure effective pathway activation upon cell surface receptor stimulation.
In accordance with the known proproliferative role of NF-ĸB activation, 5 genes in a cell cycle/proliferation category that included CCND1, CDC25A, and NFE2L3 were downregulated upon shRELA induction (Table 1), and 2 genes associated with a negative control of proliferation were upregulated (supplemental Table 3). NFE2L3 has recently been identified as a key regulator in the growth of colon cancer cells with constitutive NF-ĸB activity, and NFE2L3 gene expression was regulated by the RELA subunit.31 Furthermore, the downregulated genes included 2 genes associated with posttranscriptional (MIR30A) or transcriptional (MYB) regulation (Table 1). MIR30A is reportedly a RELA target gene in MM,32 and in mice, c-MYB is required for enabling long-lived PCs to home to the BM by responding to chemokines.33 Several categories including metabolism, intracellular trafficking/transport, and cytoskeleton-associated genes comprised a number of genes that were downregulated or upregulated upon shRELA knockdown, (Table 1; supplemental Table 3).
The adhesion/migration and cytokine/chemokine categories may contain genes with potential functions in the interaction of primary MM cells with the TME in the patients and the ability of MM cells to disseminate throughout the body. Two genes (ICAM1 and JAM2) encoding cellular adhesion molecules were identified as downregulated upon shRELA induction (Table 1; Figure 1C). Although the expression of ICAM-1 on MM cells has been firmly established, junctional adhesion molecule 2 (JAM2), to our knowledge, has not been reported to be expressed on the tumor cells. Three genes encoding cytokine receptors/ligands were identified as downregulated among 2 MM cell lines (IL21R and IL4R) or all 3 MM lines (IL27RA) (Table 1; Figure 1C), and 1 gene (IL6ST) was upregulated in 2 cell lines (supplemental Table 3; Figure 1C). Another 12 genes, including LTB, CXCR4, and CXCL10, with roles in cytokine/chemokine biology were identified as RELA-responsive in either of the 3 MM lines (Figure 1C). Thus, in MM cells, canonical NF-ĸB signaling seems to regulate the expression of genes encoding cytokines, chemokines, and their receptors.
Here, we focused on the validation and functional analysis of IL-27–receptor α (IL-27Rα, WSX-1) and the adhesion molecule JAM2, which were both identified as being RELA responsive in all 3 cell lines (Figure 1D), on MM cells and healthy PCs. IL-27Rα, with gp130/IL6ST, is part of the IL-27R that mediates IL-27–induced signal transduction via STAT1 and STAT3.34 IL-27 is expressed on murine germinal center B cells and was shown to enhance the germinal center response by increasing B-cell proliferation.35 IL-27Rα is expressed on human PCs, in which IL-27 reportedly exerts chemotactic properties on tonsillar PCs in an in vitro assay,36 and a study showed IL-27Rα expression on CD138+ cells from BMAs of 2 patients with MM.37 JAM2 acts as an adhesive ligand for interacting with a variety of immune cell types. JAM2 can bind homophilically38 or to JAM339; both molecules are expressed on various lymphocytes and endothelial cells, facilitating lymphocyte transmigration into secondary lymphoid organs.38,40 Although JAM2 is found on B cells,41 its expression pattern on PCs and MM cells is unknown.
Identification of IL27RA and JAM2 as RELA-responsive genes
IL-27Rα and JAM2 molecules were expressed on JJN3, U266, and KMS18 cells (Figure 1E). shRELA-mediated downregulation of IL-27Rα and JAM2 at the protein level was confirmed for the 3 MM cell lines (Figure 2A-B; supplemental Figure 3B) by comparing the expression of IL-27Rα and JAM2 in shRNA-noninduced cells (YFP+dsRed–) with that in shRNA-induced cells (YFP+dsRed+) within the same cultures (supplemental Figure 3A shows the gating strategy). Cells in the shRenilla-transduced cultures showed equivalent expression of IL-27Rα and JAM2 in the induced and noninduced populations; whereas, compared with their noninduced counterparts, the cells induced to express shRELA#1/#2 showed reduced expression of IL-27Rα and JAM2 in a time-dependent fashion (Figure 2A-B, right). Thus, RELA knockdown caused reduced expression of IL-27Rα and JAM2 at the protein level.

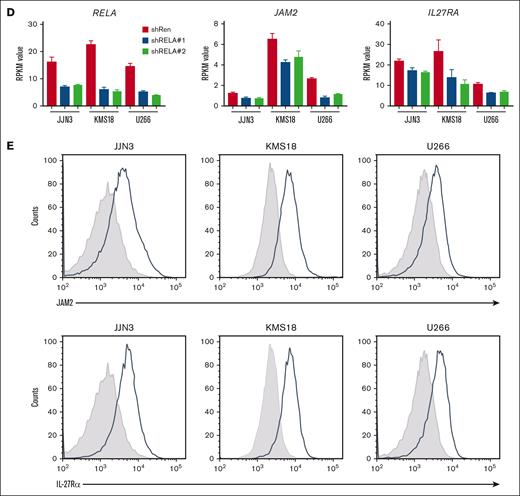
Identification of IL-27Rα and JAM2 as RELA-activation responsive genes. RELA was downregulated in KMS18 cells using retroviral-mediated shRNA knockdown. Cells expressing shRELA and control shRen could be identified as YFP+dsRed+ (shRNA) in comparison with YFP+dsRed− counterpart cells (WT) that do not express shRNA (supplemental Figure 3A). On day 0, day 7, and day 12 after induction of shRNA, cells were stained for IL-27Rα, JAM2, or isotype control and assessed via flow cytometry. (A-B) Representative histograms are shown for (A) IL-27Rα and (B) JAM2 on day 12. Graphs show triplicate mean fluorescence intensity values ± standard deviation for IL-27Rα or JAM2 from shRNA (YFP+dsRed+) normalized to WT (YFP+dsRed−) from corresponding shRen, shRELA#1 and shRELA#2 expressing cells. Similar findings were also observed in U266 and JJN3 cell lines (supplemental Figure 3B). (C-D) On day 5 after induction of shRNA expression, cells were stimulated with 50 ng/mL rIL-27 for 30 minutes before fixing and intracellular staining for phosphorylated STAT1 (p-STAT1) and p-STAT3. shRNA– (YFP+dsRed-) and shRNA+ (YFP+dsRed+) cells from shRen and shRELA-transduced cells were compared for the extent of p-STAT1 and p-STAT3 expression. Representative histograms and triplicate values ± standard deviation are shown. ∗P < .05; ∗∗∗P < .001using one-way ANOVA and Tukey multiple comparison test. ANOVA, analysis of variance; ns, nonsignificant; WT, wild type.
Identification of IL-27Rα and JAM2 as RELA-activation responsive genes. RELA was downregulated in KMS18 cells using retroviral-mediated shRNA knockdown. Cells expressing shRELA and control shRen could be identified as YFP+dsRed+ (shRNA) in comparison with YFP+dsRed− counterpart cells (WT) that do not express shRNA (supplemental Figure 3A). On day 0, day 7, and day 12 after induction of shRNA, cells were stained for IL-27Rα, JAM2, or isotype control and assessed via flow cytometry. (A-B) Representative histograms are shown for (A) IL-27Rα and (B) JAM2 on day 12. Graphs show triplicate mean fluorescence intensity values ± standard deviation for IL-27Rα or JAM2 from shRNA (YFP+dsRed+) normalized to WT (YFP+dsRed−) from corresponding shRen, shRELA#1 and shRELA#2 expressing cells. Similar findings were also observed in U266 and JJN3 cell lines (supplemental Figure 3B). (C-D) On day 5 after induction of shRNA expression, cells were stimulated with 50 ng/mL rIL-27 for 30 minutes before fixing and intracellular staining for phosphorylated STAT1 (p-STAT1) and p-STAT3. shRNA– (YFP+dsRed-) and shRNA+ (YFP+dsRed+) cells from shRen and shRELA-transduced cells were compared for the extent of p-STAT1 and p-STAT3 expression. Representative histograms and triplicate values ± standard deviation are shown. ∗P < .05; ∗∗∗P < .001using one-way ANOVA and Tukey multiple comparison test. ANOVA, analysis of variance; ns, nonsignificant; WT, wild type.
IL-27 receptor engagement results in phosphorylation of STAT1 and, to a lesser extent, STAT3 (Yoshida and Hunter34). To assess the impact of decreased IL-27Rα expression on the MM cell lines upon RELA knockdown, KMS18 and JJN3 cells were stimulated with IL-27, and levels of p-STAT1 and p-STAT3 were assessed via intracellular flow cytometry on day 5 of induction (Figure 2C). U266 cells did not show STAT1 phosphorylation (supplemental Figure 4). Cells in the shRenilla-transduced cultures showed equivalent phosphorylation of STAT1 and STAT3 in the induced (YFP+dsRed+) and noninduced (YFP+dsRed–) populations, whereas the cells induced to express shRELA showed reduced STAT1 and STAT3-phosphorylation compared to their noninduced counterparts in a time-dependent fashion (Figure 2C). Thus, RELA is required in MM cell lines to establish adequate IL-27 responsiveness by upregulating IL-27Rα expression.
Increased expression of IL-27Rα and JAM2 on cells derived from patients with MM
We investigated the expression of the RELA-responsive IL-27Rα and JAM2 on patient-derived MM cells. Using strategies to unambiguously distinguish malignant PCs in the BM from coexisting healthy PCs,42 we have established a multicolor flow cytometric assay in which malignant and healthy PCs were identified based on CD38 and CD138 positivity followed by the distinction of atypical PCs (aPC; CD56hiCD19lo) and healthy PCs (hPC; CD56loCD19hi; Figure 3A). BMA samples were obtained from patients with MM who were participating in the UKMRA Myeloma XII (ACCoRD) trial, which recruited patients with relapsed disease, and healthy control samples were obtained from patients undergoing elective nonunion fracture repair (supplemental Table 5). The expression of IL-27Rα and JAM2 was compared with that of the isotype control in aPCs (n = 18; Figure 3B-C). Moreover, in the case that a minimum event count of 500 in the parent gate fell into the healthy PC gate, thus allowing the confident identification of a healthy PC population, IL-27Rα and JAM2 expression was determined on healthy PCs from patients with MM (n = 5) and on healthy PCs from healthy individuals (n = 12). The results showed that aPCs from patients with MM expressed significantly higher amounts of cell-surface IL-27Rα and JAM2 compared with that of PCs from healthy individuals (Figure 3B-C). Of note, JAM2 appeared to be expressed at low cell-surface levels in healthy individuals. In the 5 MM cases with a sufficient number of event counts in the healthy PC gate, the cell-surface amounts of IL-27Rα and JAM2-expression fell in between those of the PCs from healthy individuals and the aPCs from patients with MM, presumably reflecting the impact that the local TME may have on the phenotype of the coexisting PCs.

Increased expression of IL-27Rα and JAM2 on aPCs from patients with MM. (A) BMA samples from patients with MM who were participating in the UKMRA Myeloma XII (ACCoRD) trial or from patients being treated for elective nonunion fracture repair (as healthy controls) were assessed via flow cytometry for the expression of IL-27Rα and JAM2. PCs were identified based on CD38/CD138-positivity followed by the distinction of aPC (CD56hi CD19lo) and healthy PC (hPC; CD56lo CD19hi). Representative dot plots and histograms showing the expression of IL-27Rα and JAM2 compared with that of isotype control in aPCs from patients with MM and PCs from healthy controls. (B-C) Data from individual patient samples from healthy controls and patients with MM (healthy PC in cases with sufficient events, see text) and aPC are shown; (B) IL27-Rα; (C) JAM2. ∗∗P < .01; ∗∗∗P < .001 using Student t test.
Increased expression of IL-27Rα and JAM2 on aPCs from patients with MM. (A) BMA samples from patients with MM who were participating in the UKMRA Myeloma XII (ACCoRD) trial or from patients being treated for elective nonunion fracture repair (as healthy controls) were assessed via flow cytometry for the expression of IL-27Rα and JAM2. PCs were identified based on CD38/CD138-positivity followed by the distinction of aPC (CD56hi CD19lo) and healthy PC (hPC; CD56lo CD19hi). Representative dot plots and histograms showing the expression of IL-27Rα and JAM2 compared with that of isotype control in aPCs from patients with MM and PCs from healthy controls. (B-C) Data from individual patient samples from healthy controls and patients with MM (healthy PC in cases with sufficient events, see text) and aPC are shown; (B) IL27-Rα; (C) JAM2. ∗∗P < .01; ∗∗∗P < .001 using Student t test.
IL-27Rα and JAM2 are expressed on in vitro–generated PCs
We found IL-27Rα and, to a lesser extent, JAM2, to be expressed on healthy long-lived PCs in human BM and reasoned that these molecules may have a role in PC differentiation or biology. To address this, we used an established in vitro PC differentiation assay to generate long-lived PCs from memory B cells (see supplemental Methods).43,44 Expression of IL-27Rα and JAM2 was detected on unstimulated memory B cells (day 0), whereas after activation, the levels of both molecules increased substantially, peaking on day 3 of the culture (Figure 4A-B). At time points when cells become plasmablasts (day 6) and PCs (day 13 onward), expression of IL-27Rα and JAM2 was detected at a level similar to, or slightly higher than, on unstimulated B cells, although there was variation among donors (Figure 4A-B). The functionality of JAM2 was assessed using day 3–activated B cells in an established transwell-migration system with HUVEC cells.41 We found that B-cell migration through the HUVEC monolayer toward stromal cell-derived factor 1 was inhibited when JAM2-blocking antibodies were added to the system (supplemental Figure 5), suggesting that JAM2 is functional on B cells and PCs and that modulations in JAM2 surface expression may affect MM cell migration and dissemination. The IL-27 receptor complex expressed on in vitro–generated PCs on day 13 was functional, as demonstrated by their ability to phosphorylate STAT1 and, to a lesser extent, STAT3 in response to IL-27 stimulation (Figure 4C-D). For comparison, day-13 PCs were stimulated with rIL-21, a cytokine required for PC generation, which is known to phosphorylate STAT3 but not STAT1 (Konforte and Paige45). The findings provided the rationale to investigate the potential function of IL-27Rα in PC development.

IL-27Rα and JAM2 are expressed on in vitro–generated PCs. (A) PCs were generated from 5 healthy donors using an established in vitro method (Cocco et al43) and assessed for expression of IL-27Rα and JAM2 at various time points throughout differentiation via flow cytometry. Representative histograms are shown for IL-27Rα (dark red) and JAM2 (dark blue) compared with isotype control (light red or blue). (B) Pooled data are shown in bar charts. (C) PCs on day 13 were stimulated with rIL-27 (red), rIL-21 (red-dotted), or without (blue) for 30 minutes before intracellular staining for phosphorylated STAT1 (p-STAT1) and p-STAT3 and assessed via flow cytometry. (D) Data from 2 individual donors are shown. ∗∗P < .01; ∗∗∗P < .001 using one-way ANOVA and Tukey multiple comparison test.
IL-27Rα and JAM2 are expressed on in vitro–generated PCs. (A) PCs were generated from 5 healthy donors using an established in vitro method (Cocco et al43) and assessed for expression of IL-27Rα and JAM2 at various time points throughout differentiation via flow cytometry. Representative histograms are shown for IL-27Rα (dark red) and JAM2 (dark blue) compared with isotype control (light red or blue). (B) Pooled data are shown in bar charts. (C) PCs on day 13 were stimulated with rIL-27 (red), rIL-21 (red-dotted), or without (blue) for 30 minutes before intracellular staining for phosphorylated STAT1 (p-STAT1) and p-STAT3 and assessed via flow cytometry. (D) Data from 2 individual donors are shown. ∗∗P < .01; ∗∗∗P < .001 using one-way ANOVA and Tukey multiple comparison test.
IL-27 enhances CD38 upregulation during in vitro PC differentiation
Because we found IL-27Rα to be expressed on B cells and plasmablasts/PCs throughout in vitro PC generation, we determined the extent to which addition of IL-27 to the culture affected the differentiation process. We set up separate cultures in which IL-27 was added to the standard conditions of the in vitro PC differentiation assay, or in which IL-21 was substituted by IL-27. Although IL-21 could not be substituted by IL-27 (supplemental Figure 6), the concomitant activity of both cytokines increased the proportion of CD38+CD138+ PCs over time to 39.2% when cultured with both cytokines vs 24.5% when cultured with IL-21 alone on day 20 (Figure 5A). Moreover, we observed a consistent increase in the expression of CD38 on plasmablasts/PCs generated in the presence of IL-27 from day 6 onward; on days 6, 13, and 20, the increase in the CD38 mean fluorescence intensities between IL-21 + IL-27 cultures vs IL-21–alone cultures was 33%, 49%, and 66%, respectively (Figure 5B). These findings suggest that IL-27 affects the phenotype of plasmablasts and PCs that develop in this assay and/or accelerates the differentiation of memory B cells into PCs, which may be the consequence of STAT-signaling mediated via the IL-27 receptor. Our findings are supported by a study that showed that IL-27 could enhance in vitro differentiation of plasmablasts from cocultures of memory B cells and T-follicular helper cells from patients with chronic hepatitis B, which are deficient in IL-21.46

IL-27 enhances CD38 upregulation during in vitro PC differentiation. (A) PCs were generated from 4 healthy donors either with or without the addition of rIL-27 from day 0 to day 6 of the protocol (see text). The impact of IL-27 on PC differentiation was assessed by comparing the proportion of long-lived PCs on day 20, as determined by CD38 and CD138-positivity via flow cytometry. Representative dot plots and individual values are shown. (B) The expression of CD38 was compared throughout the protocol between B cells grown with or without rIL-27. Representative histograms and values from individual donors are shown. ∗∗∗P < .001; ∗∗∗∗P < .0001 by two-way ANOVA and Sidak multiple comparison test.
IL-27 enhances CD38 upregulation during in vitro PC differentiation. (A) PCs were generated from 4 healthy donors either with or without the addition of rIL-27 from day 0 to day 6 of the protocol (see text). The impact of IL-27 on PC differentiation was assessed by comparing the proportion of long-lived PCs on day 20, as determined by CD38 and CD138-positivity via flow cytometry. Representative dot plots and individual values are shown. (B) The expression of CD38 was compared throughout the protocol between B cells grown with or without rIL-27. Representative histograms and values from individual donors are shown. ∗∗∗P < .001; ∗∗∗∗P < .0001 by two-way ANOVA and Sidak multiple comparison test.
IL-27 upregulates CD38 on MM cells
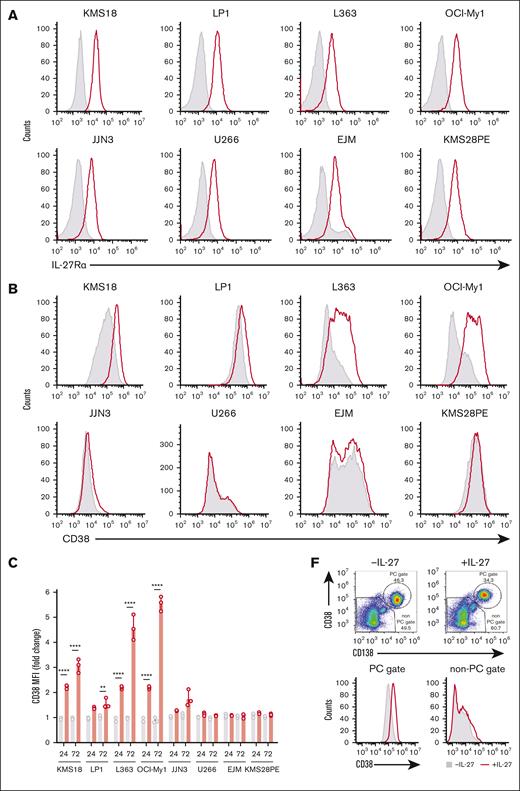
Based on our findings that IL-27 increased CD38 expression on the cell surface of in vitro–generated PCs and that MM cell lines and PCs phosphorylate STAT1 and STAT3 upon IL-27 stimulation, we assessed the impact of IL-27 on CD38 expression in MM cell lines and MM cells. Flow cytometric analysis detected expression of IL-27Rα in all MM cell lines tested (n = 8; Figure 6A). We cultured the MM cell lines for 3 days with and without IL-27 and observed that 5 of the 8 cell lines (KMS18, LP1, L363, OCI-My1, and JJN3) showed an IL-27–driven increase, ranging from ∼0.5 to more than fourfold before 72 hours, in CD38 cell-surface expression (Figure 6B-C). The absence of CD38 upregulation in U266 may be explained by the inability of this cell line to phosphorylate STATs (supplemental Figure 4). To verify that IL-27Rα ablation blocks IL-27–mediated upregulation of CD38 expression on MM cells, we generated IL-27Rα–deficient KMS18 cells using CRISPR–CRISPR-associated protein 9 methodology by using guide RNAs (gRNAs) targeting various exons of IL27RA and control gRNAs (supplemental Figure 7A) and culturing the cells with and without IL-27 for 96 hours (supplemental Figure 7B). The results showed that although untransduced KMS18 cells and cells transduced with 2 different control gRNAs showed CD38 upregulation upon addition of IL-27 to the cultures, no upregulation of CD38 expression was observed in IL27RA-knockout cells transduced with 4 independent gRNAs, demonstrating the requirement of the IL-27–IL-27Rα axis for CD38 upregulation.
IL-27 upregulates CD38 on MM cells and renders MM cells more sensitive to CD38-directed ADCC. (A) Expression of IL-27Rα (red) compared with isotype (gray) on 8 individual MM cell lines (KMS18, LP1, L363, OCI-My1, JJN3, U266, EJM, and KMS28PE). (B) MM cell lines were stimulated with 50 ng/mL rIL-27 for 72 hours. Cells were assessed for expression of CD38 at 24 and 72 hours after stimulation. Representative histograms showing CD38 expression after IL-27 stimulation (red) compared with basal CD38 expression (gray) are shown for individual cell lines 72 hours after stimulation. (C) Triplicate values for 24 and 72 hours are shown. (D) KMS18 cells were stimulated with or without 50 ng/mL rIL-27 with tofacitinib or dimethyl sulfoxide for 48 hours and then assessed for CD38 upregulation. (E) CD38-directed ADCC assay was performed using KMS18 target cells stimulated with and without 50 ng/ml rIL-27 for 3 days and labeled with 2 or 0.2 μM CTV, respectively, and then mixed in a 1:1 ratio as represented in the dot plot (top left). The histogram shows CD38 upregulation after IL-27 treatment (bottom left). The target-cell mix was incubated with daratumumab or control immunoglobulin G1 before addition of NK effector cells in a 1:1 ratio for 4 hours. The extent of killing was assessed by flow cytometry and represented as the percentage of target cells remaining, shown for a representative experiment as histogram (top) and a summary of (triplicate values) in a line graph (bottom). ∗∗P < .01 using paired Student t test. (F) BMA samples from patients with MM who were participating in the UKMRA Myeloma XII (ACCoRD) trial were stimulated with 50 ng/mL rIL-27 for 48 hours and assessed for CD38 expression at 24, 48, and 72 hours after stimulation. PCs were identified by CD38- and CD138-positivity followed by distinction of aPC (CD56hi CD19lo) and healthy PC (CD56lo CD19hi). Representative dot plot of PC identification is shown for a MM sample (donor 1 at 48 hours) either with or without IL-27 treatment and corresponding histograms (PC and non-PC gate) showing CD38 expression in cells treated with IL-27 (red) compared with no treatment (gray). (G) Histograms (day 3) and corresponding graphs showing increase in CD38 expression on aPCs in 5 individual MM BMA samples after IL-27 stimulation (red histograms) compared with basal CD38 expression (gray histogram) for 24, 48, and 72 hours. ∗∗P <. 01; ∗∗∗∗P < .0001 using one-way ANOVA and Tukey multiple comparison test.
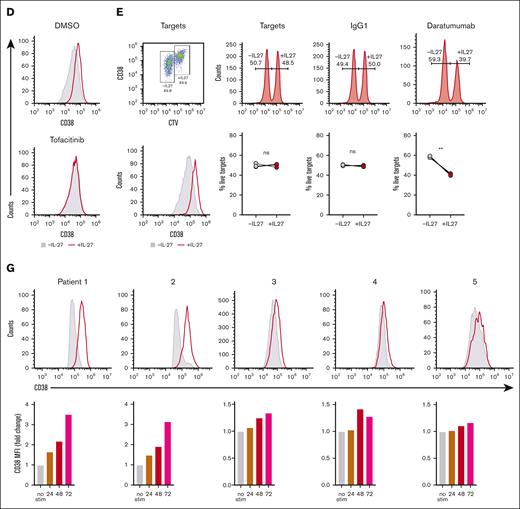
The importance of the JAK/STAT pathway in IL-27–mediated CD38 upregulation on MM cells was confirmed by demonstrating that the JAK/STAT inhibitor, tofacitinib, blocked IL-27–mediated upregulation of CD38 in KMS18 cells (Figure 6D). To verify that IL-27Rα ablation blocks IL-27–mediated STAT1/3-phosphorylation, we stimulated IL-27Rα–deficient KMS18 cells (supplemental Figure 7A) with IL-27 or carrier and measured STAT1 and STAT3 phosphorylation 30 minutes later (supplemental Figure 7C-D). The results showed that although untransduced KMS18 cells and cells transduced with 2 different control gRNAs showed STAT1 and STAT3 phosphorylation upon addition of IL-27 to the cultures, little or no STAT1/3 phosphorylation was observed in IL27RA-knockout cells transduced with 4 independent gRNAs, demonstrating that IL-27Rα is required for IL-27–mediated JAK/STAT pathway activation.
To determine the extent to which the IL-27–induced upregulation of CD38 on MM cell lines enhances CD38-directed ADCC, we performed an ADCC assay using KMS18 cells as target cells stimulated with and without 50 ng/mL IL-27 for 3 days and labeled them with 2 mM and 0.2 mM CTV, respectively. The labeled cell populations were mixed at equal proportions, as represented in Figure 6E (top-left dot plot); the extent of CD38 upregulation after IL-27 treatment is shown in Figure 6E (lower-left histogram). The labeled target-cell mix was incubated with daratumumab or control immunoglobulin G1 before the addition of NK effector cells in a 1:1 ratio for 4 hours, and the extent of killing was assessed via flow cytometric analysis, represented as the percentage of target cells remaining (Figure 6E). The results showed that IL-27–treated KMS18 MM cells were more sensitive to CD38-directed ADCC.
Finally, we assessed the extent to which IL-27 could upregulate CD38 in patient-derived MM cells. In all 5 patient samples assessed, IL-27 treatment resulted in upregulation of CD38 expression on aPCs, ranging from 0.17-fold in patient 5 to 2.52-fold in patient 1 (Figure 6F-G). No increase in CD38 expression was observed when non-PC cells were analyzed as a bulk population (Figure 6F-G, right). The findings that MM cell lines and primary MM cells upregulated CD38 upon IL-27 administration via JAK/STAT activation and that IL-27–mediated upregulation of CD38 rendered cells of an MM cell line more sensitive to CD38-directed ADCC identify this pathway as a potential strategy to enhance CD38 expression and thus invigorate anti-CD38 mAb therapy among patients who have relapsed and present with decreased CD38 expression on the tumor cells.
Discussion
Constitutive activation of the NF-ĸB signaling pathway has long been recognized as a critical player in MM pathogenesis. In recent years, there has been a focus on understanding the functions of downstream mediators of the NF-ĸB pathway, that is, the NF-ĸB transcription factor subunits and their transcriptional target genes.47-51 Because we previously found the NF-ĸB subunit RELA to specifically be required for the development of long-lived PCs,27 the healthy cellular counterparts of MM, we reasoned that a RELA-controlled transcriptional program may contribute to MM pathogenesis by controlling the interaction of MM cells with the TME and affect tumor cell growth and/or migration and dissemination.
The adhesion molecule JAM2 has not previously been associated with expression on MM cells. Of note, BM-derived PCs from healthy individuals showed a low level of JAM2 expression. This was in contrast to the markedly higher expression levels found on patient-derived MM cells, suggesting that JAM2 expression is a unique feature of malignant PCs (aPCs in Figure 4B). Based on studies of the JAM family members in various cell systems38,40,41 and our findings (supplemental Figure 5), the putative function of JAM2 is likely to facilitate transmigration of MM cells across the endothelial barriers, as has recently been suggested for the JAM family member JAM3. This adhesion molecule was found to be highly expressed on a subpopulation of MM cells with low or negative CD138 expression.52 Although the extent of JAM2 expression varied among the cases of our MM panel (Figure 4B), there was no correlation with CD138 expression levels. Although JAM2’s role in MM biology remains to be determined, a possible function of JAM2 in transendothelial migration may be to promote the dissemination of MM cells to other sites in the BM, which could potentially be prevented by JAM2-targeting mAbs, as proposed for JAM3 in a different disease context.40
Our results have identified IL-27Rα as a cytokine receptor subunit that appears to be active in MM cells. The IL-27 receptor comprises the IL-27Rα and IL6ST/gp130 molecules. Although IL-27Rα was downregulated in the MM lines upon RELA knockdown, IL6ST messenger RNA was upregulated. This finding may seem counterintuitive when proposing a role of IL-27 signaling in MM cells; however, evidence supports this notion. IL6ST/gp130 is also a subunit of the IL-6-receptor, and although IL-6 and IL-27 both activate the STAT1 and STAT3 pathways, they can also have opposing functions.53 The different biological functions are potentially because IL-27 signaling is predominantly via STAT1 rather than STAT3.34 Interestingly, mathematical modeling and experimental confirmation showed that STAT3 binds to the IL6ST/gp130 IL-27 receptor subunit, whereas STAT1 binds to IL-27Rα, concluding that IL-27 receptor subunit concentrations influence the ratios of phosphorylated STAT1 and phosphorylated STAT3, resulting in modified cytokine responses.54 Thus, a RELA-responsive upregulation of IL27RA expression with a concomitant downmodulation of IL6ST may shift the balance toward a phosphorylated STAT1–mediated cytokine response. How this putative scenario may apply to MM pathophysiology is presently unclear and would necessitate the identification of a source of IL-27 in the TME (of note, the presence of IL-27 in the BM of patients with MM has been reported55,56). Moreover, determining how changes in the balance of STAT3 and STAT1 cytokine response affect migration/dissemination and promotion of tumor cell growth and survival of MM cells will be of interest.
Although the function of a putative IL-27–IL27-receptor axis in MM biology remains to be elucidated, the observation that CD38 cell-surface expression was upregulated in MM cell lines and patient-derived MM cells upon IL-27 administration may have translational potential. CD38-directed mAb therapy is often successfully used in the treatment of patients with RRMM57,58 and in combination therapies for patients with newly diagnosed disease.59 However, many patients cannot be treated effectively with CD38-directed therapy because of either low levels of CD38 expression on MM cells, a reduction in CD38 expression on MM cells during the course of CD38-directed mAb therapy, or MM progression involving clones with reduced CD38 levels.12 Enhancing CD38 cell-surface levels has been identified as a strategy to increase the efficacy of CD38-directed mAb therapy.12,60,61 Moreover, it was found that although IL-6–induced STAT3 activity in MM cells downmodulates CD38 cell-surface expression, STAT1 activity has the opposite effect.62 Specifically, the JAK1/2 inhibitor ruxolitinib through inhibiting IL-6–driven STAT3 activation led to an increased CD38 expression on MM cells,62 presumably by modulating the STAT3:STAT1 ratio. Because we found IL-27, which predominately activates STAT1, to increase CD38 expression levels on MM cells, this cytokine, or drugs that alter the STAT1/3 balance downstream of the IL-27 receptor may have therapeutic value by enhancing sensitivity of MM cells to anti-CD38 antibody–mediated killing. Of note, enhanced CD38-directed ADCC of MM cells expressing elevated CD38 levels as a result of manipulating the STAT1/3 balance was demonstrated by both Ogiya et al and in this study (Figure 6E).62 Although a rationale for the potential therapeutic use of IL-27 has been established in other diseases,53,63 considering the development of IL-27–mediated strategies for MM therapy necessitates understanding the role of IL-27 in the biology of the MM TME.
Here, we have identified NF-ĸB RELA-responsive genes in MM cell lines that may provide a resource for focused studies on NF-ĸB–associated cell growth and survival-promoting mechanisms as well as migration/dissemination in MM. Two of the identified candidate molecules, the adhesion molecule JAM2 and the cytokine receptor subunit IL-27Rα, may exert still unrecognized roles in the interaction of MM cells with the TME. This may spur the development of alternative treatment strategies for MM.
Acknowledgments
The authors thank R. Dalla-Favera for providing the U266, JJN3, and KMS18 cell lines; P. Bergsagel for the OCI-My1 line; G. Cook for HUVEC cells; and F. Errington-Mais and M. Blunt for advice on ADCC assays. The authors thank R. Salmond, S. Papa, and C. Pepper for the discussion. The authors are grateful to all the patients who have agreed to the use of BMAs for research and the voluntary blood donors, without whom this study would not have been possible. The authors thank the University of Leeds faculty of Medicine and Health Flow Cytometry and next-generation sequencing facilities for the technical support.
This work was supported by a Blood Cancer UK grant (19002) (U.K.), trial (CRUK/15/008) (G.C.), Cancer Research UK program grant (C7845/A17723) (R.M.T.), and a Kay Kendall Leukaemia Fund grant (KKL1324) (U.K.)
Authorship
Contribution: R.J.B. designed research, performed research, analyzed data and wrote the manuscript; R.K. designed research, performed research and analyzed data; M.M. performed research and contributed vital new reagents; E.B.W. performed research; C.F.T. performed research and contributed tissue samples; D.W. and J.R.D. analyzed data; H.O. contributed tissue samples; E.J.A. and S.S. performed research; R.C. and D.J.H. contributed vital new reagents for viral transductions, and D.J.H. advised regarding CRISPR experiments; B.E.G. contributed reagents and advised regarding CRISPR experiments; P.V.G. contributed tissue samples; C.S. contributed vital new reagents; D.M. contributed tissue samples; R.M.T., D.R.W., and G.M.D. designed research and wrote the manuscript; G.C. contributed tissue samples and wrote the manuscript; and U.K. designed research, analyzed data and wrote the manuscript.
Conflict-of-interest disclosure: The authors declare no competing financial interests.
The current affiliation for D.W. is National Heart and Lung Institute, Imperial College London, London, United Kingdom.
Correspondence: Ulf Klein, Division of Haematology & Immunology, Leeds Institute of Medical Research at St James’s Hospital, University of Leeds, Room 6.19a Level 6, WTB Bldg, Leeds LS9 7TF, United Kingdom; e-mail: u.p.klein@leeds.ac.uk.

