

Key Points
Deubiquitinase USP1 overexpression correlated with poor prognosis in pediatric T-ALL.
USP1 promotes the aerobic glycolysis and progression of T-ALL via PLK1/LDHA axis.

Abstract
The effect of aerobic glycolysis remains elusive in pediatric T-cell acute lymphoblastic leukemia (T-ALL). Increasing evidence has revealed that dysregulation of deubiquitination is involved in glycolysis, by targeting glycolytic rate-limiting enzymes. Here, we demonstrated that upregulated deubiquitinase ubiquitin-specific peptidase 1 (USP1) expression correlated with poor prognosis in pediatric primary T-ALL samples. USP1 depletion abolished cellular proliferation and attenuated glycolytic metabolism. In vivo experiments showed that USP1 suppression decreased leukemia progression in nude mice. Inhibition of USP1 caused a decrease in both mRNA and protein levels in lactate dehydrogenase A (LDHA), a critical glycolytic enzyme. Moreover, USP1 interacted with and deubiquitinated polo-like kinase 1 (PLK1), a critical regulator of glycolysis. Overexpression of USP1 with upregulated PLK1 was observed in most samples of patients with T-ALL. In addition, PLK1 inhibition reduced LDHA expression and abrogated the USP1-mediated increase of cell proliferation and lactate level. Ectopic expression of LDHA can rescue the suppressive effect of USP1 silencing on cell growth and lactate production. Pharmacological inhibition of USP1 by ML323 exhibited cell cytotoxicity in human T-ALL cells. Taken together, our results demonstrated that USP1 may be a promising therapeutic target in pediatric T-ALL.
Introduction
T-cell acute lymphoblastic leukemia (T-ALL) is an aggressive hematologic malignancy derived from early T-cell progenitors.1 Introduction of intensified chemotherapy in T-ALL treatment significantly improves the overall cure rates of pediatric patients.2 However, the patients who fail to obtain a complete hematologic remission or whose disease relapses after initial response often have a poor prognosis with reduced survival.3 Thus, novel therapies are urgently needed to improve the disease prognosis.
An emerging hallmark of cancer is reprogramming of cellular metabolism. The best characteristic of these metabolic changes is the Warburg effect, the tendency for cancer cells to rely on glycolysis for energy and anabolic metabolism, even when oxygen is present.4 In T-ALL, glycolysis plays crucial roles in mediating leukemia cell proliferation, survival, and drug resistance.5-7 However, the mechanism of aerobic glycolysis in T-ALL needs to be further elucidated.
Deubiquitinating enzymes are a group of proteases that modulate ubiquitin-dependent pathways by cleaving ubiquitin-protein bonds. Ubiquitin-specific peptidase 1 (USP1) is overexpressed in several types of cancer, including T-ALL.8,9 USP1 regulates the Fanconi anemia DNA repair pathway by deubiquitination of FANCD2 and FANCI.10,11 It is also involved in preventing differentiation of osteosarcoma cells through deubiquitination and stabilization of ID2.12 And it has oncogenic roles during tumor progression in leukemia, myeloma, and breast cancer.13-16 However, little is known about the role of USP1 in cancer metabolism.
In this study, we discovered that USP1 regulated T-ALL cell aerobic glycolysis and proliferation through the polo-like kinase 1 (PLK1)/lactate dehydrogenase A (LDHA) pathway. Mechanistically, USP1 deubiquitinated and stabilized PLK1, promoting the expression of LDHA. More importantly, inhibition of USP1 with its inhibitor ML323, a specific USP1-UAF1 inhibitor, significantly inhibited the glycolysis and proliferation of T-ALL cells. Collectively, these findings reveal that USP1 may act as a promising therapeutic target for T-ALL.
Methods
Cell culture and reagents
The human T-lineage ALL cell lines, Jurkat and MOLT4, were purchased from the cell bank at Peking Union Medical University and cultured in RPMI 1640 (Keygentech Biotechnology Co, Ltd, Jiangsu, China) supplemented with 10% fetal bovine serum (Gibco), penicillin (100 U/mL), and streptomycin (100 mg/mL).
USP1 inhibitor ML323 and PLK1 inhibitor BI2536 were purchased from Selleck Chemicals. MG132 was purchased from Sigma-Aldrich. Glycolysis inhibitor 2-deoxyglucose (2-DG) was purchased from MedChemExpress(MCE). The primary antibodies against USP1, glyceraldehyde-3-phosphate dehydrogenase (GAPDH), and Flag were purchased from Proteintech. Anti-PLK1 antibody was purchased from Proteintech and Abcam. Anti-LDHA antibody was purchased from Beyotime Biotechnology. Anti-ubiquitin, AKT, and p-AKT (473) antibodies were purchased from Cell Signaling Technology. Monoclonal antibody against ID1 was purchased from Santa Cruz Biotechnology. Anti-human CD45 antibody was purchased from GeneTech Co, Ltd (Shanghai, China). PerCP anti-human CD45 antibody was purchased from Beijing Quantobio Biotechnology Co Ltd and phycoerythrin rat anti-mouse CD45 antibody was from BD Biosciences.
Patients
This study included 36 pediatric patients (age, 1-14 years; median, 7.3) newly diagnosed with T-lineage ALL and being treated at Hematology Center of Beijing Children’s Hospital, Capital Medical University, between February 2016 and July 2019. The Chinese Children’s Leukemia Group (CCLG)–ALL 2008 protocol17 was used in 22 patients and the CCLG-ALL 2018 protocol was used in 14 patients. A total of 4 samples were obtained from children with immune thrombocytopenic purpura as negative controls.
Plasmid construction
The full length of human USP1 and LDHA were cloned into lentiviral vector GV492 (GeneChem Co, Ltd, China) with C-terminal 3∗Flag tag. The full length of human USP1 rescue cDNA was cloned into lentiviral vector CV572 (GeneChem Co Ltd) with C-terminal cherry tag. Human USP1-targeting short hairpin RNA 1 (shRNA-1) oligonucleotide (5′-ccAGTGACCAAACAGGCATTA-3′), shRNA-2 oligonucleotide (5′-gcTAGTGGTTTGGAGTTTGAT-3′), shRNA-3 oligonucleotide (5′-ccAGAGACAAACTAGATCAAA-3′), and control scrambled shRNA (TTCTCCGAACGTGTCACGT) were cloned into the lentiviral GV493 shRNA expression vector (GeneChem Co Ltd).
Sample preparation
Mononuclear cells for the bone marrow (BM) samples collected at diagnosis, were separated as previously described and immediately stored at −70°C until use.18 This study was approved by the Beijing Children’s Hospital (BCH) Institutional Ethics Committee, and informed consent was obtained was obtained from parents or guardians of the patients, as appropriate, according to the Declaration of Helsinki.
RNA isolation and RT-PCR
Total RNA was extracted using Trizol reagent (Invitrogen). Isolated RNA was used as a template for the reverse transcription reaction (Invitrogen). Quantitative real-time polymerase chain reaction (qRT-PCR) analysis for genes in the glycolysis pathway in cell lines was carried out using PowerUP SYBR Green Master Mix (Applied Biosystems) on ViiA 7 System (Applied Biosystems). GAPDH was used as a loading control. The primer sequences used for LDHA, PCK2, BPGM, PFKFB2, GLO1, GAPDH, PGM2, ADH5, and LDHB were in supplemental Table 1. qRT-PCR analysis for USP1 expression in primary T-ALL samples was performed using Gene Expression Master Mix and TaqMan gene expression assay (Thermo Fisher Scientific). β-glucuronidase (GUS) was used as an internal control gene, and primers were in supplemental Table 1. We used the average Ct value of the BM samples obtained from 3 patients who have been in continuous complete remission for >5 years as a calibrator. The relative expression of USP1 was calculated using the 2−ΔΔCt method.
Immunoprecipitation and western blotting analysis
Pierce Classic Magnetic IP/Co-IP Kit (Thermo Fisher Scientific) was used for the immunoprecipitation assay. Cells were lysed in lysis/wash buffer supplemented with protease inhibitors (Roche Applied Science) on ice for 5 minutes. After centrifugation at 4°C and 12 000 revolutions per minute for 10 minutes, the supernatants were incubated with 2 μg primary antibodies at 4°C overnight and then incubated with protein A/G magnetic beads at room temperature for 1 hour. Next, the beads were washed with the lysis/wash buffer 3 times and with ultrapure water once. Finally, the bound proteins were dissolved in 2× sodium dodecyl sulfate polyacrylamide gel (SDS-PAGE) loading buffer and analyzed by western blotting. For in vivo deubiquitination assays, cells were treated with ML323 for 24 hours, and 10 μM MG132 was added 6 hours before the collection of cell lysates. Cell lysates were then collected for immunoprecipitation as described above.
For western blotting, proteins were separated by SDS-PAGE, transferred to polyvinylidene difluoride membranes (Millipore), and blocked and probed with primary antibodies at 4°C overnight. After washing, blots were incubated with horseradish peroxidase–conjugated secondary antibodies and visualized by superenhanced chemiluminescence detection reagent (Appygen).
Cell proliferation assay
Cell proliferation was determined using a Cell Counting Kit 8 (CCK-8) assay kit (Keygentech Biotechnology Co, Ltd). After transduction with USP1 sh-lentivirus for 24 hours, T-ALL cells were seeded onto the 96-well plates (3 × 10³ cells per well). The cells were cultured for varying periods of time, following which, 10 μL of CCK-8 reagent was added to each well and incubated at 37°C in 5% CO2 for 2 hours. Optical density at 450 nm was measured using a Multiskan GO Microplate Reader (Thermo Fisher Scientific). Each treatment was triplicated.
Determination of lactate production
Lactate levels were measured using a lactate colorimetric assay kit (Keygentec Biotechnology Co, Ltd) according to the manufacturer’s instructions. The value was measured on a microplate reader (Multiskan GO Microplate Reader) at an optical density of 530 nm.
Seahorse assay
Extracellular acidification rate (ECAR) and oxygen consumption rate (OCR) were measured using Seahorse XF Glycolysis Stress Test Kit and Seahorse XF Cell Mito Stress Test Kit in the Seahorse XFe 96 Extracellular Flux Analyzer (Seahorse Bioscience, North Billerica, MA), following the manufacturer’s protocols. A total of 3 × 10⁵ T-ALL cells per well were seeded into a Seahorse XF 96-well microplate. Thereafter, the cells were treated sequentially with glucose (10 mM), oligomycin (the oxidative phosphorylation inhibitor, 1 μM), and 2-DG (the glycolysis inhibitor, 50 mM) for measurement of ECAR. The cells were then treated sequentially with oligomycin (1 μM), oxidative phosphorylation p-trifluoromethoxy carbonyl cyanide phenyhydrazone (the reversible inhibitor, 1 μM), and rotenone/antimycin A (the mitochondrial complex inhibitor and the mitochondrial complex inhibitor, 0.5 μM) respectively. Data were analyzed by Seahorse XF-96 Wave software and expressed as picomoles per minute for OCR and mpH per minute for ECAR, respectively.
T-ALL xenografts
Female NOD.Cg-Prkdcscid Il2rgtm1Vst/Vst (NPG) mice aged 6 to 8 weeks were purchased from Beijing Vistalstar Biotechnology and kept under pathogen-free conditions. All the animal procedures were performed in accordance with the guidelines approved by the Capital Medical University Animal Care commission.
For Jurkat T-ALL IV transplantation studies, human Jurkat cells transduced with lentiviruses encoding control shRNA and USP1 shRNA-1 were IV injected into NPG mice (2.0 × 10⁶ cells in 80 μL of RPMI 1640). The body weight was measured every other day. Disease progression was monitored weekly by Wright-Giemsa staining of peripheral blood. After 25 days, the mice were killed. Spleens, femurs bones, and head were fixed in formaldehyde and further processed for hematoxylin and eosin (H&E) staining.
For MOLT4 T-ALL IV transplantation studies, human MOLT4 cells transduced with lentiviruses encoding control shRNA and USP1 shRNA-1 were IV injected into NPG mice (5.0 × 10⁵ cells in 200 μL of RPMI 1640). Blood was collected via tail nick on days 14 and 21 to measure tumor burden by staining for anti-human CD45 antibody. After 21 days, the mice were killed. Spleens were fixed in formaldehyde and further processed for H&E and immunohistochemistry staining. BM was collected for analysis of human CD45 expression (engraftment) using anti-human CD45 antibody.
For the ML323 in vivo experiment, a total of 1.0 × 10⁶ Jurkat cells were IV injected into mice, and then they were randomly assigned to treatment groups (5 mice per group). Mice were treated 10 times, with ML323 (5 mg/kg, dissolved in 2% dimethyl sulfoxide, 40% polyethylene glycol 300, and 2% Tween80) or vehicle solution, by intraperitoneal injection since the next day after incubation, once every other day.15 The time of death was recorded.
RNA sequencing
Total RNA was extracted by Trizol reagent. RNA sequencing analysis was conducted at the GeneChem Corporation. RNA integrity was assessed using the RNA Nano 6000 Assay Kit of the Bioanalyzer 2100 system (Agilent Technologies, Santa Clara, CA). Sequencing libraries were generated using NEBNext UltraTM RNA Library Prep Kit for Illumina (New England Biolabs, Ipswich, MA) and sequenced on an Illumina Novaseq platform. Raw data (raw reads) of fastq format were first processed through in-house perl scripts. FeatureCounts v1.5.0-p3 was used to count the reads numbers mapped to each gene. And then fragments per kilo base per million mapped reads of each gene was calculated based on the length of the gene and reads count mapped to this gene. Differential expression analysis was performed using the DESeq2 R package (1.16.1). The genes that fold change ≤ −1, adjusted P < .05 were considered as significantly-downregulated genes, and subjected to pathway enrichment analysis through ClusterProfiler R package (3.16.1) using the the gene sets in HALLMARK database. The gene set enrichment analysis (GSEA) was performed using R package ClusterProfiler (3.16.1) using glycolysis-related gene sets obtained from the MSigDB database.
Bioinformatic analysis of T-ALL data set
The T-ALL transcriptome data set (GSE13159) was downloaded from Gene Expression Omnibus database (https://www.ncbi.nlm.nih.gov/geo/query/acc.cgi?acc=GSE13159). The transcriptome data set with 231 children with newly diagnosed ALL treated in Ma-Spore frontline ALL clinical trials were downloaded from the European Genome-phenome Archive (http://www.ebi.ac.uk/ega; accession number EGAS00001001858). The gene set variation analysis (GSVA) score was determined by GSVA package (1.36.3). Spearman correlation between GSVA score and gene expression was evaluated by cor.test function.
Statistical analysis
Student t test or Mann-Whitney U test were performed to evaluate differences between 2 or multiple groups. The correlation between USP1 and PLK1 was analyzed using Pearson correlation analysis. Relapse was defined as the reappearance of leukemic cells in BM (>5% blasts) and/or the reappearance of clinical evidence of the disease. Relapse-free survival was defined as the time from complete remission to the date of relapse, censored at date of last time of contact, or death in remission. The probability of relapse-free survival was estimated using the Kaplan-Meier method. Figures and analyses were generated with GraphPad Prism 5 software.
Results
USP1 is highly expressed in pediatric T-ALLs and associated with poor prognosis
To determine the expression of USP1 in T-ALL, we reanalyzed the published data set GSE13159 and found that USP1 in pediatric primary T-ALL was markedly overexpressed than normal BM cells (Figure 1A). Our previous transcriptome sequencing data of 231 pediatric ALL showed that USP1 expression was much higher in T-ALL than in B-ALL (Figure 1B).19 To further explore the clinical relevance of USP1 expression, we performed qRT-PCR to estimate the messenger RNA (mRNA) levels of USP1 in 36 pediatric primary T-ALL samples and subdivided them into 2 groups (USP1-low and USP1-high) with a cutoff value at the third quartile of USP1 expression. Further analysis of survival data revealed that patients with elevated USP1 mRNA expression were significantly associated with a higher risk of relapse (P = .03) (Figure 1C). In line with the mRNA expression results, USP1 protein was also highly expressed in T-ALL BM samples (n = 20) than the control immune thrombocytopenic purpura ones determined by western blot (Figure 1D-E). Together, these findings illustrated that USP1 was overexpressed in pediatric T-ALLs and elevated expression of USP1 was probably associated with poor prognosis.

USP1 is overexpressed in T-ALL. (A) Scatter dot plots showing the mRNA levels of USP1 in normal BM from healthy donors and primary T-ALL (73 normal BM and 169 T-ALL samples). Data were obtained from the GSE13159. Two-sided Mann-Whitney tests. (B) Analysis of USP1 expression in 231 primary pediatric ALL samples that are categorized into 7 different subtypes in the Ma-Spore ALL study cohort (Wilcoxon rank-sum test, T-ALL vs B-ALL, P<0.0001). (C) Cumulative relapse incidence in 36 pediatric patients with T-ALL; P = .034. (D-E) Immunoblots of USP1 in 20 primary pediatric T-ALL samples are indicated. Representative immunoblotting image of USP1 is shown in panel D. Four samples from pediatric patients with immune thrombocytopenic purpura (ITP) were used as negative controls. Glyceraldehyde-3-phosphate dehydrogenase (GAPDH) serves as a loading control. The relative protein expression levels of USP1 are shown in panel E. Two-sided Mann-Whitney tests; ∗∗P < .01, ∗∗∗P < .001. FPKM, fragments per kilo base per million mapped reads.
USP1 is overexpressed in T-ALL. (A) Scatter dot plots showing the mRNA levels of USP1 in normal BM from healthy donors and primary T-ALL (73 normal BM and 169 T-ALL samples). Data were obtained from the GSE13159. Two-sided Mann-Whitney tests. (B) Analysis of USP1 expression in 231 primary pediatric ALL samples that are categorized into 7 different subtypes in the Ma-Spore ALL study cohort (Wilcoxon rank-sum test, T-ALL vs B-ALL, P<0.0001). (C) Cumulative relapse incidence in 36 pediatric patients with T-ALL; P = .034. (D-E) Immunoblots of USP1 in 20 primary pediatric T-ALL samples are indicated. Representative immunoblotting image of USP1 is shown in panel D. Four samples from pediatric patients with immune thrombocytopenic purpura (ITP) were used as negative controls. Glyceraldehyde-3-phosphate dehydrogenase (GAPDH) serves as a loading control. The relative protein expression levels of USP1 are shown in panel E. Two-sided Mann-Whitney tests; ∗∗P < .01, ∗∗∗P < .001. FPKM, fragments per kilo base per million mapped reads.
USP1 knockdown suppresses T-ALL cell proliferation in vitro and in vivo
Given the abnormal expression of USP1 in T-ALL, we assessed whether USP1 knockdown affects T-ALL cell growth in vitro. We used the lentivirus vector–mediated shRNA to knock down the expression of USP1 in T-ALL cell lines Jurkat and MOLT4. The CCK-8 assay showed that the proliferation ability of T-ALL cells significantly decreased after the knock down of USP1 (Figure 2A-B; supplemental Figure 1A-B). Collectively, these results suggested that USP1 was important for the survival of T-ALL cells in vitro.
![USP1 inhibition suppresses T-ALL cell proliferation in vitro and in vivo. (A-B) Jurkat and MOLT4 cells were infected with control shRNA or USP1 shRNAs, and cell proliferation was monitored by CCK-8 array. USP1 expression in cells was measured by immunoblotting (left). (C) Jurkat cells stably expression control or USP1-shRNA were injected into NPG nude mice. The body weights of mice are shown (mean ± standard deviation [SD] of 9 mice). Two-sided t test. (D-E) After 25 days, the mice were killed and their T-ALL progression was analyzed. Representative spleen images are shown in panel D. The spleen weights are shown (n = 9 in control and USP1 shRNA cohort). Two-sided Mann-Whitney tests. (F) Representative spleen H&E and immunohistochemistry images are presented. (G) Representative bone H&E and immunohistochemistry images are presented. Scale bars, 50 μM (F-G). (H) Wright staining of BM (top) and peripheral blood (bottom) cytospin samples from the control mice and USP1-depleted mice. (I) Mouse survival is shown (n = 6 in the control and USP1-shRNA cohort).](/view-large/figure/11759432/BLOODA_ADV-2022-008284-gr2.jpg)
USP1 inhibition suppresses T-ALL cell proliferation in vitro and in vivo. (A-B) Jurkat and MOLT4 cells were infected with control shRNA or USP1 shRNAs, and cell proliferation was monitored by CCK-8 array. USP1 expression in cells was measured by immunoblotting (left). (C) Jurkat cells stably expression control or USP1-shRNA were injected into NPG nude mice. The body weights of mice are shown (mean ± standard deviation [SD] of 9 mice). Two-sided t test. (D-E) After 25 days, the mice were killed and their T-ALL progression was analyzed. Representative spleen images are shown in panel D. The spleen weights are shown (n = 9 in control and USP1 shRNA cohort). Two-sided Mann-Whitney tests. (F) Representative spleen H&E and immunohistochemistry images are presented. (G) Representative bone H&E and immunohistochemistry images are presented. Scale bars, 50 μM (F-G). (H) Wright staining of BM (top) and peripheral blood (bottom) cytospin samples from the control mice and USP1-depleted mice. (I) Mouse survival is shown (n = 6 in the control and USP1-shRNA cohort).
USP1 inhibition suppresses T-ALL cell proliferation in vitro and in vivo. (A-B) Jurkat and MOLT4 cells were infected with control shRNA or USP1 shRNAs, and cell proliferation was monitored by CCK-8 array. USP1 expression in cells was measured by immunoblotting (left). (C) Jurkat cells stably expression control or USP1-shRNA were injected into NPG nude mice. The body weights of mice are shown (mean ± standard deviation [SD] of 9 mice). Two-sided t test. (D-E) After 25 days, the mice were killed and their T-ALL progression was analyzed. Representative spleen images are shown in panel D. The spleen weights are shown (n = 9 in control and USP1 shRNA cohort). Two-sided Mann-Whitney tests. (F) Representative spleen H&E and immunohistochemistry images are presented. (G) Representative bone H&E and immunohistochemistry images are presented. Scale bars, 50 μM (F-G). (H) Wright staining of BM (top) and peripheral blood (bottom) cytospin samples from the control mice and USP1-depleted mice. (I) Mouse survival is shown (n = 6 in the control and USP1-shRNA cohort).
To further explore these findings in vivo, 2 million Jurkat cells with or without USP1 knockdown were IV injected into NPG mice. At 25 days after engraftment, the control cohort began to show typical leukemia phenotypes, such as weight loss and hindlimb paralysis. The body weight of the USP1-depleted cohort was much heavier than those of the control cohort (P = .0036) (Figure 2C). Moreover, the risk of developing hindlimb paralysis was much higher in the control group than in the USP1-depleted group (P = .0058) (supplemental Figure 1C). The leptomeninges of USP1-depleted cohort had less leukemia cells infiltration than those of the control group (supplemental Figure 1D-E). Notably, the spleens of the USP1-depleted cohort were smaller than those of the control cohort (Figure 2D-E). H&E staining indicated that the USP1-depleted mice had less infiltration of lymphoblastic leukemia cells into the spleen and BM than the control group (Figure 2F-G). In addition, Wright-Giemsa staining analysis revealed that more human leukemia cells were detected in the peripheral blood and BM of the control mice than in the counterpart of USP1-depleted mice (Figure 2H). Of note, there was a significant prolonged leukemia-free survival in USP1-depleted mice (P = .0242) (Figure 2I). To confirm these observations, we replicated the in vivo experiment using the MOLT4 cell lines. Consistent with results using Jurkat cells, there were less leukemia cells infiltration into spleen and BM, and a significant prolonged leukemia-free survival in the USP1-depleted group than that in the control group (supplemental Figure 1F-K). Taken together, these observations provided compelling evidence supporting the critical importance of USP1 in T-ALL progression in vivo.
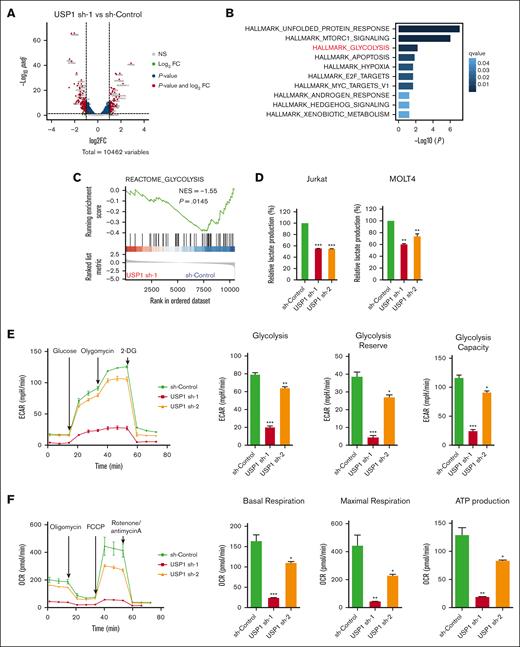
USP1 inhibition impairs aerobic glycolysis
To interrogate the molecular function of USP1 in T-ALL, we performed transcriptome sequencing to unravel USP1 downregulation–induced transcriptional changes (Figure 3A). Functional enrichment analysis of USP1-promoting genes suggested that USP1 may contribute to unfolded protein response, MTORC1 signaling, and glycolysis process, in which the regulation of glycolysis is a previously unrecognized role of this deubiquitinase (Figure 3B). By using other analyzing tool, the GSEA also detected the silencing of a set of glycolysis-related genes in USP1-depleted cells (Figure 3C). Experimentally, to assess the effect of USP1 depletion on aerobic glycolysis, we first measured the extracellular levels of lactate, the major byproduct of glucose breakdown. After the transduction of lentiviruses for 96 hours, there was a significant decrease in lactate levels in the USP1 knockdown group than the control cohort (Figure 3D; supplemental Figure 2E-F). Next, we used Seahorse XFe 96 Extracellular Flux Analyzer to measure ECAR (an indicator of glycolysis) and OCR (an indicator of oxidative phosphorylation) in Jurkat cells. As shown in Figure 3E, knockdown of USP1 significantly suppressed glycolytic rate, reserve, and capacity. In addition, OCR results showed that basal respiration, maximal respiration, and adenosine triphosphate (ATP) production were also downregulated after USP1 inhibition (Figure 3F). Collectively, these results indicate that USP1 plays a role in regulating glycolysis in T-ALL cells.
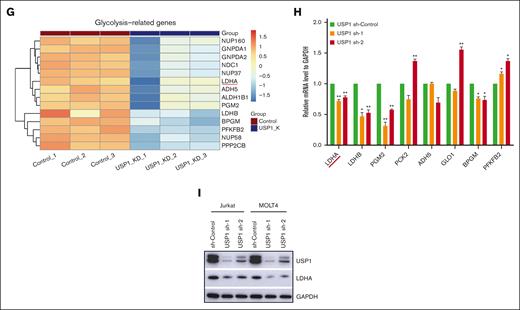
USP1 promotes glycolysis by regulating LDHA. (A) Jurkat cells were infected with lentiviruses expressing control (sh-control) or USP1 shRNA (USP1 sh-1). Volcano plot shows the significant upregulated genes (foldchange [FC] > 2, adjusted P < .05, total counts >750) and downregulated genes (FC < −2, adjusted P < .05, total counts >750) upon USP1 depletion. (B) Functional enrichment of downregulated genes in HALLMARK gene signatures. The significantly enriched signatures were ranked by q values. (C) GSEA of genes ranked by log2FC (sh-USP1/sh-control) values using REACTOME_CLYCOLYSIS gene set to show the deactivation of this set of genes in USP1 downregulated cells. (D) Jurkat and MOLT4 cells were infected with control shRNA or USP1 shRNAs for 96 hours and lactate production was analyzed. Two-tailed t test. Data are shown as mean ± SD, n = 3. (E) ECAR, glycolysis, glycolysis reserve, and glycolysis capacity in Jurkat cells. Data are shown as mean ± SD, n = 3. (F) OCR, basal respiration, maximal respiration, and ATP production in Jurkat cells. Data are shown as mean ± SD, n = 3. (G) Heatmap shows the expression changes of glycolysis-related enzymes in the control and USP1 knockdown cells based on the transcriptome assays. (H) RT-PCR analysis of the expression of a group of glycolysis-related genes in control shRNA or USP1 shRNAs transduced Jurkat cells. Two-tailed t test. Data are shown as mean ± SD, n = 3. (I) Jurkat and MOLT4 cells were infected with sh-Control or USP1 shRNA. The protein levels of USP1, LDHA, and GAPDH were assessed. ∗P < .05, ∗∗P < .01, ∗∗∗P < .001. NES, normalized enrichment score.
LDHA is a downstream effector of USP1
To further elucidate the molecular mechanisms underlying the proglycolysis effects of USP1 in T-ALL, we analyzed the transcriptional profiles and found that quite a lot of genes related to glycolysis (eg, LDHA, LDHB, BPGM, ADH5, and PFKFB2) were transcriptionally downregulated in USP1-depleted cells (Figure 3G). With using qRT-PCR, we further confirmed the expression of a few genes differentially expressed in USP1-WT and knockdown cells, and found that the expression of LDHA was remarkably decreased by USP1 knockdown (Figure 3H). LDHA is a key protein in the glycolytic pathway, converting pyruvate to lactate. Overexpression of LDHA is associated with an unfavorable prognosis for several cancers and resistance to radiotherapy.20 To validate our findings in T-ALL samples, we estimated the glycolysis activity scores by GSVA algorithm according to HALLMARK_GLYCOLYSIS and REACTOME_GLYCOLYSIS gene sets and tested their association with USP1 expression. The results showed that USP1 positively correlated with glycolysis GSVA signatures in TARGET database (supplemental Figure 2B-C). In addition, USP1 positively correlated with LDHA mRNA levels (supplemental Figure 2D), verifying the regulatory role of USP1 to LDHA in T-ALL samples. Moreover, after USP1 inhibition, the protein expression level of LDHA was significantly decreased (Figure 3I). Coimmunoprecipitation analysis showed that there was no interaction between LDHA and USP1 (supplemental Figure 3A). Collectively, these data demonstrate that LDHA is a downstream effector of USP1, and USP1 enhances glycolysis by increasing both the mRNA and protein levels of LDHA in T-ALL. Considering that USP1 is a deubiquitinase regulating protein degradation, it might regulate LDHA expression via some intermediate factors.
USP1 interacts with and stabilizes PLK1 via deubiquitination
GSEA results showed that USP1 was significantly enriched in pathways related to the PID_PLK1 pathway (Figure 4A). In addition, previous studies reported that PLK1 was an important regulator of glycolysis and pentose phosphate pathway.21-24 Moreover, pharmacological inhibition of PLK1 with BI2536 reduced the protein and mRNA levels of LDHA (supplemental Figure 4A-B) and the lactate level (supplemental Figure 4C-D), suggesting that PLK1 is probably the mediator between USP1 and LDHA. To test this hypothesis, we examined the interaction between USP1 and PLK1. Coimmunoprecipitation analysis was performed in Jurkat and MOLT4 cells using anti-PLK1 and anti-USP1 antibodies. PLK1 was found to precipitate with USP1, suggesting that PLK1 may interact with USP1 directly (Figure 4B-C). Next, we assessed whether USP1 could regulate PLK1 expression in T-ALL cells. As shown in Figure 4D-E, PLK1 expression was significantly impaired by USP1 deletion in T-ALL cells. Besides, USP1 overexpression in Jurkat cells markedly enhanced PLK1 expression in the protein level (Figure 4F). These observations suggest that USP1 interacts with PLK1 and facilitates its expression in T-ALL cells.

USP1 stabilized PLK1 via its deubiquitination. (A) GSEA plots showing the enrichment of gene signatures associated with PLK1 pathway in the USP1-depledted vs sh-control group. (B-C) Cell lysates of Jurkat and MOLT4 cells were precipitated with anti-PLK1 or anti-USP1 antibodies, and the precipitates were examined by immunoblotting. Immunoblot analysis of USP1 and PLK1 expression in Jurkat (D) and MOLT4 (E) cells infected with sh-control or USP1-shRNA. (F) Immunoblot analysis of USP1 and PLK1 expression in Jurkat cells with or without overexpression of USP1-flag. (G) Jurkat cells infected with control or USP1 shRNA were treated with dimethyl sulfoxide (DMSO) or MG132 for 12 hours. The expression of PLK1 and USP1 was assessed. (H) Jurkat cells were treated with DMSO or ML323. The lysates were immunoprecipitated with anti-PLK1 antibody. UB-PLK1 was analyzed by anti-ubiquitin antibody. The expression of GAPDH in whole cell lysates was analyzed as a control. (I) The expression of USP1 and PLK1 in primary pediatric T-ALL samples was measured. The representative immunoblotting image of USP1 and PLK1 expression (left) is shown. The correlation between USP1 and PLK1 expression in T-ALL samples is shown (right) (by the Pearson correlation test, n = 11). IgG, immunoglobulin G; IP, immunoprecipitation.
USP1 stabilized PLK1 via its deubiquitination. (A) GSEA plots showing the enrichment of gene signatures associated with PLK1 pathway in the USP1-depledted vs sh-control group. (B-C) Cell lysates of Jurkat and MOLT4 cells were precipitated with anti-PLK1 or anti-USP1 antibodies, and the precipitates were examined by immunoblotting. Immunoblot analysis of USP1 and PLK1 expression in Jurkat (D) and MOLT4 (E) cells infected with sh-control or USP1-shRNA. (F) Immunoblot analysis of USP1 and PLK1 expression in Jurkat cells with or without overexpression of USP1-flag. (G) Jurkat cells infected with control or USP1 shRNA were treated with dimethyl sulfoxide (DMSO) or MG132 for 12 hours. The expression of PLK1 and USP1 was assessed. (H) Jurkat cells were treated with DMSO or ML323. The lysates were immunoprecipitated with anti-PLK1 antibody. UB-PLK1 was analyzed by anti-ubiquitin antibody. The expression of GAPDH in whole cell lysates was analyzed as a control. (I) The expression of USP1 and PLK1 in primary pediatric T-ALL samples was measured. The representative immunoblotting image of USP1 and PLK1 expression (left) is shown. The correlation between USP1 and PLK1 expression in T-ALL samples is shown (right) (by the Pearson correlation test, n = 11). IgG, immunoglobulin G; IP, immunoprecipitation.
Because USP1 knockdown did not significantly change the gene expression of PLK1 in T-ALL cells (supplemental Figure 4E), we further questioned whether the interaction between USP1 and PLK1 is required for increasing the expression of PLK1. The addition of the proteasome inhibitor MG132 could prevent the downregulation of PLK1 caused by USP1 inhibition (Figure 4G), suggesting that USP1 regulates PLK1 posttranslationally in T-ALL cells. Furthermore, immunoprecipitation experiments with anti-PLK1 antibody followed by immunoblotting with anti-ubiquitin antibody were conducted to confirm this finding. As shown in Figure 4H, in the presence of MG132, the ubiquitin was observed in the PLK1 immunocomplex, and its amount was significantly increased in the group with USP1 inhibitor ML323. Western blot analysis confirmed ubiquitination assay loading control. Moreover, there was a positive correlation between the protein expression of USP1 and PLK1 examined by western blot in 11 primary T-ALL samples (Figure 4I), validating the USP1-mediated regulation of PLK1 expression further.
USP1 promotes T-ALL cell glycolysis and proliferation by regulating PLK1-LDHA axis
To assess whether USP1 contributes to glycolysis and proliferation of T-ALL cells through the regulation of PLK1-LDHA axis, we added PLK1 inhibitor BI2536 into Jurkat cells with forced expression of USP1. As shown in Figure 5A-B, inhibiting PLK1 profoundly counteracted the USP1-mediated enhancement of proliferation and lactate production. In accordance with the observation, inhibiting PLK1 also significantly counteracted the USP1-mediated increase of LDHA expression (Figure 5C). More importantly, ectopic expression of LDHA or USP1 in USP1 knockdown cells can rescue the effect of USP1 silencing on cell growth and lactate production (Figure 5D-F). Collectively, these results emphasize a significant role of PLK1-LDHA axis in USP1-mediated promotion of T-ALL cell glycolysis and proliferation.

USP1 promotes cell proliferation and glycolysis via PLK1-LDHA axis. (A) Jurkat cells were infected with vector or USP1-flag lentivirus. Then the USP1 overexpression group was treated with BI2536 (30 nM) for 48 hours. CCK-8 was used to assess the cell proliferation. (B) The lactate production was tested. Data are shown as mean ± SD, n = 3. (C) The expression of USP1 and LDHA was measured. (D) Jurkat cells were infected with USP1 sh-control, USP1 sh-1, or cotransduced with LDHA-flag or USP1-cherry lentivirus. Then CCK-8 was used to assess the cell proliferation. (E) Jurkat cells were infected with USP1 sh-control, USP1 sh-1, or cotransduced with LDHA-flag or USP1-cherry lentivirus. The lactate production was tested. Data are shown as mean ± SD, n = 3. ∗∗P < .01, ∗∗∗P < .001. (F) The expression of USP1 and LDHA was measured. OD, optical density.
USP1 promotes cell proliferation and glycolysis via PLK1-LDHA axis. (A) Jurkat cells were infected with vector or USP1-flag lentivirus. Then the USP1 overexpression group was treated with BI2536 (30 nM) for 48 hours. CCK-8 was used to assess the cell proliferation. (B) The lactate production was tested. Data are shown as mean ± SD, n = 3. (C) The expression of USP1 and LDHA was measured. (D) Jurkat cells were infected with USP1 sh-control, USP1 sh-1, or cotransduced with LDHA-flag or USP1-cherry lentivirus. Then CCK-8 was used to assess the cell proliferation. (E) Jurkat cells were infected with USP1 sh-control, USP1 sh-1, or cotransduced with LDHA-flag or USP1-cherry lentivirus. The lactate production was tested. Data are shown as mean ± SD, n = 3. ∗∗P < .01, ∗∗∗P < .001. (F) The expression of USP1 and LDHA was measured. OD, optical density.
Pharmacological inhibition of USP1 suppresses the proliferation and glycolysis in T-ALL cells
On the basis of the findings that USP1 depletion impeded the proliferation and glycolysis of T-ALL cells, we next assessed the effect of the USP1 inhibitor ML323 on cell viability in T-ALL cell lines. As shown in Figure 6A, ML323 reduced the cell viability in a dose-dependent manner. Notably, ML323 induced a dose-dependent cytotoxicity in primary T-ALL cells isolated from peripheral blood mononuclear cells of 1 pediatric patient with T-ALL (Figure 6B). Moreover, after ML323 treatment in Jurkat cells, the level of lactate production also decreased (Figure 6C). And the glycolysis inhibitor 2-DG was also cytotoxic to T-ALL cells and reduced their viability (Figure 6D), indicating glycolysis might be responsible for the reduced T-ALL cell viability after ML323 treatment. To further potentiate the therapeutic impact of USP1 inhibition, 1 million Jurkat cells were IV injected into NPG mice. Then they were randomized into different groups that were treated with vehicle or USP1 inhibitor ML323 (5 mg/kg). Results showed that USP1 suppression led to an extension of mouse survival (P = .0019) (Figure 6E). These results demonstrate that USP1 inhibition by ML323 is cytotoxic to T-ALL cell lines and cells from patient with T-ALL.
![USP1 inhibitor is cytotic in T-ALL cells by inhibiting glycolysis. (A) T-ALL cell lines (Jurkat and MOLT4) were treated with increasing concentrations of ML323 for 48 hours, followed by assessment of cell viability using a CCK-8 assay. Two-tailed t test. Data are shown as mean ± SD, n = 3. (B) Primary T-ALL cells were isolated and treated with different concentrations of ML323 for 48 hours, and the cell viability was monitored via CCK-8 assay. Two-tailed t test. Data are shown as mean ± SD, n = 3. (C) Mouse survival is shown (n = 5 in the vehicle and USP1 inhibitor ML323 [5 mg/kg] treatment cohort respectively). (D) T-ALL cell lines (Jurkat and MOLT4) were treated with 2-DG for 48 hours, followed by assessment of cell viability using a CCK-8 assay. Two-tailed t test. Data are shown as mean ± SD, n = 3. (E) Jurkat cells were treated with ML323 for 48 hours, and lactate production was analyzed. Two-tailed t test. Data are shown as mean ± SD, n = 3. ∗P < .05, ∗∗P < .01, ∗∗∗P < .001.](/view-large/figure/11759450/BLOODA_ADV-2022-008284-gr6.jpg)
USP1 inhibitor is cytotic in T-ALL cells by inhibiting glycolysis. (A) T-ALL cell lines (Jurkat and MOLT4) were treated with increasing concentrations of ML323 for 48 hours, followed by assessment of cell viability using a CCK-8 assay. Two-tailed t test. Data are shown as mean ± SD, n = 3. (B) Primary T-ALL cells were isolated and treated with different concentrations of ML323 for 48 hours, and the cell viability was monitored via CCK-8 assay. Two-tailed t test. Data are shown as mean ± SD, n = 3. (C) Mouse survival is shown (n = 5 in the vehicle and USP1 inhibitor ML323 [5 mg/kg] treatment cohort respectively). (D) T-ALL cell lines (Jurkat and MOLT4) were treated with 2-DG for 48 hours, followed by assessment of cell viability using a CCK-8 assay. Two-tailed t test. Data are shown as mean ± SD, n = 3. (E) Jurkat cells were treated with ML323 for 48 hours, and lactate production was analyzed. Two-tailed t test. Data are shown as mean ± SD, n = 3. ∗P < .05, ∗∗P < .01, ∗∗∗P < .001.
USP1 inhibitor is cytotic in T-ALL cells by inhibiting glycolysis. (A) T-ALL cell lines (Jurkat and MOLT4) were treated with increasing concentrations of ML323 for 48 hours, followed by assessment of cell viability using a CCK-8 assay. Two-tailed t test. Data are shown as mean ± SD, n = 3. (B) Primary T-ALL cells were isolated and treated with different concentrations of ML323 for 48 hours, and the cell viability was monitored via CCK-8 assay. Two-tailed t test. Data are shown as mean ± SD, n = 3. (C) Mouse survival is shown (n = 5 in the vehicle and USP1 inhibitor ML323 [5 mg/kg] treatment cohort respectively). (D) T-ALL cell lines (Jurkat and MOLT4) were treated with 2-DG for 48 hours, followed by assessment of cell viability using a CCK-8 assay. Two-tailed t test. Data are shown as mean ± SD, n = 3. (E) Jurkat cells were treated with ML323 for 48 hours, and lactate production was analyzed. Two-tailed t test. Data are shown as mean ± SD, n = 3. ∗P < .05, ∗∗P < .01, ∗∗∗P < .001.
Discussion
Ubiquitination deregulation often causes metabolic reprogramming in cancer.25 However, the underlying mechanisms remain largely elusive. In this study, we identified the deubiquitinase USP1 as a proglycolysis factor in T-ALL, and found that the overexpressed USP1 is associated with T-ALL relapse in children. Some recent studies have reported the oncogenic functions of USP1 in multiple cancers.9 USP1 deubiquitylates ID proteins to help maintain stem cell properties in osteosarcoma.12 Moreover, USP1 regulates the Fanconi anemia pathway by deubiquitinating FANCD2.10,11,15 Of note, USP1 also promotes cancer cell proliferation and drug resistance in cancers, including T-ALL.8,26 In this study, we found that USP1 knockdown decreased cell proliferation in vitro and in vivo. Notably, we uncovered a potentially novel function of USP1 in regulating leukemia cell metabolism. The extracellular levels of lactate, ECAR, and OCR decreased after USP1 suppression. Consistently, our RNA sequencing results revealed that a list of glycolysis-related genes is regulated by USP1. Most intriguingly, the key glycolytic enzyme, LDHA, was confirmed as a downstream effector of USP1 by qPCR and western blot. Thus, these findings provide strong evidence that USP1 promotes glycolysis by regulating LDHA in T-ALL.
Aerobic glycolysis accelerates the growth of cancer cell to promote tumor initiation and progression.27 In our study, we demonstrated that USP1 knockdown caused an inhibition in glycolysis. Moreover, OCR and ATP production were also reduced by USP1 suppression. The probable reason might be that the reduced glycolysis caused by USP1 inhibition decreased the level of pyruvate which is the fuel for mitochondrial oxidative phosphorylation. The suppression of both glycolysis and mitochondrial oxidative phosphorylation might explain why USP1 inhibition caused ATP depletion.
Recent studies have reported that the ubiquitination/deubiquitination plays an essential role in regulating the metabolic reprogramming of tumor cells by controlling the activity of glycolytic rate-limiting enzyme.28-31 LDHA facilitates glycolytic process by converting pyruvate to lactate, and aberrant expression and activation of LDHA have been found in multiple cancers and is associated with poor prognosis in cancers including T-ALL. In addition, the LDHA inhibitor exerted an antileukemic effect on T-ALL.20,32 Thus, LDHA is considered as a promising therapeutic target of T-ALL. However, the regulatory mechanism of LDHA overexpression in cancers remains unknown. In our data, both the mRNA and protein levels of LDHA have been decreased after USP1 inhibition, and there was no interaction between them. Given that USP1 regulates downstream targets by deubiquitination, we speculate that USP1 might regulate the expression of LDHA through deubiquitinating some intermediate factors.
Our GSEA results showed that USP1 was significantly enriched in pathways related to the PID_PLK1 pathway, implying that PLK1 is a probable downstream factor of USP1. Importantly, previous studies reported that PLK1 is an important regulator of the glycolysis and pentose phosphate pathway.21-24 Consistent with previous results,33 we found that PLK1 inhibition led to the reduction of protein and mRNA levels of LDHA. Thus, PLK1 is probably the mediator between USP1 and LDHA. PLK1 was reported to be associated with poor prognosis in multiple cancers.34 For pediatric ALL, patients with high PLK1 protein phosphorylation have a significantly lower event-free survival rate.35 PLK1 has been considered a potential cancer drug target. Our result showed that the mRNA level of PLK1 was not changed significantly after USP1 knockdown, suggesting that PLK1 may be modulated by USP1 at the posttranslational level. Further results demonstrate that USP1 interacts with and deubiquitinates PLK1, leading to PLK1 stabilization.15 Notably, USP1 expression positively correlated with PLK1 in pediatric primary T-ALL samples, verifying the regulation between USP1 and PLK1. More importantly, the PLK1 inhibitor can counteract the USP1-mediated elevation of proliferation, glycolysis, and LDHA expression. Ectopic expression of LDHA in USP1 knockdown cells can rescue the suppressive effect of USP1 silencing on cell growth and lactate production. Together, these findings suggest that in T-ALL, USP1 overexpression increases proliferation and glycolysis by elevating the expression of PLK1 and LDHA. To our knowledge, this is the first report showing that USP1 is involved in glycolysis through the PLK1/LDHA pathway, which extends our understanding of the role of USP1 in T-ALL. As for the regulation between PLK1 and LDHA, previous studies showed that LDHA could be regulated by numerous transcriptional factors, such as c-Myc, HIF-1, CREB, AP-1, HSF1, FOXM1, and KLF4.20 Interestingly, PLK1 could regulate the expression of c-Myc, HSF1, and FOXM1 by phosphorylation.36-38 Therefore, PLK1 probably promotes the expression of LDHA by phosphorylating the transcriptional factors of LDHA, which then increase the transcription of LDHA. It is interesting that there was a reduction in USP1 after the PLK1 inhibitor. Phosphorylation at serine 313 (S313) was reported to regulate cell cycle–dependent degradation of USP1. Cyclin-dependent kinase 1–mediated phosphorylation of S313 during M phase was shown to prolong the stability of USP1.39 PLK1 is an evolutionary conserved Ser/Thr kinase that is best known for its role in cell cycle regulation.40 In this study, we discovered that PLK1 and USP1 interacted with each other. PLK1 possibly phosphorylates USP1 at S313 and increases the stability of USP1, which may explain the reduction of USP1 after PLK1 inhibitor treatment. The regulation of USP1 by PLK1 needs further validation. ID1 is a known target of USP1.12,13 It was reported that USP1 regulates the ID1/AKT axis.41 We found that after USP1 inhibition, the protein expression levels of p-AKT(473) and ID1 were both decreased, which were consistent with the previous studies (supplemental Figure 3B).
In conclusion, this study demonstrates that USP1 is aberrantly expressed in patients with T-ALL and is required for the T-ALL survival. We uncovered a potentially novel function of USP1 in regulating leukemia cell metabolism. Furthermore, we identified that the USP1/PLK1/LDHA axis significantly participates in the glycolysis and progression of T-ALL. The effective suppression of leukemia progression by USP1 inhibition underscores the need to further explore the therapeutic significance of USP1 targeting in the future.
Acknowledgments
This work was supported by the National Natural Science Foundation of China (81973997, 82070154, 81903645, and 82170157), the National Key Research and Development Program of China (2021YFC2701000), funding for reform and development of Beijing Municipal Health Commission, and Capital Health and Development of Special Grant (2022-1-2091). M.Q. was supported by the Program for Professor of Special Appointment at Shanghai Institutions of Higher Learning and the innovative research team of high-level local university in Shanghai.
Authorship
Contribution: S.L. and M.Q. conceived, designed, and supervised the study; S.L., B.W., and M.Q. wrote the manuscript and analyzed and interpreted the data; B.W., F.Z., H.X., X. Zhai, and H. Zhang helped to design the study; S.L. performed the majority of the experiments; C.G., X. Zhao, Z.Y., L.W., C.Y., and X.W. performed part of the experiments; Y.X., S.X., J.W., Z.C., C.Y., and Y.L. analyzed part of the data; and R.Z. and H. Zheng provided primary T-cell acute lymphoblastic leukemia samples.
Conflict-of-interest disclosure: The authors declare no competing financial interests.
Correspondence: Shuguang Liu, Hematologic Disease Laboratory, Hematology Center, Beijing Key Laboratory of Pediatric Hematology Oncology; National Key Discipline of Pediatrics (Capital Medical University); Key Laboratory of Major Diseases in Children, Ministry of Education; Beijing Pediatric Research Institute, Beijing Children’s Hospital, Capital Medical University, National Center for Children’s Health, Beijing 100045, China; e-mail: shuguangliubch@126.com; and Maoxiang Qian, Institute of Pediatrics and Department of Hematology and Oncology, Children's Hospital of Fudan University, National Children’s Medical Center, and the Shanghai Key Laboratory of Medical Epigenetics, International Co-laboratory of Medical Epigenetics and Metabolism (Ministry of Science and Technology), Institutes of Biomedical Sciences, Fudan University, Shanghai 201102, China; e-mail: mxqian@fudan.edu.cn.

