TO THE EDITOR:
Pancreatic iron deposition is an extremely common finding in thalassemia major (TM), being detected in more than one-third of patients undergoing their first T2∗ magnetic resonance imaging (MRI) scan for this purpose.1 The impairment in insulin secretion, secondary to chronic pancreatic iron overload, is one of the main determinants of altered glucose metabolism in TM.2 A normal global pancreas T2∗ value was demonstrated to have a negative predictive value of 100% for disturbances of glucose metabolism and for cardiac iron, highlighting the importance of routinary pancreatic T2∗ assessment in the management of patients with TM.1,3 However, there is a paucity of data on longitudinal trends in pancreatic iron levels.4
Moreover, although both randomized controlled trials and observational studies have demonstrated that all 3 iron chelators in monotherapy can remove myocardial and liver iron with acceptable safety profiles and with effects dependent on dose and duration of treatment,5-8 the efficacy of the chelators on improving pancreatic iron load has not been assessed.
This multicenter study aimed to prospectively evaluate the changes in pancreatic iron levels in TM, their dependence on total body iron balance, reflected by serum ferritin and hepatic iron levels, and their association with the different iron chelators in monotherapy.
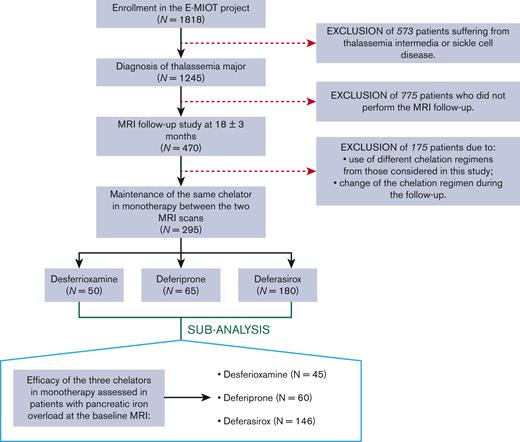
We considered 295 patients with TM (37.12 ± 10.68 years; 150 females) consecutively enrolled in the Extension-Myocardial Iron Overload in Thalassemia network who respected the following criteria: (1) execution of a baseline and a follow-up MRI after 18 ± 3 months, (2) maintenance of deferasirox or deferiprone or desferrioxamine in monotherapy between the 2 MRI scans (Figure 1). We identified 3 groups of patients: 50 treated with desferrioxamine, 65 with deferiprone, and 180 with deferasirox. All chelators were prescribed according to clinical, laboratory, and instrumental data.
Iron overload was quantified at 1.5T by the multi-echo gradient-echo T2∗ technique. Global pancreas T2∗ was obtained by averaging T2∗ values calculated over the pancreatic head, body, and tail.9 Hepatic T2∗ values were converted into MRI liver iron concentration (LIC) values.10,11
An oral glucose tolerance test was performed on all patients not already diagnosed with diabetes and the disorders of glucose metabolism were categorized according to the ICET-A Recommendations.12
The study complied with the Declaration of Helsinki and was approved by the Ethics Committee. All patients gave written informed consent to the protocol.
Table 1 shows the demographic and clinical characteristics of the patients at the baseline MRI.
Baseline demographic, clinical, and MRI data of patients with TM
| Variable . | Value . |
|---|---|
| Age (y) | 37.12 ± 10.68 |
| Females, N (%) | 150 (50.8) |
| Regular transfusion starting age (mo) | 16.86 ± 22.78 |
| Chelation starting age (y) | 4.55 ± 3.65 |
| Splenectomy, N (%) | 172 (58.3) |
| Pre-transfusion hemoglobin (g/dL) | 9.61 ± 0.45 |
| Mean Ferritin (ng/mL) | 780.07 ± 792.04 |
| MRI LIC (mg/g dw) | 5.26 ± 8.05 |
| MRI LIC > 3 mg/g dw, N (%) | 118 (40.0) |
| Global pancreas T2∗ (ms) | 13.47 ± 10.69 |
| Global pancreas T2∗ < 26 ms, N (%) | 251 (85.1%) |
| Glucose metabolism, N (%) | |
| Normal | 186 (63.1) |
| Impaired fasting glucose | 17 (5.8) |
| Impaired glucose tolerance | 40 (13.6) |
| Diabetes mellitus | 52 (17.6) |
ms, milliseconds; N, number.
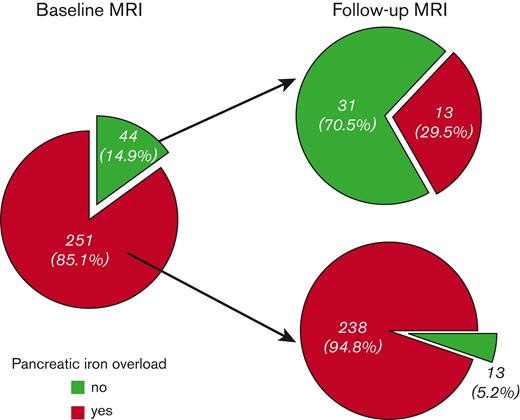
Pancreatic iron overload (global pancreas T2∗ < 26 ms) was detected in 251 patients (85.1%). Of them, only 13 (5.2%) improved at the FU, that is showed no pancreatic iron (Figure 2). These patients, compared with the patients with a pathological pancreas T2∗ at both scans, started with significantly lower MRI LIC values (2.25 ± 1.32 mg/g dry weight (dw) vs 5.94 ± 8.77 mg/g dw; P=.005). Moreover, the 76.9% of patients who improved presented with a normal baseline MRI LIC (< 3 mg/g dw). Out of the 44 patients (14.9%) without baseline pancreatic iron overload, 13 (29.5%) showed pancreatic iron overload at the follow-up MRI. Among these patients, 8 presented with normal MRI LIC values at both scans. No difference in baseline MRI LIC values or changes in MRI LIC values was detected between patients who worsened and who maintained a normal pancreatic T2∗ value.
Changes in pancreatic iron levels at the follow-up MRI according to the baseline status.
Changes in pancreatic iron levels at the follow-up MRI according to the baseline status.
Changes in pancreatic iron levels between the 2 MRI scans were independent of age and gender but were significantly higher in patients with baseline pancreatic iron than in patients without baseline pancreatic iron (1.12 ± 4.78 ms vs −5.20 ± 9.58 ms; P<.0001).
All patients with an altered glucose metabolism at the baseline had a concomitant pancreatic iron overload and experienced higher changes in pancreatic iron levels between the 2 MRIs than patients with a normal oral glucose tolerance test, with a P-value close to the statistical significance (1.06 ± 4.29 ms vs −0.34 ± 6.99 ms; P=.059).
A significant inverse association was detected between changes in global pancreas T2∗ and baseline global pancreas T2∗ values (R = −0.246; P<.0001). Changes in global pancreas T2∗ were not associated with baseline serum ferritin levels or MRI LIC values but were inversely correlated with changes in serum ferritin levels (R = −0.224; P=.001) and changes in MRI LIC values (R = −0.226; P<.0001).
Our data showed that it is difficult to remove the iron from the pancreas, and higher improvements were detected in patients who were more heavily loaded at the pancreatic level. Although the changes in pancreatic iron levels were independent of baseline MRI LIC values, three-quarters of patients who switched from a pathological to a normal pancreatic T2∗ value, showed no hepatic iron overload at the baseline MRI. Moreover, there was an association between changes in iron levels in the 2 organs. These findings suggest that the achievement of normal hepatic iron levels can be crucial for the removal of stored pancreatic iron. On the other hand, low LIC seemed to not necessarily imply a low risk for pancreatic iron, and the LIC was not useful in the discrimination between patients able to maintain safe iron levels in the pancreas and patients who develop pancreatic iron, further confirming as mandatory quantifying the iron status in the different organs along time.13
Apart from the differences in transfusional iron uptake, the relationship between hepatic and pancreatic iron can be influenced by the chelation regimens used, which can have different efficacy on different organs.5,8,14 The present real-life study evaluated the efficacy of the 3 chelators in monotherapy in terms of removal of pancreatic iron overload. In patients with TM with no pancreatic iron overload at the baseline, the 3 iron chelators showed comparable efficacy in maintaining at the follow-up a normal global pancreas T2∗ value (desferrioxamine: 60.0%, deferiprone: 60.0%, and deferasirox: 73.5%; P=.712).
To better identify the outcomes of each chelator, we performed a cluster analysis based on baseline pancreatic iron burden. Patients with baseline global pancreas T2∗ < 26 ms were distributed as follows: 45 in the desferrioxamine group, 60 in the deferiprone group, and 146 in the deferasirox group. The mean administered dosages of the chelators were as follows: (1) desferrioxamine 33.33 ± 9.92 mg/kg body weight per day with a frequency of 5.67 ± 0.50 days/week; (2) deferiprone 80.60 ± 14.66 mg/kg body weight per day; (3) deferasirox 25.05 ± 5.29 mg/kg body weight per day if in dispersible tablets and 20.87 ± 6.52 mg/kg body weight per day if in film-coated tablets. The mean duration of treatment was 106.21 ± 150.82 months for desferrioxamine, 58.03 ± 72.13 months for deferiprone, and 44.62 ± 41.46 months for deferasirox (P=.324). The percentage of patients with excellent/good levels of compliance to the active chelation treatment was comparable among the 3 groups (desferrioxamine: 95.6%, deferiprone: 98.3%, and deferasirox: 97.9%; P=.604). Good compliance is a key to successful therapy and our finding probably reflects the high level of awareness on the significance of chelation therapy and the complications associated with nonadherence, and the support of the family and of the voluntary associations.
Baseline mean serum ferritin levels were 580.53 ± 675.66 ng/mL in the desferrioxamine group, 706.41 ± 475.05 ng/mL in the deferiprone group, and 919.39 ± 947.53 ng/mL in the deferasirox group, with a significant difference between desferrioxamine and deferasirox groups (P<.0001). Baseline MRI LIC values were significantly lower in the desferrioxamine group than in the deferiprone group (3.45 ± 5.49 mg/g dw vs 4.97 ± 5.28 mg/g dw; P<.0001) and the deferasirox group (3.45 ± 5.49 mg/g dw vs 6.78 ± 10.17 mg/g dw; P=.006). Baseline global pancreas T2∗ values were 7.29 ± 3.02 ms in the desferrioxamine group, 9.92 ± 5.96 ms in the deferiprone group, and 10.39 ± 6.16 ms in the deferasirox group, with a significant difference between desferrioxamine and deferasirox groups (P=.006).
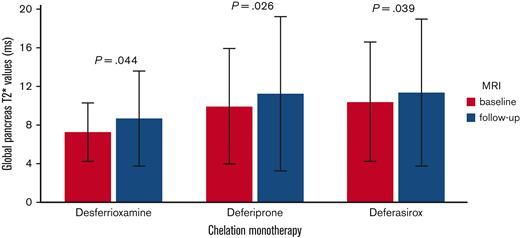
Global pancreatic T2∗ values significantly increased in the desferrioxamine group (mean difference: 1.38 ± 4.36 ms; P=.044), the deferiprone group (mean difference: 1.31 ± 4.54 ms; P=.026), and the deferasirox group (mean difference: 0.96 ± 5.05 ms; P=.039) (Figure 3). To the best of our knowledge, this is the first study demonstrating that, at the intra-treatment analysis, in patients with baseline pancreatic iron overload, all 3 chelators were able to significantly lower the global pancreatic iron.
Intratreatment comparison between final and basal global pancreas T2∗ values in patients with baseline global pancreas T2∗ value < 26 ms.
Intratreatment comparison between final and basal global pancreas T2∗ values in patients with baseline global pancreas T2∗ value < 26 ms.
The improvement in global pancreas T2∗ values was comparable among the 3 groups (P=.822) and remained not significantly different also adjusting for baseline global pancreas T2∗ values (P=.868). No adjustment for baseline serum ferritin and MRI LIC values was performed because they were not significantly associated to the dependent variable.
There was no difference among the 3 groups in the frequency of patients who switched from a pathological to a normal global pancreas T2∗ (desferrioxamine: 2.2%, deferiprone: 6.7%, deferasirox: 5.5%; P=.577).
In conclusion, the 3 iron chelators in monotherapy were equivalent in the reduction of pancreatic iron, that seems to be a slow and difficult process. Further randomized controlled trials are needed to confirm our observations and to explore the effect of different iron chelation regimens.
Acknowledgments: The authors thank all of the colleagues involved in the E-MIOT project (https://emiot.ftgm.it/) and all of the patients for their cooperation. The E-MIOT project receives nonprofit support from industrial sponsorships (Chiesi Farmaceutici S.p.A. and Bayer). The funders had no role in study design, data collection and analysis, decision to publish, or preparation of the manuscript.
Contribution: A.M. designed the study, analyzed the data, and drafted the initial manuscript; L.P. was responsible for data collection; P.R., M.A., R. Rosso, L.C., T.C., V.C., M.S., V.R., R. Righi, S.R., and A.V. collected the data; V.P. developed the software for image analysis and assisted with the methods; F.C. supervised the study and is the guarantor of this work; and all authors assisted with interpretation, commented on drafts of the manuscript, and approved the final version.
Conflict-of-interest disclosure: The authors declare no competing financial interests.
Correspondence: Filippo Cademartiri, Department of Radiology, Fondazione G. Monasterio CNR-Regione Toscana, Via Moruzzi, 1 - 56124 Pisa, Italy; e-mail: fcademartiri@ftgm.it.
References
Author notes
Data are available on request from the corresponding author, Filippo Cademartiri (fcademartiri@ftgm.it).


