

Key Points
This is the largest study to publish outcomes on an older PTCL cohort.
Higher CCI score correlates with worse OS in PTCL.

Abstract
Peripheral T-cell lymphoma (PTCL) is a heterogeneous group of aggressive neoplasms with poor outcomes, commonly affecting older patients with comorbidities. This study aims to describe outcomes of older patients with PTCL in a large international cohort. Patients aged ≥70 years with PTCL diagnosed from 1 January 2010 to 31 December 2015 in the Swedish Lymphoma Registry (SLR) and California Cancer Registry (CCR) were identified. Data on comorbidity were retrospectively collected according to the Charlson Comorbidity Index (CCI), and clinical outcomes were extracted. A total of 891 patients were included (SLR, n = 173; CCR, n = 718). Median age was 77 (SLR) and 78 (CCR) years. Included subtypes were as follows: angioimmunoblastic T-cell lymphoma, n = 226; anaplastic large-cell lymphoma, n = 122; enteropathy-associated T-cell lymphoma (EATL), n = 31; hepatosplenic TCL, n = 7; natural killer–/T-cell lymphoma, n = 62; PTCL not otherwise specified, n = 443. CCI data were available in 775 patients (87%), and CCI scores were divided into the groups CCI = 0 (39%), CCI = 1 (22%), and CCI > 1 (39%). Median age did not differ among the CCI groups (P = .72). Patients with a CCI > 1 had a worse median overall survival (4.4 months) compared with patients with CCI = 0 (11.9 months) and CCI = 1 (8.4 months; P < .001). Comorbidity and advancing age in as little as 5-year increments are important adverse factors in this group. Most patients died of lymphoma within a year from diagnosis, underscoring the importance of developing new treatments.
Introduction
Peripheral T-cell lymphoma (PTCL) is a heterogeneous group of uncommon lymphoid neoplasms, accounting for approximately 7% of all non-Hodgkin lymphomas.1 Nineteen unique entities are encompassed within the PTCL group, and the most common subtypes included in the World Health Organization 2016 classification system include PTCL, not otherwise specified (NOS), angioimmunoblastic T-cell lymphoma (AITL), anaplastic large-cell lymphoma (ALCL), anaplastic lymphoma kinase (ALK)+ and ALCL ALK−.2 There is marked global variation among different PTCL subtypes, with PTCL, NOS representing the most common subtype in North America (34.4%) and Europe (34.3%).1
PTCL commonly presents as a clinically aggressive neoplasm with suboptimal response to therapy and poor outcome.1,3 Initial treatment of PTCL includes combination chemotherapy largely extrapolated from that of aggressive B-cell lymphoma, including cyclophosphamide, doxorubicin, vincristine, and prednisone (CHOP), sometimes with the addition of etoposide, and consolidation with autologous stem cell transplantation for young fit patients. This approach results in a 5-year overall survival (OS) and progression-free survival (PFS) of approximately 30% to 40% and 20% to 30%, respectively.1,4 For patients ineligible for combination chemotherapy, palliative therapeutic options in the absence of a clinical trial include histone deacetylase inhibitors (HDACi) and pralatrexate (both approved in the United States), brentuximab vedotin (BV), which is a CD30-directed antibody drug conjugate for CD30+ disease, single-agent chemotherapy,5 lenalidomide,6 or radiation.7
With the exception of ALCL ALK+, PTCL is primarily a disease of older adults, who may tolerate combination chemotherapy poorly.8 Median age at diagnosis for most patients with PTCL is in the sixth decade of life, with AITL representing the most advanced age patients.9 Multiple studies suggest comorbidity, rather than chronological age alone, is associated with outcomes in patients with cancer.10 A widely applied validated measure of comorbidity is the Charlson Comorbidity Index (CCI) that incorporates 19 weighted medical conditions.11 The impact of CCI on prognosis is well described in B-cell lymphoma10 but is less studied in TCL, particularly in the older population. Four retrospective studies have evaluated the prognostic impact of the CCI in patients with PTCL, with most studies being single center in design and including a small number of patients across a broad age range. Three of the 4 studies report outcomes for older patients with PTCL: the South Korean (Hematology Association of South East Korea (HASEK) study12 that defined older as age > 60, a study by Wang et al13 that did not specify an age cutoff to define older patients, and a subset analysis of a larger cohort from the Swedish Lymphoma Registry (SLR)14 of patients ≥75 years; findings from these studies have been inconsistent. In the HASEK study, a CCI of ≥3 was associated with inferior OS in univariate and multivariate analysis, whereas Wang et al showed that CCI was a prognostic indicator affecting PFS and OS in univariate but not multivariate analysis. In contrast to these findings, the subset analysis from the SLR suggests that CCI may not have as great an impact in patients over the age of 75. There are limited additional data regarding the prognostic impact of CCI in the older population, and additional study is warranted.
This study aims to describe clinical characteristics and outcomes of a large international cohort of older (age ≥ 70) patients with PTCL and the impact of comorbidity as measured by the CCI on OS using a geographically diverse dataset by combining data from the California Cancer Registry (CCR) and the SLR.
Patients and methods
Study population
Patients aged ≥70 years with PTCL diagnosed from 1 January 2010 through 31 December 2015 in the SLR and CCR were identified. The SLR covers approximately 95% of all adult lymphoma patients in Sweden,15 and the CCR includes information on all cancers diagnosed in California (www.ccrcal.org). The diagnosis of PTCL in the SLR was established in routine clinical care with contributions from 21 pathology centers, whereas the diagnosis of PTCL in the CCR was established by routine clinical care and reported through hospital abstracting services. Patients meeting criteria for precursor T-cell malignancies, primary cutaneous lymphomas, and leukemic subtypes were excluded. Descriptive epidemiologic and clinical data and clinical outcomes of the study cohort were extracted. This study was approved by the University of California, Los Angeles Institutional Board Review and conducted in accordance with the Declaration of Helsinki.
Statistical analysis
Patient characteristics, lymphoma-related variables, and outcomes of interest were summarized using descriptive statistics such as frequency and percentage and compared between groups by χ2 test or Fisher’s exact test for categorical variables. Mean, median, standard deviation, minimum, maximum, and interquartile range were reported and compared between groups by 1-way analysis of variance test for quantitative variables. Outcomes of interest included OS from any cause, defined as time from diagnosis to death or latest follow-up, and cause of death. Kaplan-Meier estimates of OS stratified by groups were calculated and presented in figures. Median OS was reported, together with their corresponding 95% confidence interval (CIs). Comparisons between groups for OS were done by log-rank test. Univariate and multiple Cox proportional hazard models were used to obtain hazards ratio (HR) estimates and 95% CIs for risk factors of interest. For all statistical investigations, tests for significance were 2-tailed. P < .05 was considered statistically significant. Statistical analyses were carried out using statistical software SAS version 9.4 (SAS Institute Inc. 2013) and IBM SPSS statistics version 25. X.W. and H.C. analyzed the data, and all study authors had equal access to the primary data.
Results
Patient characteristics
A total of 891 patients were included (SLR, n = 173; CCR, n = 718). Median age was 77 (SLR) and 78 (CCR) years, respectively. Patients in the CCR were more likely to be aged >80 years (P = .005; Table 1). Included subtypes were as follows: AITL, n = 226; ALCL, n = 122; EATL, n = 31; hepatosplenic TCL, n = 7; natural killer (NK)-/T-cell lymphoma, n = 62; PTCL, NOS, n = 443 (Table 1). AITL was more common in the CCR (27% vs 20%; P < .001). Otherwise, no major differences in subtypes were seen between the CCR and the SLR (Table 1). CCI data were available in 775 patients (87%), and CCI scores were divided into groups: CCI = 0 (39%), CCI = 1 (22%), and CCI > 1 (39%). No differences were seen in median age between the CCI groups (P = .72). Male patients had a trend toward higher CCI score (P = .061), but no significant baseline differences were seen between the 3 CCI groups (Table 2). Cause of death was known in 95% of the patients. Lymphoma was the most common cause of death, with >70% of deaths related to lymphoma, irrespective of CCI score (Table 3).
Characteristics of 891 PTCL ≥ 70 years with PTCL according to location
| Variable | CCR(N = 718) | SLR(N = 173) | P |
|---|---|---|---|
| Sex | |||
| Male | 383 (53.3) | 101 (58.4) | .236 |
| Female | 335 (46.7) | 72 (41.6) | |
| Age > 80 y | |||
| No | 439 (61.1) | 126 (72.8) | .005 |
| Yes | 279 (38.9) | 47 (27.2) | |
| Age, y | |||
| 70-74 | 207 (28.8) | 59 (34.1) | .231 |
| 75-84 | 360 (50.1) | 86 (49.7) | |
| >84 | 151 (21.0) | 28 (16.2) | |
| Ann Arbor stage | |||
| I-II | 238 (36.2) | 42 (27.1) | .038 |
| III-IV | 420 (63.8) | 113 (72.9) | |
| Treatment | |||
| No | 333 (47.3) | 51 (29.8) | <.0001 |
| Yes | 371 (52.7) | 120 (70.2) | |
| Subtype | |||
| AITL | 192 (26.7) | 34 (19.7) | <.0001 |
| ALCL | 95 (13.2) | 27 (15.6) | |
| EATL | 15 (2.1) | 16 (9.2) | |
| Hepatosplenic TCL | 4 (0.6) | 3 (1.7) | |
| NK/TCL, nasal type | 55 (7.7) | 7 (4.0) | |
| PTCL, NOS | 357 (49.7) | 86 (49.7) | |
| CCI | |||
| 0 | 239 (38.9) | 65 (40.6) | .414 |
| 1 | 128 (20.8) | 39 (24.4) | |
| >1 | 248 (40.3) | 56 (35.0) |
Data are presented as no. (%) unless indicated otherwise.
ENKT CL, extranodal natural killer/T-cell lymphoma.
Characteristics of 775 patients ≥70 years with PTCL according to CCI
| Characteristic | CCI = 0 (N = 304) | CCI = 1 (N = 167) | CCI > 1 (N = 304) | P |
|---|---|---|---|---|
| Sex | ||||
| Male | 150 (49.3) | 91 (54.2) | 179 (58.7) | .061 |
| Female | 154 (50.7) | 76 (45.5) | 125 (41.1) | |
| Age, y, median (range) | 78 (70-102) | 78 (70-94) | 78 (70-95) | .723 |
| Age > 80 y* | ||||
| Yes | 114 (40.4) | 57 (20.2) | 111 (39.4) | .767 |
| No | 190 (38.5) | 110 (22.3) | 193 (39.1) | |
| Age groups* | ||||
| 70-74 | 87 (38.3) | 52 (22.9) | 88 (38.8) | .918 |
| 75-84 | 153 (39.6) | 84 (21.8) | 149 (38.6) | |
| >84 | 64 (39.3) | 31 (19.0) | 68 (41.7) | |
| Ann Arbor stage | ||||
| I-II | 98 (34.5) | 43 (27.4) | 93 (33.2) | .293 |
| III-IV | 186 (65.5) | 114 (72.6) | 187 (66.8) | |
| Treatment | ||||
| Yes | 176 (58.9) | 102 (61.4) | 168 (56.4) | .559 |
| No | 123 (41.1) | 64 (38.6) | 130 (43.6) | |
| Histologic subtypes | ||||
| AITL | 91 (29.9) | 42 (25.1) | 73 (24.0) | .563 |
| ALCL | 36 (11.8) | 27 (16.2) | 42 (13.8) | |
| EATL | 14 (4.6) | 4 (2.4) | 7 (2.3) | |
| Hepatosplenic | 3 (1.0) | 1 (0.6) | 2 (0.7) | |
| NK/T cell | 22 (7.2) | 11 (6.6) | 20 (6.6) | |
| PTCL, NOS | 138 (45.4) | 82 (49.1) | 160 (52.6) |
Data are presented as no. (%) unless indicated otherwise.
Percentage counted for each row.
Cause of death in patients ≥70 years with PTCL according to CCI score
| CCI = 0 (N = 304) | CCI = 1 (N = 167) | CCI > 1 (N = 304) | P | |
|---|---|---|---|---|
| Patients | 230 (75.7) | 146 (87.4) | 259 (85.2) | .489 |
| Cause of death | ||||
| Lymphoma | 174 (75.7) | 105 (71.9) | 182 (70.3) | |
| Cardiovascular | 7 (3.0) | 9 (6.2) | 21 (8.1) | |
| Infection | 10 (4.3) | 6 (4.1) | 14 (5.4) | |
| Other malignancy | 20 (8.7) | 15 (10.3) | 14 (5.4) | |
| Renal failure | 2 (0.9) | 1 (0.7) | 3 (1.2) | |
| Hepatic dysfunction | 0 (0) | 0 (0) | 2 (0.8) | |
| Other | 6 (2.6) | 4 (2.7) | 8 (3.1) | |
| Unknown | 11 (4.8) | 6 (4.1) | 15 (5.8) |
Data are presented as no. (%) unless indicated otherwise.
Treatment
Treatment data were available in 875 patients (98%), and treatment was divided into the following groups; multiagent treatment (n = 416, 47%), single agent treatment (n = 52, 5.8%), and chemotherapy NOS (n = 23, 2.6%). 384 patients (43%) received no treatment. Patients in the SLR more often received treatment compared with patients in the CCR (70% vs 53%; P < .001; Table 1). No significant differences in the number of patients receiving multiagent treatment were seen among patients with CCI = 0 (59%), CCI = 1 (61%), and CCI > 1 (56%) (P = .56; Table 2).
Prognostic factors and outcome
Median OS for all patients was 9 months. Median follow-up time for surviving patients was 47 months. Patients with a CCI > 1 had a statistically significant worse OS compared with patients with a CCI = 1 and CCI = 0 (4.4 vs 8.4 and 11.9 months, respectively; P < .001; Figure 1). In univariate analysis, age, advanced Ann Arbor stage (III-IV), CCI, TCL subtype, and not receiving frontline treatment were significant prognostic factors for worse OS (Table 4). Eastern Cooperative Oncology Group (ECOG) performance status was not available. By multivariate analysis, age, advanced Ann Arbor stage (III-IV), CCI > 1, TCL subtype, and not receiving frontline treatment were independently prognostic for OS. No difference in prognostic impact on survival was seen between men and women or between SLR and CCR (Table 4). The impact of age on outcome was further assessed by grouping the cohort into 5-year increments of increasing age (70-74, 75-79, 80-84, 85-89, and 90+ years). Kaplan-Meier analysis of these subgroups identified 3 age groups with different median OS (70-74, 15.5 months; 75-84, 9.9 months; >84, 3.6 months; P < .001; Figure 2). These 3 age groups were used in further regression analyses. Multivariate analyses with the binary variable age >80 instead of these 3 age groups were also done, and no significant differences in other prognostic factors were seen with respect to which age factor was used in the analyses.
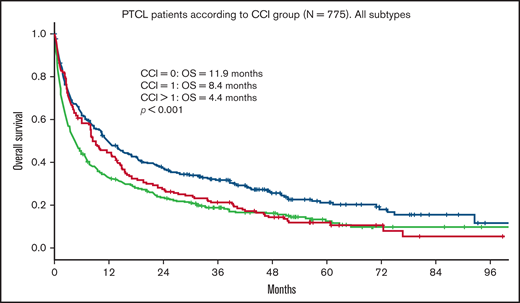
OS in PTCL according to CCI group. OS of 775 patients ≥70 years with PTCL according to CCI group. CCI = 0, n = 304; CCI = 1, n = 167; CCI > 1, n = 304.
OS in PTCL according to CCI group. OS of 775 patients ≥70 years with PTCL according to CCI group. CCI = 0, n = 304; CCI = 1, n = 167; CCI > 1, n = 304.
Univariate and multivariable analysis of factors for OS in patients ≥70 years with PTCL
| Univariate | Multivariate | |||
|---|---|---|---|---|
| Variable | HR (95% CI) | P | HR (95% CI) | P |
| Age groups (70-74, 75-84, 85+) | 1.42 (1.28, 1.59) | <.001 | 1.42 (1.26, 1.60) | <.001 |
| 75-84 vs 70-74 | 1.29 (1.08, 1.55) | .005 | 1.32 (1.09, 1.61) | .005 |
| 85+ vs 70-74 | 1.43 (1.29, 1.59) | <.001 | 1.41 (1.25, 1.58) | <.001 |
| Ann Arbor stage III-IV (vs I-II) | 1.58 (1.33, 1.87) | <.001 | 1.61 (1.34, 1.94) | <.001 |
| CCI | 1.23 (1.12, 1.34) | <.001 | 1.19 (1.08, 1.30) | <.001 |
| CCI = 1 vs CCI = 0 | 1.30 (1.05, 1.60) | .014 | 1.14 (0.92, 1.41) | .247 |
| CCI > 1 vs CCI = 0 | 1.49 (1.25, 1.79) | <.001 | 1.39 (1.15, 1.68) | .001 |
| Subtypes of TCL | .038 | .001 | ||
| ALCL vs AITL | 1.11 (0.86, 1.44) | .418 | 1.85 (1.35, 2.53) | <.001 |
| EATL vs AITL | 1.45 (0.96, 2.20) | .077 | 2.20 (1.23, 3.94) | .008 |
| PTCL, NOS vs AITL | 1.31 (1.09, 1.57) | .004 | 1.52 (1.24, 1.86) | <.001 |
| ENKTCL vs AITL | 0.88 (0.63, 1.25) | .481 | 1.52 (0.93, 2.47) | .095 |
| ENKTCL vs ALCL | 0.80 (0.55, 1.17) | .247 | 0.91 (0.58, 1.42) | .672 |
| ENKTCL vs EATL | 0.60 (0.37, 0.99) | .045 | 0.41 (0.21, 0.81) | .011 |
| ENKTCL vs PTCL, NOS | 0.68 (0.49, 0.95) | 0.023 | 0.74 (0.50, 1.10) | .134 |
| EATL vs ALCL | 1.28 (0.82, 1.98) | 0.276 | 1.44 (0.82, 2.53) | .201 |
| PTCL, NOS vs ALCL | 1.16 (0.92, 1.46) | 0.225 | 1.00 (0.77, 1.30) | .978 |
| PTCL, NOS vs EATL | 0.90 (0.60, 1.34) | 0.590 | 0.71 (0.43, 1.16) | .168 |
| Treatment (yes vs no) | 0.65 (0.56, 0.75) | <0.001 | 0.58 (0.48, 0.70) | <.001 |
| Multiagent (yes vs no) | 0.69 (0.60, 0.81) | <0.001 | 0.70 (0.58, 0.83) | <.001 |
| Sex: male vs female | 0.99 (0.86, 1.15) | 0.932 | 0.97 (0.82, 1.14) | .702 |
| CCR vs SLR | 1.04 (0.86, 1.25) | 0.702 | 1.18 (0.96, 1.45) | .123 |

OS in patients with PTCL according to age. OS in 891 patients ≥70 years with PTCL according to (A) 5-year age groups (70-74, n = 265; 75-79, n = 257; 80-84, n = 190; 85-89, n = 128; >89, n = 52) and (B) 3 different age groups (70-74, n = 265; 75-84, n = 447; >84, n = 180).
OS in patients with PTCL according to age. OS in 891 patients ≥70 years with PTCL according to (A) 5-year age groups (70-74, n = 265; 75-79, n = 257; 80-84, n = 190; 85-89, n = 128; >89, n = 52) and (B) 3 different age groups (70-74, n = 265; 75-84, n = 447; >84, n = 180).
Of the 3 nodal PTCL subtypes, patients with AITL had a significantly better outcome (median OS = 15.1 months) compared with ALCL (OS = 6.8 months) and PTCL, NOS (OS = 7.9 months; P = .01; Figure 3).
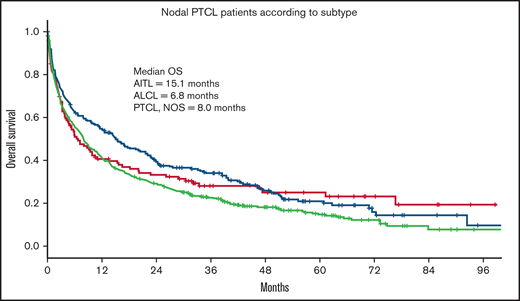
OS in nodal PTCL according to histologic subtype. OS of 787 patients ≥70 years with PTCL according to histologic subtype. AITL, n = 226; ALCL, n = 121; PTCL, NOS, n = 440.
OS in nodal PTCL according to histologic subtype. OS of 787 patients ≥70 years with PTCL according to histologic subtype. AITL, n = 226; ALCL, n = 121; PTCL, NOS, n = 440.
Within the population receiving multiagent treatment, OS was inferior for patients with CCI = 1 (HR = 1.35) or CCI > 1 (HR = 1.39) compared with patients with CCI = 0 in univariate analysis (Table 5; Figure 4), but no significant differences were seen between CCI groups in multivariate analysis after adjusting for age, Ann Arbor stage, TCL subtypes, sex, and location.
Univariate and multivariable analysis of factors for OS in 400 PTCL ≥70 years with PTCL receiving multiagent treatment
| Univariate | Multivariate | |||
|---|---|---|---|---|
| Characteristic | HR (95% CI) | P | HR (95% CI) | P |
| Age groups (70-74, 75-84, 85+) | 1.23 (1.02, 1.47) | .027 | 1.27 (1.06, 1.53) | .011 |
| 75-84 vs 70-74 | 1.27 (1.00, 1.61) | .049 | 1.38 (1.08, 1.77) | .011 |
| 85+ vs 70-74 | 1.20 (0.97, 1.49) | .095 | 1.21 (0.96, 1.52) | .103 |
| Ann Arbor stage III-IV (vs I-II) | 1.51 (1.15, 1.99) | .003 | 1.69 (1.26, 2.27) | <.001 |
| 1.12 (0.98, 1.29) | .093 | |||
| CCI = 1 vs CCI = 0 | 1.35 (1.00, 1.82) | .050 | 1.11 (0.82, 1.51) | .500 |
| CCI > 1 vs CCI = 0 | 1.39 (1.06, 1.81) | .016 | 1.25 (0.95, 1.64) | .109 |
| Subtypes of TCL | ||||
| ALCL vs AITL | 1.08 (0.74, 1.59) | .679 | 1.97 (1.24, 3.15) | .004 |
| EATL vs AITL | 1.26 (0.64, 2.51) | .507 | 1.36 (0.62, 2.97) | .448 |
| PTCL, NOS vs AITL | 1.56 (1.21, 2.02) | .001 | 1.87 (1.41, 2.48) | <.0001 |
| EATL vs ALCL | 1.16 (0.56, 2.41) | .688 | 1.01 (0.45, 2.24) | .984 |
| PTCL, NOS vs ALCL | 1.41 (0.99, 2.02) | .058 | 1.05 (0.72, 1.54) | .804 |
| PTCL, NOS vs EATL | 1.20 (0.61, 2.36) | .592 | 1.00 (0.50, 2.00) | .988 |
| Sex: male vs female | 1.14 (0.91, 1.43) | .266 | 1.02 (0.80, 1.29) | .905 |
| Location: California vs Sweden | 0.86 (0.67, 1.10) | .238 | 0.93 (0.72, 1.20) | .568 |
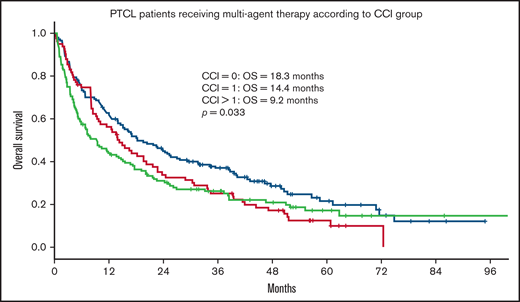
OS for patients with PTCL receiving multiagent treatment, according to CCI group. OS according to CCI group in 369 patients ≥70 years with PTCL receiving multiagent treatment. CCI = 0, n = 150; CCI = 1, n = 83; CCI > 1, n = 136. extranodal natural killer/T-cell lymphoma patients excluded.
OS for patients with PTCL receiving multiagent treatment, according to CCI group. OS according to CCI group in 369 patients ≥70 years with PTCL receiving multiagent treatment. CCI = 0, n = 150; CCI = 1, n = 83; CCI > 1, n = 136. extranodal natural killer/T-cell lymphoma patients excluded.
Response assessment to frontline chemotherapy was available for 87 patients (multiagent chemotherapy, n = 79; single-agent chemotherapy, n = 3; unknown chemotherapy, n = 2; missing treatment data, n = 3) in the SLR and no patients in the CCR. This cohort had an overall response rate (ORR) of 55% (complete response [CR]+ complete response, unconfirmed [CRu] = 38, 43.7%; partial response [PR] = 10, 11.5%). Patients achieving CR/CRu had significantly improved OS compared with patients that did not achieve a CR/CRu (3.7 vs 0.56 years, respectively; P < .001). Comparing Swedish patients receiving no treatment (n = 40) with patients treated with chemotherapy and not achieving a CR/CRu (n = 48), no significant differences in survival were seen in univariate (HR = 1.05, P = .85) or multivariate analysis adjusting for diagnosis, age, stage, CCI, and ECOG performance status (HR = 1.03, P = .93).
Discussion
At the time of submission, this study represents the largest international cohort of older patients with PTCL and substantially adds to the knowledge of outcome in older patients with PTCL and the impact of comorbidity. The present study is the first international study focused on an older cohort and included more than 800 patients diagnosed in Sweden and throughout California. Consistent with younger international patient series,1 the most common subtypes were PTCL, NOS; AITL; and ALCL. Compared with the SLR, there was a higher incidence of AITL in the CCR. The larger population of Asians/Pacific Islanders and Hispanics in California, who have been reported to have a higher incidence of AITL compared with Whites,9 may explain this, but the lack of central pathology review may also contribute to this finding. The overall prognosis was poor, and comorbidity seemed to further worsen survival. Multivariable analysis confirmed the previously described prognostic impact of advanced Ann Arbor stage4,14 and age >8012 but failed to demonstrate a superior survival among female patients.4,16 Although OS was statistically better for CCI = 0, prognosis was still poor with a median OS <1 year. These findings are consistent with a smaller patient series that included 46 older (no age definition of older) patients with PTCL,13 confirming that disease-related factors play an important role in prognosis. Similarly, the HASEK group12 and Zhao et al17 described an adverse impact of higher CCI group on outcome in older patients with PTCL. The HASEK group reported a series of 81 patients with PTCL >60 years, with a median age of 71. CCI > 2 and age > 80 years were associated with worse OS in multivariate analysis. Additionally, Zhao et al reported a study with 56 patients > 60 years, of which 18 patients were older than 70.17 In this series, CCI score > 1 was associated with worse OS in univariate and multivariate analysis; however, no adjustment was made for age in the multivariate analysis, and median age was only 67 compared with 78 in our study. In contrast, a previous Swedish study by Ellin et al14 on patients with PTCL diagnosed in 2000 to 2009 found no association between CCI score and survival among 214 (28% of the entire cohort) patients aged 75 years or older. This study showed no significant decrease in survival in the CCI > 1 compared with CCI = 0 groups (HR = 1.6; P = .3); the lack of a statistically significant prognostic impact of CCI group might partly be explained by the poor survival for patients with PTCL in this age group in general, and the authors also commented on the limitation in number of patients.
In the present study, CCI was associated with outcome, and in univariate analysis, presence of any CCI comorbidity showed impaired OS, although in multivariable analysis only CCI > 1 compared with CCI = 0 retained statistical significance. Earlier studies in PTCL14 and aggressive B-cell lymphoma10 have shown comorbidity to be associated with lower response rates to anthracycline-based treatment in younger patients. In our study, treatment with multiagent therapy is associated with better prognosis, irrespective of CCI group (HR = 0.70; P < .001). In contrast to younger patient series, patients with AITL had better survival than patients with PTCL, NOS and ALCL. The lack of central pathology review makes this finding difficult to interpret, but it is of interest that several previous studies have failed to find an association between age and survival in AITL, underscoring the unique biology and clinical behavior of this lymphoma.14,18-20 It is possible that this finding is influenced by the use of novel targeted therapies that may have preferential activity in AITL and are reasonably tolerated in older patients. Treatment with HDACi in the relapsed/refractory PTCL setting has shown preferential activity in AITL, including belinostat21 and romidepsin.22
No differences in outcome were seen for ALCL compared with PTCL, NOS. BV, an effective targeted therapy with a manageable toxicity profile for older patients with ALCL that has been available in the United States since 2011 may be expected to result in improved outcome for patients with ALCL; however, our dataset provided no information on the actual use of this treatment in the present cohort.23,24
Advancing age in 5-year increments had a detrimental effect on OS within this older population, with the youngest age group (70-74 years) having the most favorable OS (median, 15.5 months; 95% CI, 10.5-20.4) compared with the more advanced age group (85-89 years) with a median OS of just 2.9 months (95% CI, 1.9-3.9). These findings highlight that the older population is not a monolithic cohort and suggest that advancing age in increments as little as 5 years can further adversely affect outcome and inform prognosis. Older patients may be particularly vulnerable to minimal further advancement of age compared with younger patients because of worsening comorbidities, progressive polypharmacy, frailty, and dynamic changes in their psychosocial standing and support system. Patients with very advanced age should undergo careful risk assessment before treatment.
It is notable that only 59% of patients in this older cohort received any form of frontline therapy, and patients in the CCR cohort were less likely to receive treatment compared with the SLR cohort. The CCI group distribution among CCI = 0, 1, and >1 was 39%, 22%, and 39%, respectively, and the CCI score distribution was similar in CCR compared with SLR. These findings suggest factors outside the clinical features captured by the CCI impacted treatment decisions. The increased likelihood of receiving multiagent chemotherapy in the SLR compared with the CCR may be explained by the different age distribution between the 2 cohorts, with patients in the CCR cohort being older, but OS did not differ between the CCR and SLR despite these differences.
A major limitation of the present study is the lack of information on ECOG/World Health Organization performance status that alone is often an important factor in treatment decisions and substantially limits the ability to draw conclusions from treatment differences and outcome. Furthermore, the retrospective nature of the present study limits the analysis of additional factors with possible importance in the complex nature of balancing socioeconomic factors with pursuing potentially toxic treatment in very older patients. Different support systems, transportation abilities, medical literacy, and resources may all influence treatment decisions. Older patients, more likely to experience treatment-related toxicities, with higher risk disease and therefore a lower likelihood of treatment benefit, may not opt to pursue lymphoma-directed therapy.
Although CCI score was associated with OS in the entire cohort, this was not true for patients receiving multiagent treatment. In multivariate analysis including only patients that received multiagent treatment, no significant decrease in survival was seen for patients with CCI > 1 (HR = 1.25; P = .11). The lack of statistical significance in this subgroup can be because of the limited number of patients but possibly also related to a de-selection of specific comorbidities, such as heart disease, in this group. Detailed data on the specific CCI components were unfortunately lacking.
Although there are many limitations precluding firm conclusions on the impact of treatment in the current study, it is of interest that those patients responding with CR/CRu to treatment had improved survival. Additionally, no difference in survival was seen between untreated patients and patients receiving chemotherapy but not responding with CR/CRu. Therefore, it seems that selected older patients can benefit from multiagent chemotherapy and that patients treated with chemotherapy but not responding with CR/CRu did not do worse than patients not receiving any treatment. A more detailed subgroup analysis of patients receiving single agent therapy and chemotherapy, NOS was not performed because of small patient numbers, limiting any potential conclusions.
Despite better OS in patients with CCI = 0, prognosis remained poor, with a median OS of <1 year, highlighting the importance of ongoing development of novel therapies. In November 2018, the US Food and Drug Administration approved BV combined with cyclophosphamide, doxorubicin, and prednisone (CHP) for CD30+ PTCL. This approval was based on outcomes of the ECHELON-2 randomized phase 3 clinical trial that evaluated CHP combined with either vincristine (CHOP) or BV (BV-CHP) and showed a statistically significant improvement in PFS (48.2 vs 20.8 months; 95% CI, 35.2-not estimable) and OS (HR = 0.66; 95% CI, 0.46-0.95; P = .024), respectively, with BV-CHP.24 This study did not define an upper age limit for enrollment and included patients up to 85 years old. Additionally, 4 recently approved compounds used as single agents, pralatrexate (2009, 27% ORR), a novel antifolate agent; romidepsin (2011, ORR 25%) and belinostat (2014, ORR 25%), both HDAC inhibitors; and BV (2011 for relapsed/refractory CD30+ ALCL), are changing the landscape of PTCL treatment. There are results supporting the use of these treatments in a broader age range of patients with relapsed/refractory disease, where the use of novel agents has shown a survival benefit compared with chemotherapy.25 Given the improved toxicity profile and ability to administer these agents for longer periods of time, older patients are also likely to enjoy improved outcomes with the use of novel agents. However, the impact of novel agents on the older cohort in the present study is difficult to capture likely because of poor penetration of these new drugs into practice and the recentness of the study period.
Ongoing clinical trials for PTCL in the frontline setting that may improve the outcomes of fit older patients with PTCL include evaluation of CHOP with or without hypomethylating agents, including decitabine26 (NCT03553537) and CC48627 (NCT03542266), and incorporation of checkpoint inhibitors with frontline chemotherapy28 (NCT03586999). Novel approaches in the relapsed/refractory setting that may be applicable to older patients with high CCI include phosphoinositide 3-kinase inhibitors29 (NCT03372057), Janus kinase inhibitors30 (NCT04105010), and novel HDACi31 (NCT02953652).
Incorporation of the CCI into prospective studies inclusive of older patients with TCL would inform prognostic discussions, treatment selection, and toxicity management in this vulnerable population.
Conclusion
We believe this is one of the largest cohorts presented in older patients with PTCL, and the outcomes can be used as a comparative benchmark for future studies in this population. Comorbidity and advancing age in as little as 5-year increments are important adverse factors in this group. Most of these patients die of lymphoma within a year from diagnosis, and development of new treatments represents an unmet clinical need.
Acknowledgments
This work was supported by Liane and Stephen Hornsey and Brad Ellison.
Authorship
Contribution: M.M., H.C., and F.E. designed the study; M.M., H.C., M.B., F.E., and D.G. collected the data; X.W. and H.C. analyzed the data and made the figures; and all authors wrote the manuscript.
Conflict-of-interest disclosure: M.J. received research support from Gilead, Abbvie, Janssen, Celgene, and Roche and honoraria from Gilead, BMS, Janssen, Roche, and Acerta. All remaining authors declare no competing financial interests.
Correspondence: Monica Mead, University of California, Los Angeles, 2825 Santa Monica Blvd, Suite 200, Santa Monica, CA 90404; e-mail: mmead@mednet.ucla.edu.

