

Key Points
The efficacy of deferiprone was noninferior to deferoxamine for treating transfusional iron overload in patients with SCD or other anemias.
The safety profile of deferiprone in patients with SCD was tolerable and similar to previous reports in patients with thalassemia syndromes.

Abstract
Many people with sickle cell disease (SCD) or other anemias require chronic blood transfusions, which often causes iron overload that requires chelation therapy. The iron chelator deferiprone is frequently used in individuals with thalassemia syndromes, but data in patients with SCD are limited. This open-label study assessed the efficacy and safety of deferiprone in patients with SCD or other anemias receiving chronic transfusion therapy. A total of 228 patients (mean age: 16.9 [range, 3-59] years; 46.9% female) were randomized to receive either oral deferiprone (n = 152) or subcutaneous deferoxamine (n = 76). The primary endpoint was change from baseline at 12 months in liver iron concentration (LIC), assessed by R2* magnetic resonance imaging (MRI). The least squares mean (standard error) change in LIC was −4.04 (0.48) mg/g dry weight for deferiprone vs −4.45 (0.57) mg/g dry weight for deferoxamine, with noninferiority of deferiprone to deferoxamine demonstrated by analysis of covariance (least squares mean difference 0.40 [0.56]; 96.01% confidence interval, −0.76 to 1.57). Noninferiority of deferiprone was also shown for both cardiac T2* MRI and serum ferritin. Rates of overall adverse events (AEs), treatment-related AEs, serious AEs, and AEs leading to withdrawal did not differ significantly between the groups. AEs related to deferiprone treatment included abdominal pain (17.1% of patients), vomiting (14.5%), pyrexia (9.2%), increased alanine transferase (9.2%) and aspartate transferase levels (9.2%), neutropenia (2.6%), and agranulocytosis (0.7%). The efficacy and safety profiles of deferiprone were acceptable and consistent with those seen in patients with transfusion-dependent thalassemia. This trial study was registered at www://clinicaltrials.gov as #NCT02041299.
Introduction
Sickle cell disease (SCD) is one of the most common inherited blood disorders in the world.1 Globally, an estimated 300 000 to 400 000 children are born with SCD every year.1 In the United States, SCD occurs in about 1 of every 365 African American births and 1 of every 16 300 Hispanic American births; an estimated total of 100 000 Americans are affected by this disorder.2 Many individuals with SCD require intermittent or chronic red blood cell transfusions.3,4 A UK study reported that blood transfusions were required in 41% of adults with SCD.5 In a US study, almost 30% of hospitalized children with SCD needed transfusions.6
There is no natural mechanism to excrete excess body iron, so without iron chelation therapy, iron rapidly accumulates in the tissues of patients who are repeatedly transfused.7 Free iron is toxic to cells, acting as a catalyst in the formation of free radicals and leading to morbidity, including hepatic fibrosis, arrhythmias, congestive heart failure, and several types of endocrinopathies, and, if untreated, can lead to organ failure and death.8-10 Within the SCD population, patients with iron overload have higher rates of acute painful sickle cell crises (64% vs 38%) and organ failure (71% vs 19%), and mortality is higher (64% vs 5%) compared with patients who have normal iron levels.11 Accordingly, when individuals require frequent blood transfusions, chelation treatment is critical.
At the time of this study, there were only 2 iron chelators, deferoxamine and deferasirox, approved in the United States for the treatment of chronic transfusional iron overload in patients with SCD and rare anemias other than thalassemia12-14 ; however, both agents have limitations. Deferoxamine must be administered parenterally over 8 to 12 hours per day, which imposes a significant treatment burden for patients and their caregivers and can impede adherence.15,16 Deferasirox is taken orally as tablets or granules, which provides convenience; however, the drug has been associated with hepatic, gastrointestinal, and renal toxicities, which is of particular concern for patients with SCD who may have preexisting renal impairment.17
Deferiprone (Ferriprox, Chiesi USA, Cary, NC) is an oral iron chelator, available in tablet and liquid formulations and initially approved for the treatment of iron overload in patients with thalassemia syndromes when other iron chelation therapy is inadequate.18-21 Its long-term efficacy and safety in that population have been well studied,9,22,23 but data in patients with SCD and other transfusion-dependent anemias are limited. This article presents the findings of the Ferriprox in Patients with Iron Overload in Sickle Cell Disease Trial (FIRST), which was performed upon request by the US Food and Drug Administration (FDA) to compare the efficacy and safety of deferiprone with that of deferoxamine in iron-overloaded patients with SCD or other anemias. The results of this study led to FDA approval of deferiprone for patients 3 years of age and older with SCD or other anemias.
Methods
Study design and treatment
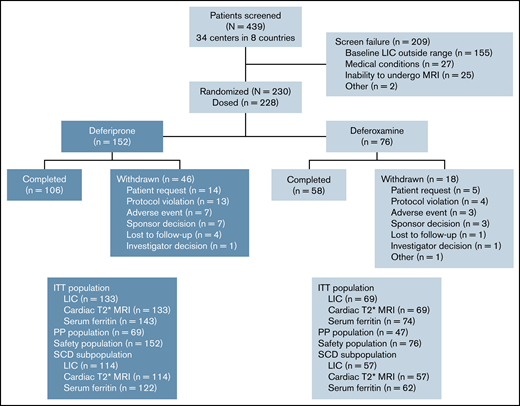
This late-phase (phase 4 in the United States, phase 3b in other countries), multicenter, randomized, open-label study enrolled patients from 34 centers in 8 countries between April 17, 2014, and December 17, 2018. Eligible patients were randomly assigned in a 2:1 ratio to receive either deferiprone or deferoxamine for up to 12 months (Figure 1). Randomization was stratified by disease category (SCD vs other anemias) and transfusional iron input in the 3 months before baseline (low [≤0.3 mg/kg per day] vs high [>0.3 mg/kg per day]). A 7-day washout period was required if patients were taking chelation therapy before the study.
Deferiprone was taken orally as 3 doses per day ∼8 hours apart, whereas deferoxamine was administered as a subcutaneous infusion over 8 to 12 hours, 5 to 7 days per week. For both products, dosage was based on body weight and on extent of iron load (less severe vs more severe). Patients with transfusional iron intake less than or equal to 0.3 mg/kg per day, liver iron concentration (LIC) less than 15 mg/g dry weight (dw), cardiac T2* magnetic resonance imaging (MRI) >20 ms, and serum ferritin level <2500 μg/L were considered to have less severe iron load, and were prescribed either deferiprone at a total daily dosage of 75 mg/kg (25 mg/kg per dose) or deferoxamine at a daily dose of 20 mg/kg (children) or 40 mg/kg (adults). Those who did not meet all of these criteria were considered to have more severe iron load and were prescribed either deferiprone at a total daily dosage of 99 mg/kg (33 mg/kg per dose) or deferoxamine at a daily dose of up to 40 mg/kg (children) or 50 mg/kg (adults). Treatment compliance was measured monthly by counting the number of tablets or measuring the volume of oral solution returned for patients on deferiprone, and by checking the infusion pump electronic record for patients on deferoxamine. In addition, patients were asked to record their medication usage in a diary. Patients who took 80% to 120% of the prescribed dose were considered to be compliant.
This study was conducted in accordance with the Declaration of Helsinki. Adult patients provided written informed consent, whereas for minors (≤17 years of age and <16 in the United Kingdom) parent/guardian consent, and where applicable patient assent, were obtained. All participating sites obtained independent ethics committee/institutional review board approval.
Study population
Male and female patients aged 2 years or older were eligible for study enrollment if they had a diagnosis of SCD or a transfusion-dependent anemia; had a baseline LIC exceeding 7 mg/g dw, as measured by MRI; and had received at least 20 blood transfusions, including at least 1 per year in the previous 2 years, and with an expected requirement for blood transfusions to continue during the trial. Key exclusion criteria included diagnosis of a thalassemia syndrome, myelodysplastic syndrome, myelofibrosis, or Diamond-Blackfan anemia; primary bone marrow failure; treatment with hydroxyurea within 30 days of the study; a baseline LIC measurement exceeding 30 mg/g dw; and a baseline cardiac T2* MRI < 10 ms. Full eligibility criteria are provided in supplemental Table 1.
Efficacy variables and assessments
The primary efficacy endpoint was the change from baseline to 12 months in LIC as measured by R2* MRI. Secondary efficacy endpoints were the change from baseline to 12 months in cardiac iron as assessed by cardiac T2* MRI, serum ferritin levels, and patient-reported quality of life (QoL) assessed by the 36-item Short Form (SF-36) and Child Health Questionnaire–Parent Form 50 (CHQ-PF50) questionnaires, respectively, for adults and parents/guardians of minors. Assessments of LIC, cardiac T2* MRI, and QoL were performed at baseline, 6 months, and 12 months (or early termination); serum ferritin levels were measured every 3 months.
Safety outcomes and assessments
Safety assessments were conducted at each site visit and included the frequency, severity, time to onset, duration, and relationship to study drug of adverse events (AEs) and serious adverse events (SAEs). AEs that led to discontinuation of treatment were also recorded. Initially, hematology assessments to assess absolute neutrophil count (ANC), hemoglobin level, platelet count, and total white blood cell count were done weekly throughout the study. This was later amended to weekly assessments for the first 6 months and every 2 weeks thereafter. Biochemistry and electrocardiography tests were also conducted monthly and biannually, respectively.
Sample size and statistical methods
The planned enrollment was 300 patients, with 200 in the deferiprone group and 100 in the deferoxamine group. At least 80% of patients had to have a diagnosis of SCD. With respect to the primary endpoint, it had been estimated that this number would provide >95% power for showing noninferiority of deferiprone to deferoxamine, based on a noninferiority margin of 2 mg/g dw for the reduction of LIC, and a 2-sided α of 0.05 (1-sided α of 0.025). However, recruitment proceeded slowly, and of 439 patients who were screened, only 228 were enrolled. All 228 patients (152 deferiprone, 76 deferoxamine) received at least 1 dose of study drug and were included in the safety analysis population, whereas 217 patients (143 deferiprone, 74 deferoxamine) underwent at least 1 postbaseline efficacy assessment and were included in the intent-to-treat (ITT) population for the evaluation of the efficacy endpoints (Figure 1). A power analysis with the same noninferiority margin for the reduction of LIC with a 2-sided α level of 0.0399 (Pocock α spending method) indicated that this sample size would be sufficient to meet the primary endpoint and, based on the results of a preplanned interim analysis, the decision was made to terminate the study early, mainly because of futility of additional data for achieving study objectives. For all measures, the last-observation-carried-forward method was used to fill in missing data for patients who withdrew early from the study. The per-protocol population was used for secondary analyses of the efficacy endpoints and included patients who completed the 12 months of treatment without a major protocol deviation.
The changes in LIC, cardiac T2* MRI, and serum ferritin levels at 12 months were each analyzed using an analysis of covariance (ANCOVA) model, with treatment as the main factor, and overall average transfusional iron input during the study and the baseline value of the iron load measure as stratification factors. For the primary efficacy endpoint (change in LIC), it was determined that noninferiority of deferiprone vs deferoxamine would be shown if the upper limit of the 96.01% confidence interval (CI) of the difference between treatment groups was ≤2 mg/g dw. Noninferiority for changes in cardiac T2* MRI and serum ferritin levels would be demonstrated if the 96.01% CI contained 0. For cardiac T2* MRI, the data were log-transformed for normalization for statistical evaluations. For each efficacy measure, in addition to the analyses done on the entire population, separate analyses were conducted on patients with SCD vs those with other anemias.
Results
Study population
Of 439 patients who were screened, 230 met the eligibility criteria and were randomly assigned to treatment. Because 2 patients in the deferoxamine group withdrew before receiving a dose, 228 patients received treatment (deferiprone, n = 152; deferoxamine, n = 76; Figure 1). The treatment groups were well balanced with respect to demographics and baseline characteristics (Table 1). The mean age (range) of patients was 16.9 (3-59) years with 142 (62.3%) patients younger than 18 years of age, including 80 (35.1%) patients younger than 12 years of age. Almost one-half (46.9%) of the patients were female. The mean (standard deviation [SD]) LIC at baseline was 16.44 (7.53) mg/g dw for deferiprone patients and 15.79 (7.14) for deferoxamine patients (Table 2). The geometric mean (coefficient of variance [CV%]) of log cardiac T2* MRI at baseline was 32.99 (19.81) ms for deferiprone patients and 33.35 (19.47) ms for deferoxamine patients (Table 2). Two (1.3%) patients in the deferiprone group and 1 (1.3%) patient in the deferoxamine group had a baseline cardiac T2* MRI of <20 ms. The mean (SD) transfusional iron input during the study was 0.19 (0.12) mg/kg per day for the deferiprone group and 0.18 (0.10) mg/kg per day for the deferoxamine group (Figure 2). No patients used hydroxyurea concomitantly with their study treatment. Treatment compliance throughout the study was similar between the groups (68.9% for deferiprone vs 78.9% for deferoxamine, P = .12). In the deferiprone group, more patients took the tablets vs the oral solution (128 vs 24). The mean (SD; range) total daily dosage was 74.7 (9.3; 45.0-93.4) mg/kg per day for deferiprone and 39.6 (9.1; 20.0-50.0) mg/kg per day for deferoxamine.
Patient demographics and baseline characteristics (safety population)
| DFP (n = 152) | DFO (n = 76) | Overall (N = 228) | DFP vs DFO P value* | |
|---|---|---|---|---|
| Age (y), n (%) | ||||
| ≥2 to <6 | 10 (6.6) | 2 (2.6) | 12 (5.3) | |
| ≥6 to <18 | 84 (55.3) | 46 (60.6) | 130 (57.0) | |
| ≥18 | 58 (38.1) | 28 (36.8) | 86 (37.7) | |
| Mean ± SD | 16.9 ± 10.2 | 16.9 ± 8.5 | 16.9 ± 9.6 | .9712 |
| Range | 3, 59 | 4, 40 | 3, 59 | |
| Sex, n (%) | .5740 | |||
| Female | 69 (45.4) | 38 (50.0) | 107 (46.9) | |
| Male | 83 (54.6) | 38 (50.0) | 121 (53.1) | |
| Ethnicity, n (%) | .7850 | |||
| African or African American | 7 (4.6) | 7 (9.2) | 14 (6.1) | |
| Arab or Egyptian | 18 (11.8) | 6 (7.9) | 24 (10.5) | |
| Caucasian | 100 (65.8) | 49 (64.5) | 149 (65.4) | |
| Hispanic/Latino | 10 (6.6) | 6 (7.9) | 16 (7.0) | |
| Other† | 17 (11.2) | 8 (10.5) | 25 (11.0) | |
| Race, n (%) | .6632 | |||
| Black | 23 (15.1) | 14 (18.4) | 37 (16.2) | |
| Multiracial | 9 (5.9) | 6 (7.9) | 15 (6.6) | |
| White | 120 (78.9) | 56 (73.7) | 176 (77.2) | |
| Transfusional iron input (mg/kg per day) in the 3 mo before study | ||||
| N | 152 | 76 | N/A | |
| Mean (SD) | 0.18 (0.15) | 0.20 (0.18) | N/A | .5442 |
| Range | 0.00, 1.15 | 0.00, 1.13 | N/A | |
| Primary diagnosis,n (%) | .8313 | |||
| Autoimmune hemolytic anemia | 1 (0.7) | 1 (1.3) | 2 (0.9) | |
| Congenital anemia | 1 (0.7) | 1 (1.3) | 2 (0.9) | |
| Congenital dyserythropoietic anemia | 4 (2.6) | 3 (3.9) | 7 (3.1) | |
| Hemoglobin C disease | 2 (1.3) | 1 (1.3) | 3 (1.3) | |
| Hemoglobinopathy | 1 (0.7) | 0 (0.0) | 1 (0.4) | |
| Hemolytic anemia | 1 (0.7) | 0 (0.0) | 1 (0.4) | |
| Pyruvate kinase deficiency anemia | 2 (1.3) | 1 (1.3) | 3 (1.3) | |
| Sickle cell disease‡ | 126 (82.9) | 63 (82.9) | 189 (82.9) | |
| Spherocytic anemia§ | 14 (9.2) | 6 (7.9) | 20 (8.8) | |
| Previous iron chelation therapy,ǁn (%) | ||||
| Deferiprone | 28 (18.4) | 19 (25.0) | 47 (20.6) | .2975 |
| Deferoxamine | 25 (16.4) | 17 (22.4) | 42 (18.4) | .2825 |
| Deferasirox | 38 (25.0) | 17 (22.4) | 55 (24.1) | .7436 |
| No iron chelation therapy | 74 (48.7) | 32 (42.1) | 106 (46.5) | .3988 |
DFO, deferoxamine; DFP, deferiprone; N/A, not available.
t test for age; Fisher exact test for sex, ethnicity, race, primary diagnosis, and previous iron chelation therapy.
Other ethnicities include black British, non-Hispanic, and unknown.
Sickle cell disease includes classifications of sickle cell disease, sickle cell anemia, and thalassemia sickle cell.
Spherocytic anemia includes classifications of hereditary spherocytosis and spherocytic anemia.
Iron chelation therapy within 3 mo before baseline.
Baseline iron burden of ITT population
| DFP | DFO | DFP vs DFO P value (t test) | |
|---|---|---|---|
| LIC (mg/g dw) | |||
| n | 133 | 69 | |
| Mean (SD) | 16.44 (7.53) | 15.79 (7.14) | .5502 |
| Range | 6.17, 34.41 | 7.02, 31.63 | |
| Log cardiac T2* MRI (ms) | |||
| n | 133 | 69 | |
| Geometric mean (CV%) | 32.99 (19.81) | 33.35 (19.47) | .7126 |
| Range | 15.30, 49.84 | 18.20, 52.90 | |
| Serum ferritin (μg/L) | |||
| n | 143 | 74 | |
| Mean (SD) | 4114.5 (2385.7) | 4136.9 (2649.1) | .9515 |
| Range | 564.1, 12 630.0 | 392.5, 13 048.0 |
DFO, deferoxamine; DFP, deferiprone.
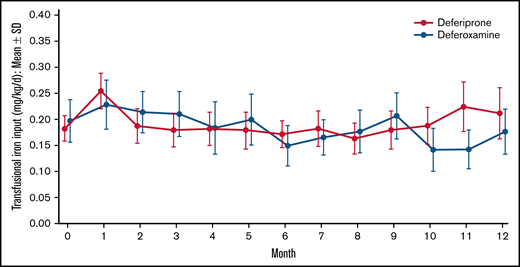
Mean transfusional iron input over time by treatment. Data are shown as mean (95% CI).
Mean transfusional iron input over time by treatment. Data are shown as mean (95% CI).
A total of 106 (69.7%) patients in the deferiprone group and 58 (76.3%) in the deferoxamine group completed 12 months of treatment. There was no significant difference in the discontinuation rate between the 2 treatment groups (deferiprone 30.3% vs deferoxamine 23.1%; P = .28). Reasons for discontinuation were patient request (14 patients in the deferiprone group and 7 patients in the deferoxamine group), protocol violation (13 and 4), AEs (7 and 3), lost to follow-up (4 and 1), and investigator decision (1 and 1). Two of the patients in the deferiprone group who discontinued because of a protocol violation were pregnant, with 1 patient experiencing hypovolemic shock and syncope before the pregnancy being discovered. In addition, 10 patients (7 and 3) were involuntarily withdrawn when the sponsor made the decision to terminate the study, and 1 patient (deferoxamine group) withdrew to begin preparation for stem cell transplantation (Figure 1). Reasons for patients requesting to withdraw from the study are listed in supplemental Table 2.
Primary efficacy outcome
In the ITT analysis set, patients in both treatment groups achieved a reduction in LIC at 6 months and 12 months compared with baseline (Figure 3A). At 12 months, the mean (standard error [SE]) change in LIC was −2.96 (0.41) mg/g dw for the deferiprone group and −3.39 (0.52) mg/g dw for the deferoxamine group (P = .51; Figure 3B). Analysis of the least square (LS) means of change (SE) at 12 months (deferiprone −4.04 [0.48] vs deferoxamine −4.45 [0.57]), using an ANCOVA model, demonstrated noninferiority of deferiprone to deferoxamine (difference in LS means, 0.40 [0.56]; 96.01% CI, −0.76 to 1.57; Table 3).
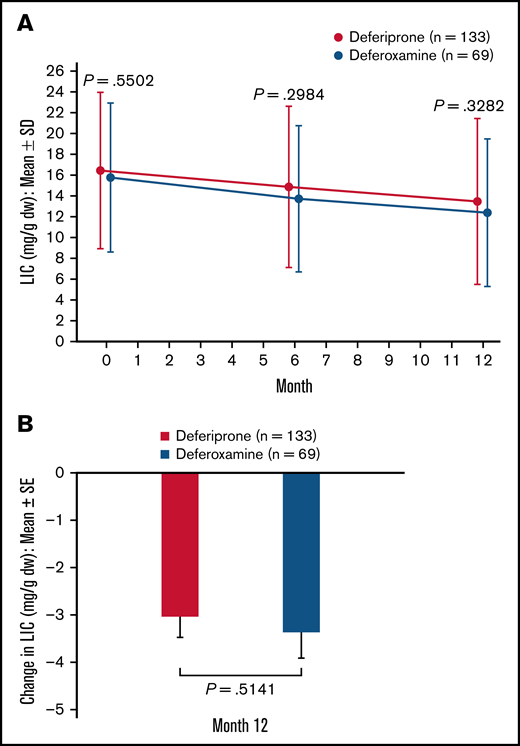
LIC (mg/g dw)† for deferiprone and deferoxamine treatment groups for the ITT population (primary endpoint). (A) LIC over time. Data are shown as means with error bars showing SD. (B) Mean change in LIC from baseline at month 12. Data are shown as means with error bars showing SE. A t test was used to calculate the P value. †LIC was measured using R2* MRI scans, which were performed at screening/baseline, month 6, and month 12 (or early termination), and were transmitted to a central laboratory for interpretation.
LIC (mg/g dw)† for deferiprone and deferoxamine treatment groups for the ITT population (primary endpoint). (A) LIC over time. Data are shown as means with error bars showing SD. (B) Mean change in LIC from baseline at month 12. Data are shown as means with error bars showing SE. A t test was used to calculate the P value. †LIC was measured using R2* MRI scans, which were performed at screening/baseline, month 6, and month 12 (or early termination), and were transmitted to a central laboratory for interpretation.
Noninferiority analyses of change in LIC, cardiac T2* MRI, and serum ferritin levels at month 12: ITT population and subpopulations
| LS mean (SE) | 96.01% CI* | |||||
|---|---|---|---|---|---|---|
| n | DFP | n | DFO | Difference (DFP − DFO) | ||
| Change in LIC, mg/g dw | ||||||
| ITT | 133 | −4.04 (0.48) | 69 | −4.45 (0.57) | 0.40 (0.56) | −0.76, 1.57 |
| SCD | 114 | −2.60 (0.43) | 57 | −3.35 (0.56) | 0.74 (0.58) | −0.46, 1.95 |
| Other anemias | 19 | −6.94 (1.19) | 12 | −5.14 (1.50) | −1.79 (1.81) | −5.67, 2.08 |
| Change in log-transformed cardiac T2* MRI, ms | ||||||
| ITT | 133 | −0.023 (0.020) | 69 | −0.022 (0.024) | −0.001 (0.024) | −0.051, 0.049 |
| SCD | 114 | −0.003 (0.018) | 57 | 0.013 (0.024) | −0.017 (0.026) | −0.069, 0.036 |
| Other anemias | 19 | 0.018 (0.050) | 12 | −0.079 (0.063) | 0.097 (0.077) | −0.068, 0.261 |
| Change in serum ferritin, μg/L | ||||||
| ITT | 143 | −414.73 (221.34) | 74 | −749.71 (273.62) | 334.97 (287.75) | −257.63, 927.57 |
| SCD | 122 | 48.16 (229.59) | 62 | −522.57 (298.94) | 570.72 (329.19) | −107.44, 1248.89 |
| Other anemias | 21 | −983.94 (291.01) | 12 | −180.50 (376.32) | −803.45 (439.65) | −1740.50, 133.61 |
DFO, deferoxamine; DFP, deferiprone.
Data were analyzed using an ANCOVA model, with treatment as the main factor and covariates including overall average transfusional iron input during the study, baseline LIC, cardiac T2* MRI, or serum ferritin levels, as stratification factors. Unless otherwise stated, data are shown as LS mean (SE).
Noninferiority of deferiprone to deferoxamine was also demonstrated for the SCD subpopulation, for whom the LS means (SE) of change were −2.60 (0.43) for the deferiprone group and −3.35 (0.56) for the deferoxamine group (difference in LS means, 0.74 [0.58]; 96.01% CI, −0.46 to 1.95; Table 3). For the other anemias subpopulation, noninferiority of deferiprone to deferoxamine was also shown (difference in LS means, −1.79 [1.81]; 96.01% CI, −5.67 to 2.08), although a greater reduction in LIC was observed with deferiprone compared with deferoxamine (LS mean [SE] of change, −6.94 [1.19] vs −5.14 [1.50], respectively; Table 3). Noninferiority of deferiprone to deferoxamine was also demonstrated for the per-protocol population (data not shown).
Secondary efficacy outcomes
Cardiac iron concentration.
A small increase (improvement) was observed in log cardiac T2* MRI from baseline to 6 months in both treatment groups, followed by a small decrease by 12 months (Figure 4A). At 12 months, the relative mean change (CV%) in log cardiac T2* MRI was 1.01 (20.6%) for the deferiprone group and 1.00 (21.1%) for the deferoxamine group (P = .87; Figure 4B). Analysis of the LS means of change at 12 months using an ANCOVA model demonstrated noninferiority of deferiprone to deferoxamine and similar results were seen for the SCD and other anemias subpopulations (Table 3).
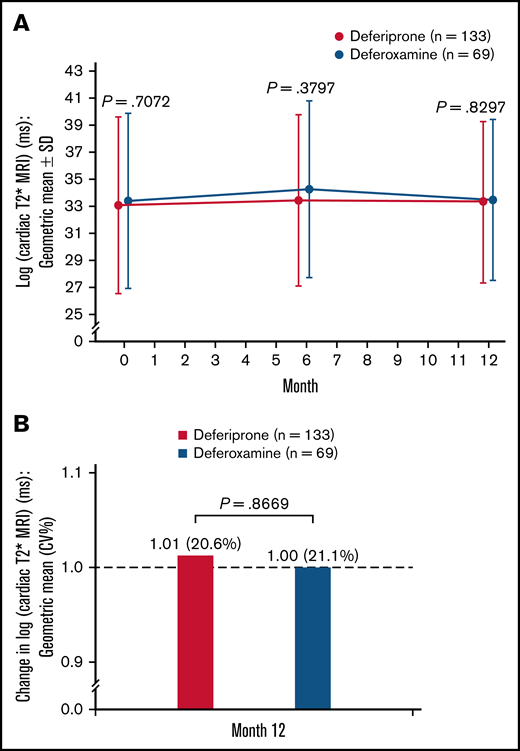
Log cardiac T2* MRI (ms)† for deferiprone and deferoxamine groups for the ITT population. (A) The log cardiac T2* MRI over time. Data are shown as means with error bars showing SD. (B) The change in log cardiac T2* MRI from baseline at month 12. Data are shown as geometric means (CV%). A t test was used to calculate the P value. †MRI scans for the assessment of cardiac T2* MRI were performed at screening/baseline, month 6, and month 12 (or early termination), and the images were transmitted to a central laboratory for interpretation. As stipulated in the statistical analysis plan for data normalization, the data were log-transformed before any statistical analyses were performed.
Log cardiac T2* MRI (ms)† for deferiprone and deferoxamine groups for the ITT population. (A) The log cardiac T2* MRI over time. Data are shown as means with error bars showing SD. (B) The change in log cardiac T2* MRI from baseline at month 12. Data are shown as geometric means (CV%). A t test was used to calculate the P value. †MRI scans for the assessment of cardiac T2* MRI were performed at screening/baseline, month 6, and month 12 (or early termination), and the images were transmitted to a central laboratory for interpretation. As stipulated in the statistical analysis plan for data normalization, the data were log-transformed before any statistical analyses were performed.
Serum ferritin.
A slight decrease in serum ferritin level was observed after baseline in the deferoxamine group. In the deferiprone group, serum ferritin increased from baseline (mean [SD], 4114.5 [2385.7]) to 3 months (4815.5 [2993.2]) but decreased thereafter (Figure 5A). At 12 months, the mean (SE) change in serum ferritin was 15.7 (172.3) μg/L for the deferiprone group and −351.7 (252.1) μg/L for the deferoxamine group (P = .23; Figure 5B). Using an ANCOVA model, analysis of the LS means of change at 12 months demonstrated noninferiority of deferiprone to deferoxamine (Table 3). Similar results were seen for the SCD subpopulation, whereas a greater decrease in serum ferritin was observed with deferiprone compared with deferoxamine in the other anemias subpopulation (Table 3).
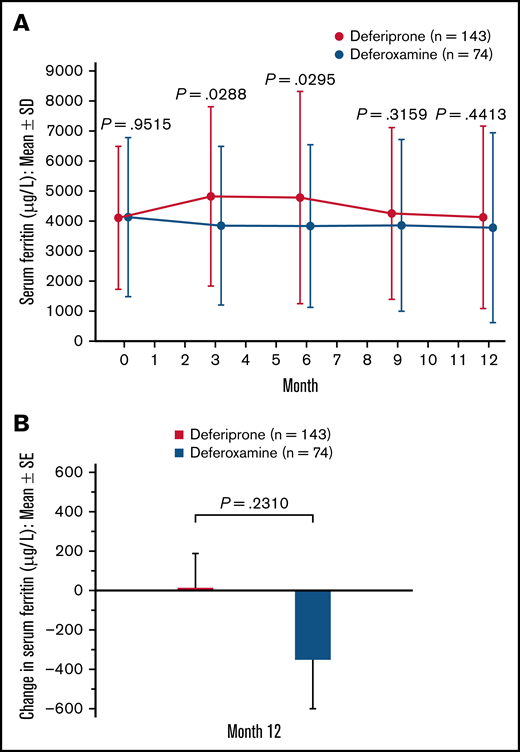
Serum ferritin (μg/L) level for deferiprone and deferoxamine groups for the ITT population. (A) Mean serum ferritin over time. Data are shown as means with error bars showing SD. (B) Mean change in serum ferritin level from baseline at month 12. Data are shown as means with error bars showing SE. A t test was used to calculate the P value. Serum ferritin was measured via blood test at month 3, month 6, month 9, and month 12.
Serum ferritin (μg/L) level for deferiprone and deferoxamine groups for the ITT population. (A) Mean serum ferritin over time. Data are shown as means with error bars showing SD. (B) Mean change in serum ferritin level from baseline at month 12. Data are shown as means with error bars showing SE. A t test was used to calculate the P value. Serum ferritin was measured via blood test at month 3, month 6, month 9, and month 12.
Patient-reported QoL.
A summary of patient-reported QoL scores, assessed by SF-36 and CHQ-PF50 questionnaires for adults and parents/guardians of minors, respectively, is provided in supplemental Table 3. Many patients were missing scores from at least 1 of the 3 assessment visits. No statistically significant differences were seen between the 2 treatment groups in any of the comparisons for either the ITT population (P = .82 - .95) or the SCD and other anemias subpopulations (data not shown).
Safety outcomes
Table 4 gives an overall summary of AEs in both treatment groups, and specific AEs deemed related to study treatment, by preferred term. AEs seen in at least 5% of patients are presented by preferred term in supplemental Table 4. The percentage of patients who experienced at least 1 AE was the same in both treatment groups (88.2%), and the overall rates did not differ significantly for SAEs, AEs related to study treatment, or AEs leading to withdrawal (P > .05; Table 4). Seven (4.6%) patients in the deferiprone group and 3 (3.9%) patients in the deferoxamine group discontinued the study drug because of an AE (Table 4). No deaths relating to study treatment occurred during the study.
Overall summary of AEs and treatment-related AEs in the safety population
| Preferred term | DFP (N = 152) n (%) | DFO (N = 76) n (%) | P value (DFP vs DFO) (Fisher exact) |
|---|---|---|---|
| Overall summary of AEs | |||
| AE | 134 (88.2) | 67 (88.2) | 1.0000 |
| Severe AE | 25 (16.4) | 5 (6.6) | 0.0393 |
| SAE | 40 (26.3) | 14 (18.4) | 0.2472 |
| Treatment-related AE* | 78 (51.3) | 30 (39.5) | 0.1215 |
| Treatment-related SAE* | 9 (5.9) | 3 (3.9) | 0.7550 |
| Withdrew due to an AE† | 7 (4.6) | 3 (3.9) | 1.0000 |
| Treatment-related AEs by preferred term occurring in ≥ 5% of patients | |||
| Abdominal pain‡ | 26 (17.1) | 3 (3.9) | 0.0053 |
| Vomiting | 22 (14.5) | 1 (1.3) | 0.0009 |
| Pyrexia | 14 (9.2) | 7 (9.2) | 1.0000 |
| ALT level increased above normal | 14 (9.2) | 0 (0.0) | 0.0059 |
| AST level increased above normal | 14 (9.2) | 0 (0.0) | 0.0059 |
| Neutrophil count decreased | 9 (5.9) | 2 (2.6) | 0.3441 |
| Nausea | 8 (5.3) | 2 (2.6) | 0.5024 |
| Chromaturia | 8 (5.3) | 1 (1.3) | 0.2781 |
| Injection-site pain | 0 (0.0) | 5 (6.6) | 0.0038 |
DFO, deferoxamine; DFP, deferiprone.
The causal relationship to study medication was based on the investigator’s and sponsor’s assessments.
AEs leading to withdrawal from the study included abdominal pain and vomiting (DFP n = 2), nausea (DFO n = 1), acute chest syndrome (DFP = 1), pneumonia (DFO = 1), motor car accident (DFP n = 1, DFO n = 1), hepatic and splenic complications (DFP n = 1), neutropenia (DFP n = 1), and agranulocytosis (DFP n = 1).
Includes the preferred terms of abdominal pain and abdominal pain upper.
AEs that were deemed at least possibly related to treatment by the study investigators included abdominal pain, vomiting, pyrexia, increased alanine transferase (ALT), increased aspartate transferase (AST), and injection site pain (Table 4). Increases in liver enzymes deemed at least possibly related to deferiprone treatment were reported in 14 (9.2%) patients for increased ALT and 14 (9.2%) patients for increased AST, compared with no patients in the deferoxamine group (Table 4). Seventeen (11.2%) deferiprone-treated patients had ALT levels exceeding 5 times the upper limit of normal. In general, those episodes were of single ALT values above this threshold, with return to baseline values despite continued deferiprone therapy. For all deferiprone-treated patients who had an AE of increased ALT or AST, the mean (SD) change in ALT and AST from baseline to 12 months was 28.4 (66.6; P = .11) and 23.1 (85.9; P = .32) U/L, respectively.
The most frequent SAE was sickle cell crisis, experienced by 16 (10.5%) patients taking deferiprone vs 4 (5.3%, P = .22) patients taking deferoxamine, followed by pyrexia (5 [3.3%] vs 3 [3.9%], respectively), neutropenia (4 [2.6%] vs 1 [1.3%]), abdominal pain (3 [2.0%] vs 1 [1.3%]), and acute chest syndrome (3 [2.0%] vs 0 [0.0%]). All cases of mild neutropenia (ANC ≥ 1.0 × 10⁹/L and <1.5 × 10⁹/L) observed in the deferiprone group were deemed related to treatment. No action was taken for 2 patients in whom neutropenia occurred at 2 weeks and 8 weeks after commencing deferiprone, treatment was interrupted for 1 patient who experienced neutropenia after 4.5 months on deferiprone, and treatment had been already interrupted because of an infection for 1 patient who experienced neutropenia 1 year after commencing deferiprone. Most patients recovered within 4 to 12 days; however, for 1 patient with a low baseline ANC, the case of mild neutropenia, for which treatment was not interrupted, took more than 14 days to resolve and led to study withdrawal according to the study protocol. One patient in the deferiprone group had agranulocytosis (ANC < 0.5 × 10⁹/L), which occurred after 7.5 months of treatment and resolved 1 day following discontinuation of treatment and withdrawal from the study. There was 1 neutropenia case, which was judged not treatment related, and no cases of agranulocytosis in the deferoxamine group.
Other than ALT and AST levels, generally no clinically significant differences were observed between treatment groups in terms of laboratory parameters, vital signs, and physical examination findings during the study and mean laboratory values stayed within normal ranges.
Discussion
In this randomized open-label study, the efficacy of deferiprone was noninferior to that of deferoxamine for all 3 measures of iron load (LIC, cardiac iron, and serum ferritin) in patients with SCD or with other anemias. Deferiprone was generally well tolerated, with an overall safety profile that was acceptable and broadly consistent with that seen in patients with thalassemia syndromes.9,22,23 The safety profile was also similar to that reported from an evaluation of a comprehensive US registry of patients with SCD who were using deferiprone as off-label treatment of transfusional iron overload.24
The overall rate of AEs was the same for both treatment groups, with 88.2% of patients in each group experiencing at least 1 AE. The overall rates for treatment-related AEs, SAEs, or AEs leading to withdrawal also were not significantly different between the 2 groups. Differences were observed for some treatment-related AEs, which are associated with the mode of administration of the chelators: abdominal pain and vomiting were reported more often in the deferiprone group with 2 patients discontinuing the study owing to these AEs, whereas injection-site pain was a common occurrence in the deferoxamine group, with 3 patients discontinuing the study for this reason.
Transient and generally mild increases in ALT and AST have been reported during the first months of deferiprone therapy, but are generally not clinically significant and return to baseline levels without the need for treatment discontinuation or dose reduction.25-28 In our study, for deferiprone-treated patients who experienced ALT or AST increases, mean ALT and AST levels remained higher than the baseline level at 12 months, as was similarly reported in a recent retrospective study29 ; however, the increase was small and there were no treatment discontinuations resulting from the elevated liver enzymes. The difference in ALT and AST levels observed between treatment groups is consistent with a previous study comparing deferiprone and deferoxamine treatment of transfusional iron overload in children with beta thalassemia syndromes.25 In contrast, another study in the same patient population found no significant difference in ALT levels between deferiprone- and deferoxamine-treated patients.30
Typically occurring in the first year of treatment, agranulocytosis has been reported in ∼1% to 2% of patients with thalassemia syndromes treated with deferiprone, and less severe episodes of neutropenia in ∼5% of patients treated with deferirprone.8,31-33 Agranulocytosis is often related to deferiprone treatment; however, milder cases of neutropenia may not be drug-related and may occur with other chelators with similar incidence to that of deferiprone, as observed in a large randomized controlled trial.34 In our study, agranulocytosis occurred in 1 (0.7%) deferiprone-treated patient and milder neutropenia in 4 (2.6%) deferiprone-treated patients. Most neutropenia cases resolved within 4 to 12 days, and the agranulocytosis resolved within 1 day of treatment discontinuation. The duration of 1 ongoing case of neutropenia is questionable because this patient withdrew from the study and data were missing. The episode of neutropenia in the deferoxamine group was deemed unrelated to study treatment.
Given that neutropenia has been associated with deferiprone therapy, weekly ANC monitoring was proposed in the first FDA marketing authorization application for deferiprone and has been indicated in the product information since 2011.18,21 However, a review of both clinical and postmarketing data from the past 2 decades confirmed that deferiprone-induced agranulocytosis is not dose-related within its therapeutic dosing range, and its occurrence peaks at 5 months after initiation of therapy, reducing in frequency thereafter.32 Notably, 3 of the 4 neutropenia cases reported in our study occurred in the first 6 months of therapy and the agranulocytosis case occurred 7.5 months after commencing deferiprone. The necessity to monitor ANC weekly therefore appears to decrease after the first 6 months of therapy.32 Based on the conclusions of this review, the frequency of ANC monitoring in our study was reduced after 6 months. Given that weekly monitoring can be burdensome, it was thought that monitoring fortnightly might improve enrollment and reduce discontinuation rates without compromising safety.
The patients in our study had severe iron load, as assessed by LIC. Previous studies have indicated that iron overload may be responsible for up to 11% of deaths in patients with SCD,35,36 highlighting the importance of monitoring and reducing body iron load in this patient group. LIC measurement is a good indicator of body iron load,37,38 and several studies have shown that deferiprone treatment reduces LIC and slows the progression of liver fibrosis.26,28,30,39,40 In our study, deferiprone caused a mean (SE) reduction in LIC from baseline to 12 months of 2.96 (0.41) mg/g dw, which was noninferior to deferoxamine.
The FIRST study showed that deferiprone also was noninferior to deferoxamine at 12 months for change in cardiac T2* MRI and serum ferritin levels. Because most patients in this study had normal cardiac T2* at baseline, only a small effect on cardiac iron was observed with deferiprone, which was similar to deferoxamine. Many previous studies have shown that deferiprone treatment in patients with thalassemia is associated with greater improvement in cardiac iron, reduced iron-related cardiac morbidity, and reduced mortality compared with other iron chelators.30,34,41-47 However, cardiac iron overload is less common in patients with SCD than in those with thalassemia, with an incidence of 2% to 5% in chronically transfused patients with SCD.48,49 Furthermore, there is not a strong relationship between cardiac iron overload and LIC or serum ferritin levels.48,49 The data from FIRST confirm that cardiac iron loading is uncommon in SCD and, in our study, cardiac iron was normal despite high LIC.
In our study, a transient slight increase in serum ferritin was observed in the deferiprone group, which is common at initiation of deferiprone treatment. Subsequently, serum ferritin levels declined in these patients, and, at 12 months, there was no significant difference between the treatment groups in the mean change from baseline. The transient rise in serum ferritin paralleled the increase in ALT and may possibly be explained by transient hepatic inflammation. Several other studies have shown that deferiprone effectively reduces serum ferritin levels in transfusion-dependent patients with thalassemia.25-27,30,34,39,50
Compliance with the prescribed treatment regimen is important for treatment efficacy and long-term reduction of body iron. Previous studies have reported higher compliance with deferiprone than with deferoxamine.50-52 In our study, 68.9% of patients in the deferiprone group and 78.9% in the deferoxamine group met the definition for compliance with treatment, a difference that was not significant. At the time of our study, deferiprone was only available and approved for use at 3-times-daily dosing; however, real-world data and feedback from physicians and patients suggest the 3-times-daily deferiprone regimen may be inconvenient for some patients, often leading to the midday dose being missed, particularly in school-age children. A twice-daily treatment is now approved in the United States,18 which is expected to further increase compliance.53,54 In addition, more patients took deferiprone tablets vs the oral solution in our study. The oral deferiprone solution has been associated with fewer gastrointestinal AEs compared with the tablets,21,55-57 and may therefore improve compliance for those patients who are experiencing adverse gastrointestinal symptoms associated with the tablets. Patient education on treatment side effects could improve patient expectations and potentially improve treatment compliance.
A limitation of our study was that the sample size was smaller than planned: a result of slow recruitment and possibly the availability of another oral iron chelator, deferasirox. However, a power analysis indicated that the number of patients enrolled in the study was sufficient to demonstrate noninferiority of deferiprone to deferoxamine with respect to the primary endpoint. As with most clinical trials, the frequency of laboratory visits and testing may have promoted treatment compliance compared with a real-world setting in which patients are usually not monitored so closely. However, burdensome study requirements also may have affected discontinuation rates, with 8 patients withdrawing from the study because they could not attend the frequent laboratory visits or follow the study procedures. An additional limitation that affected enrollment and completion rates was that patients were randomly assigned to either deferiprone or deferoxamine independent of their previous treatment. Many patients receiving chronic transfusions already had been on oral chelation, which may have limited their (or their caregiver’s) willingness to enroll in a study with possible assignment to a subcutaneously administered drug. Indeed, 2 patients assigned to deferoxamine withdrew from the study for this reason. No significant group differences in the summary scores of the QoL questionnaires were seen in the overall patient cohort in this study. The QoL results should be interpreted cautiously, however, as the questionnaires had not been designed to assess the impact of iron chelation therapy.
Deferiprone provides a new treatment option for patients with SCD and other rare anemias with transfusional iron overload. This oral iron chelator effectively reduced transfusional iron overload, and the effect was noninferior to subcutaneously infused deferoxamine. Deferiprone had an acceptable safety profile, consistent with that previously seen in patients with thalassemia syndromes. At the end of FIRST, participants were invited to enter a 2-year extension in which all patients received deferiprone (FIRST-EXT, #NCT02443545). This trial provides additional long-term data on the safety and efficacy of deferiprone in SCD.
Acknowledgments
The authors thank all the patients, their families, and the investigators involved in FIRST. They also thank Caroline Fradette, Yu Chung Tsang, Anna Rozova, Jodie Sinclair, Dian Shaw, Theresa Chan, Noemi Toiber Temin, and Michael Spino from Chiesi for their contributions, and Anne Stilman from Chiesi, who provided a detailed review of the publication.
Medical writing support was provided by Cara Kingston, of Oxford PharmaGenesis and was funded by Chiesi. This study was sponsored by ApoPharma Inc. (now Chiesi) and supported by grants UL1T R000003 and UL1T R001878 from the National Center for Advancing Translational Sciences.
Authorship
Contribution: J.L.K., D.L., and F.T. contributed to the design of the study; J.L.K., M.H., A.E., F.S.E.E., M.B., A.A., J.K., B.I., A.A.M.A., S.W., Y.K., and M.S.E. contributed to the conduct of the study; D.L. analyzed the data and all authors contributed to the interpretation of the data; and all authors reviewed and critically revised the manuscript for important intellectual content and approved the final version for submission.
Conflict-of-interest disclosure: J.L.K. has received consultancy fees from bluebird bio and Imara; advisory board fees from Celgene (Bristol Myers Squibb), Silence Therapeutics, and Agios; and research funding from ApoPharma, Novartis, bluebird bio, Sangamo, and Terumo BCT. M.H. has received speaker’s fees and honoraria for advisory board participation from ApoPharma, Amgen, Bayer, Novartis, Novo Nordisk, Roche, and Takeda. A.A. has received research funding from ApoPharma. J.K. has received honoraria for consulting and advisory board participation from Guide point Global, GLG Pharma, Imara, Novartis, Graphite, Axcella Health, Sanofi, Beam, Forma, and AstraZeneca, and research funding from the National Heart Lung and Blood Institute and Health Resources and Services Administration. F.T. and D.L. are employees of Chiesi Canada Corp, the sponsor of the study. The remaining authors declare no competing financial interests.
Correspondence: Janet L. Kwiatkowski, Division of Hematology, The Children's Hospital of Philadelphia, 3401 Civic Center Blvd, Philadelphia, PA 19104; e-mail: kwiatkowski@chop.edu.

