

Key Points
Pathogenesis of cancer-associated thrombosis (CAT) is multifactorial, and risk of CAT varies based on patient-, tumor-, and treatment-related factors.
We identified novel biomarkers and pathways associated with CAT, and prospective studies are needed to gain insight on these findings.

Abstract
Cancer is associated with an increased risk of venous thromboembolism (VTE). In the CASSINI study, ambulatory cancer patients with a Khorana risk score ≥2 had a reduced risk of VTE while receiving rivaroxaban. This analysis used blood samples from CASSINI to compare biomarker levels between patients with and without VTE. VTE occurred in 62 patients during the 6 months of CASSINI (cases), and they were matched by age, sex, cancer type, tumor stage, and Khorana score to 62 controls. Baseline blood samples were analyzed for 280 biomarkers, and biomarker distribution was compared using the Wilcoxon rank-sum test between groups defined by VTE occurrence and vital status. Sparse Bayesian regression modeling was used to select a joint panel of potential VTE biomarkers. Biomarkers with the largest differences in baseline distribution among cancer patients with and without VTE included decreases in stromal cell–derived factor-1 (SDF-1), thyroid-stimulating hormone (TSH), and monocyte chemotactic protein 4 and increases in growth hormone (GH) and interleukin-1 receptor type 1 (IL-1R1). Between survivors and those who died, significantly different biomarkers included ST2, IL-8, and C-reactive protein. Regression analyses also identified decreases in SDF-1 and TSH. Pathway analysis indicated enrichment of cytokine and chemokine activity with IL-1R1, SDF-1, and GH, which are the strongest predictors of VTE or death. Our analyses highlight the interactions between hemostatic and inflammatory processes and identify candidate biomarkers of cancer-associated VTE. Prospective studies will determine clinical relevance of these biomarkers. This trial was registered at www.ClinicalTrials.gov as #NCT02555878.
Introduction
Thromboembolism contributes substantial morbidity and mortality to cancer patients.1 Venous thromboembolism (VTE) is more likely to occur in patients with advanced cancer and metastatic disease and is associated with shorter survival. Cancer is associated with an increased risk of developing VTE, which occurs in up to 20% of cancer patients, and arterial thromboembolism, which affects 2% to 5% of cancer patients.2 A significant challenge associated with the management of VTE risk in cancer patients is that it varies by a number of factors, including cancer type, platelet and leukocyte levels, and patient-related factors.2,3
The Khorana risk score is currently the most widely validated predictive model for risk of developing VTE in cancer patients.1,3 Clinical guidelines recommend this score as the only validated risk assessment tool for the prediction of cancer-associated VTE in outpatients.4-6 Scores are calculated based on the presence of very high-risk (stomach or pancreas) or high-risk (lung, lymphoma, gynecologic, bladder, testicular) cancers, platelet count (≥350 000/µL), hemoglobin (<10 g/dL or use of erythropoiesis-stimulating agents), leukocyte count (>11 000/µL), and body mass index (≥35 kg/m2).3 The biomarkers D-dimer and soluble P-selectin were added to extend the Khorana score in the Vienna Cancer and Thrombosis Study (CATS) score.7 These 2 biomarkers and thrombin generation were independently associated with VTE risk in cancer patients based on the results of observational studies.7,8 Data from additional cohort studies are needed to consider alterations to clinical practice guidelines.4
Recent studies have attempted to identify novel biomarkers predictive of cancer-associated VTE. Lung cancer patients with elevated D-dimer levels were found to have significantly shorter survival, particularly Asian patients.9 Similar negative associations of elevated D-dimer on survival have been identified in patients with other types of cancer, including breast, colorectal, cervical, pancreatic, and prostate cancer.1 However, differences in d-dimer assay methodologies and patient populations studied raise questions about specific cutoff values for d-dimer. Prothrombin fragment 1 + 2 complements d-dimer in identifying patients at risk of VTE and is considered a specific in vivo measurement of thrombin generation.10,11 d-dimer plasma levels have also been correlated to plasma levels of interleukin (IL)-6, vascular endothelial growth factor (VEGF), serum VEGF per 106 platelets, and fibrinogen.12 Thus, mediators of inflammation and angiogenesis may interact with the hemostatic system to further the procoagulant state associated with cancer.11 C-reactive protein (CRP), a measure of systemic inflammation, has been inconsistently associated with VTE in cancer patients.
The CASSINI study examined the effect of rivaroxaban vs placebo on VTE incidence in ambulatory cancer patients considered to be at high risk for VTE, as assessed by the Khorana score.13 While on treatment, rivaroxaban 10 mg once daily reduced the risk of a VTE event. An analysis of the primary endpoint (composite of objectively defined proximal deep-vein thrombosis [DVT] in a lower limb, pulmonary embolism, symptomatic DVT in an upper limb or distal DVT in a lower limb, and death from VTE) during the intervention period identified events in 11 of 420 (2.6%) of the rivaroxaban group and 27 of 421 (6.4%) of the placebo group (hazard ratio [HR], 0.40; 95% confidence interval [CI], 0.20-0.80). We examined a large panel of biomarkers in blood samples from patients enrolled in CASSINI at baseline to determine differences in levels between patients who did and did not develop VTE.
Methods
CASSINI study design and patients
The CASSINI study was a multicenter, randomized, double-blind, placebo-controlled, parallel-group, phase 3b trial for which the methods and primary results have previously been published in detail.13,14 Briefly, patients aged 18 years and older who were ambulatory and had a solid tumor or lymphoma were eligible for enrollment. Other key inclusion criteria required patients to have a Khorana score of 2 or higher at baseline, expected survival >6 months, and initiation of a new systemic cancer therapy regimen within 1 week before or after starting study medication. Enrolled patients had venous ultrasonography of both legs to exclude those with preexisting proximal DVT. Patients without thrombosis were randomized to rivaroxaban 10 mg or placebo once daily for up to 180 days. Of 841 patients randomized in CASSINI, 62 developed VTE, with 24 occurring after treatment discontinuation.
The CASSINI study was performed in accordance with the principles of the Declaration of Helsinki and with local regulations. The study protocol was approved by an institutional review board at each trial site.
Biomarker substudy
In this substudy, a case-control design was used to compare blood samples from the 62 patients who developed VTE during the 6-month CASSINI study with 62 matched controls. Controls were matched for age, sex, cancer type, tumor stage, and Khorana score. Pretreatment, baseline blood samples were collected and analyzed for 280 biomarkers, including a mix of cytokines, chemokines, metabolic markers, hormones, and growth factors, using the Myriad Human DiscoveryMAP, version 3.3 (Myriad RBM, Austin, TX) (supplemental Table 1). Apolipoprotein E was missing in all samples, and assays with <10 unique values were not analyzed, leaving 252 biomarkers for analysis. Missing values were imputed using a K-nearest neighbor approach (with 10 neighbors), as implemented in the function impute.knn from the R package impute, version 1.60.15 Differences in the distribution of the biomarker values at baseline between the 2 groups defined by VTE occurrence were assessed using the Wilcoxon rank-sum test to determine the significance of the range of values from each other. No adjustment for multiple comparisons was performed. An additional analysis was performed for differences in biomarkers at baseline for the cancer patients who survived vs those who died during the study.
Sparse multipredictor Bayesian logistic regression modeling16 was separately applied to the VTE occurrence outcome and to the VTE/death composite outcome using inverse normal transformed17 biomarkers as predictors and the R package HTLR, version 0.4.3.16 The default hyper t with 1 degree of freedom prior was used with 40 000 Markov chain Monte-Carlo (MCMC) iterations. All biomarkers after inverse normal transformation with a P > .05 from a Shapiro-Wilk test of normality were considered in the regression modeling. Biomarkers with absolute mean posterior coefficients from the MCMC > 0.2 times the biomarker with the greatest absolute mean posterior coefficient were selected for inclusion in the final model (default threshold from the HTLR package). Selected biomarkers were characterized by their mean posterior coefficient and 90% posterior interval, as calculated using the MCMC_intervals_data function of the R bayesplot package.18 Pathway/gene set enrichment analysis of selected biomarkers was performed using the enrichR package19 interface to the EnrichR web service,20 with biomarkers mapped to their respective gene symbols using Myriad-provided UniProt IDs.
Results
Patient characteristics
Demographics and baseline clinical characteristics for all 124 patients and by subgroups based on VTE are provided in Table 1. More patients who had VTE had elevated platelet count (37.1%) compared with those who did not have VTE (33.9%). Fewer patients who had VTE had low hemoglobin (8.1%) compared with those who did not have VTE (12.9%). Khorana risk score categories were different by VTE status, with a higher proportion of VTE patients having a score of 3 and a smaller proportion having a score of 4 or more compared with non-VTE patients. Pancreatic cancer accounted for half of the population (n = 62), and 84 patients survived while 40 died (VTE: n = 27; control: n = 13) during the study.
Baseline demographics and clinical characteristics
| Characteristic | With VTE | Without VTE | All patients |
|---|---|---|---|
| (n = 62) | (n = 62) | (N = 124) | |
| Age, median (range), years | 67 (41, 85) | 66 (43, 82) | 67 (41, 85) |
| Male, n (%) | 28 (45.2) | 27 (43.5) | 55 (44.4) |
| Race, n (%) | |||
| White | 48 (77.4) | 48 (77.4) | 96 (77.4) |
| Black | 3 (4.8) | 5 (8.1) | 8 (6.5) |
| Asian | 1 (1.6) | 2 (3.2) | 3 (2.4) |
| Other | 2 (3.2) | 1 (1.6) | 3 (2.4) |
| Not reported | 8 (12.9) | 6 (9.7) | 14 (11.3) |
| Ethnicity, n (%) | |||
| Hispanic/Latino | 4 (6.5) | 7 (11.3) | 11 (8.9) |
| Not Hispanic/Latino | 49 (79.0) | 49 (79.0) | 98 (79.0) |
| Not reported/unknown | 9 (14.5) | 6 (9.7) | 15 (12.1) |
| BMI, median (range), kg/m2 | 24.40 (15.1, 40.7) | 26.20 (17.7, 49.1) | 24.95 (15.1, 49.1) |
| Creatinine clearance, median (range), mL/min | 87.00 (38.4, 184.8) | 90.00 (37.2, 265.8) | 88.80 (37.2, 265.8) |
| Khorana risk score categories, n (%) | |||
| Cancer | |||
| 2 - Very high-risk cancer | 40 (64.5) | 35 (56.5) | 75 (60.5) |
| 1 - High-risk cancer | 21 (33.9) | 25 (40.3) | 46 (37.1) |
| 1 - BMI >35 kg/m2 | 6 (9.7) | 10 (16.1) | 16 (12.9) |
| 1 - Platelet count >350 000/µL | 23 (37.1) | 21 (33.9) | 44 (35.5) |
| 1 - Hemoglobin <10 g/dL | 5 (8.1) | 8 (12.9) | 13 (10.5) |
| 1 - Leukocyte count >11 000/µL | 13 (21.0) | 15 (24.2) | 28 (22.6) |
| Total Khorana risk score, n (%) | |||
| <2 | 0 | 0 | 0 |
| 2 | 42 (67.7) | 43 (69.4) | 85 (68.5) |
| 3 | 17 (27.4) | 13 (21.0) | 30 (24.2) |
| 4 | 2 (3.2) | 6 (9.7) | 8 (6.5) |
| ≥5 | 1 (1.6) | 0 | 1 (0.8) |
| ECOG PS score | |||
| 0 | 16 (25.8) | 22 (35.5) | 38 (30.6) |
| 1 | 39 (62.9) | 33 (53.2) | 72 (58.1) |
| 2 | 7 (11.3) | 7 (11.3) | 14 (11.3) |
BMI, body mass index; ECOG PS, Eastern Cooperative Oncology Group performance status.
Biomarker identification
Eleven biomarkers had significantly (P < .05) different baseline distributions in cancer patients with VTE (n = 62) vs those without VTE (n = 62) (Table 2). Biomarkers with the largest difference in median values were stromal cell–derived factor-1 (SDF-1), growth hormone (GH), thyroid-stimulating hormone (TSH), monocyte chemotactic protein 4, IL-1 receptor type 1 (IL-1R1), pulmonary and activation-regulated chemokine, mast/stem cell growth factor receptor, and IL-16 (Figure 1). P-selectin values were not significantly different between patients with VTE (median, 85.0 ng/mL; range, 33.0-340.0 ng/mL) and without VTE (73.0 ng/mL; range, 36.0-197.0 ng/mL; P = .129).
Significant differences in baseline biomarkers based on occurrence of VTE in patients enrolled in CASSINI*
| Analyte | VTE | No VTE | P* |
|---|---|---|---|
| Median (range) [n] | Median (range) [n] | ||
| Stromal cell–derived factor-1, pg/mL | 2550.0 (162.0, 4340.0) [62] | 2890.0 (1220.0, 5640.0) [61] | .003 |
| Growth hormone, ng/mL | 1.6 (0.1, 16) [61] | 0.8 (0.1, 28) [61] | .006 |
| Thyroid-stimulating hormone, μIU/mL | 0.9 (0.02, 6.4) [61] | 1.5 (0.02, 15.0) [61] | .006 |
| Monocyte chemotactic protein 4, pg/mL | 145.0 (33.0, 473.0) [58] | 183.0 (33.0, 883.0) [59] | .017 |
| Interleukin-1 receptor type 1, pg/mL | 1940.0 (285.0, 3930.0) [62] | 1630.0 (175.0, 3470.0) [62] | .027 |
| Human epidermal growth factor receptor 2, ng/mL | 0.5 (0.2, 1.1) [61] | 0.4 (0.1, 3.6) [61] | .027 |
| Placenta growth factor, pg/mL | 32.5 (32.5, 123.0) [61] | 32.5 (32.5, 82.0) [61] | .035 |
| Pulmonary and activation-regulated chemokine, ng/mL | 157.5 (62.0, 849.0) [62] | 197.0 (51.0, 1090.0) [62] | .036 |
| Mast/stem cell growth factor receptor, ng/mL | 6.3 (2.8, 15.0) [59] | 7.4 (2.6, 15.0) [59] | .04 |
| Interleukin-16, pg/mL | 296.0 (129.0, 1120.0) [61] | 334.0 (135.0, 2200.0) [61] | .043 |
| Human chorionic gonadotropin β, mIU/mL | 2.2 (2.2, 279.0) [62] | 2.2 (2.2, 252.0) [62] | .045 |
Nonparametric test (Wilcoxon rank sum), unadjusted for multiple comparisons. The Wilcoxon rank sum test used here is comparing the 2 distributions (and not the 2 median values shown in the table).
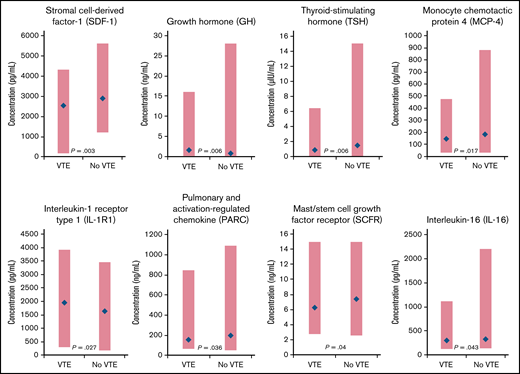
Biomarkers with significantly different distributions (red bar) and largest differences between median values (blue diamond) at baseline for cancer patients enrolled in CASSINI with subsequent VTE vs those without VTE.P determined from a Wilcoxon rank-sum test, unadjusted for multiple comparisons, comparing the 2 distributions.
Biomarkers with significantly different distributions (red bar) and largest differences between median values (blue diamond) at baseline for cancer patients enrolled in CASSINI with subsequent VTE vs those without VTE.P determined from a Wilcoxon rank-sum test, unadjusted for multiple comparisons, comparing the 2 distributions.
Comparing patients who survived with those who died, 12 biomarkers had significantly different distributions at baseline (supplemental Table 2). The biomarkers with the largest differences in median values included the protein ST2 (encoded by the IL-1 receptor-like 1 gene),21 macrophage inflammatory protein-3 α (MIP-3 α), tenascin-C, tumor necrosis factor (TNF) ligand superfamily member 12 (Tweak), eotaxin-1, IL-8, and CRP (Figure 2). The tumor-specific biomarkers, cancer antigen (CA19-9), and carcinoembryonic antigen (CEA) were significantly elevated for patients who died compared with those who survived (median [range]: CA19-9: 300.0 [1.7, 3060.0] vs 39.5 [1.7, 3800.0]; P = .006 and CEA: 5.0 [0.3, 297.0] vs 2.4 [0.3, 358.0]; P = .041).
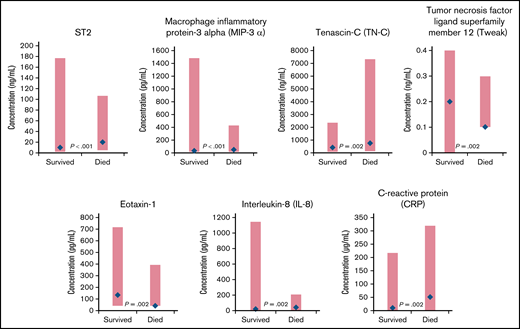
Biomarkers with significantly different distributions (red bar) and largest differences between median values (blue diamond) at baseline for cancer patients who survived vs those who died during the CASSINI study.P determined from a Wilcoxon rank-sum test, unadjusted for multiple comparisons, comparing the 2 distributions.
Biomarkers with significantly different distributions (red bar) and largest differences between median values (blue diamond) at baseline for cancer patients who survived vs those who died during the CASSINI study.P determined from a Wilcoxon rank-sum test, unadjusted for multiple comparisons, comparing the 2 distributions.
Given the large population of patients with pancreatic cancer, we compared biomarkers by cancer type (pancreatic vs other cancer types) (supplemental Table 3). The most significant factors by cancer type were CA19-9, VEGF D, α-1-acid glycoprotein 1, and HE4. Only a few of the biomarkers identified as significant predictors of VTE were significant for the pancreatic cancer population: human epidermal growth factor receptor 2 (P = .014), human chorionic gonadotropin β (P = .025), thyroid-stimulating hormone (P = .054), and mast/stem cell growth factor receptor (P = .07).
From the Bayesian sparse regression modeling of VTE occurrence, 16 biomarkers were jointly selected from the 213 considered (Table 3), with SDF-1 and TSH having the largest absolute mean posterior regression coefficient. Eight of these showed some association in Table 2, including 7 of the top 8 (ranked by absolute mean posterior coefficient). These 16 biomarkers showed some correlations with each other across the entire cohort (Figure 3). Pathway analysis of the selected biomarkers indicated enrichment of multiple gene sets/pathways (Table 4), including cytokine-cytokine receptor interaction, cytokine activity, and chemokine activity. Predictions from the model were 86% correct for those predicted to not develop VTE (54 of 63) and 87% correct for those predicted to develop VTE (53 of 61). For the composite outcome of VTE or death, 25 biomarkers were selected in the sparse regression analyses (supplemental Table 4), with 7 also selected in the VTE-only model, including the 3 strongest for VTE or death: IL-1R1, SDF-1, and GH.
Bayesian sparse logistic regression coefficient estimates and 90% posterior intervals for VTE outcome
| Biomarker | HGNC | Point estimate | Lower 90% PI | Upper 90% PI |
|---|---|---|---|---|
| Stromal cell–derived factor-1 (SDF-1) | CXCL12 | −0.2437 | −0.9260 | 0.0148 |
| Thyroid-stimulating hormone (TSH) | TSHB | −0.1796 | −0.8036 | 0.0146 |
| Monocyte chemotactic protein 4 (MCP-4) | CCL13 | −0.1182 | −0.7075 | 0.0208 |
| Interferon-inducible T-cell α chemoattractant (ITAC) | CXCL11 | 0.1013 | −0.0234 | 0.7182 |
| Growth hormone (GH) | GH1 | 0.0968 | −0.0203 | 0.5867 |
| Human epidermal growth factor receptor 2 (HER-2) | ERBB2 | 0.0436 | −0.0255 | 0.3507 |
| Interleukin-1 receptor type 1 (IL-1R1) | IL1R1 | 0.0342 | −0.0279 | 0.2484 |
| Pulmonary and activation-regulated chemokine (PARC) | CCL18 | −0.0341 | −0.2519 | 0.0270 |
| Myoglobin | MB | 0.0326 | −0.0278 | 0.2424 |
| MHC class I chain-related protein A (MICA) | MICA | 0.0321 | −0.0305 | 0.2226 |
| Human chorionic gonadotropin β (hCG) | CGB3 | 0.0315 | −0.0267 | 0.2269 |
| Folate receptor γ (FOLR3) | FOLR3 | 0.0294 | −0.0280 | 0.2024 |
| Heparin-binding EGF-like growth factor (HB-EGF) | HBEGF | 0.0290 | −0.0289 | 0.1978 |
| Superoxide dismutase 1, soluble (SOD-1) | SOD1 | 0.0283 | −0.0256 | 0.1947 |
| Carbonic anhydrase 9 (CA-9) | CA-9 | 0.0259 | −0.0245 | 0.1789 |
| Granulocyte colony-stimulating factor (G-CSF) | CSF3 | −0.0257 | −0.1770 | 0.0299 |
HGNC, human gene symbol; point estimate, mean posterior estimate of inverse normal transformed and standardized biomarker lower and upper 90% PIs for regression coefficient from the Markov chain Monte-Carlo; EGF, epidermal growth factor; MHC, major histocompatibility complex; PI, posterior interval.
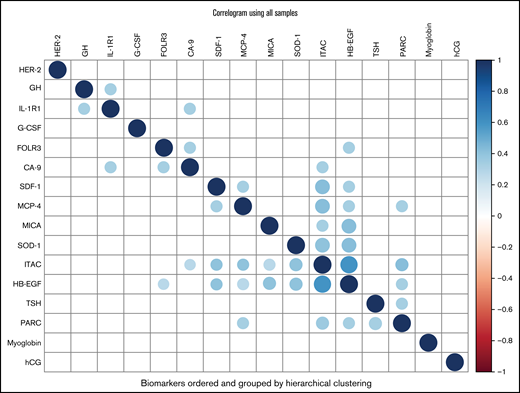
Correlogram of biomarkers. Color corresponds to Pearson correlation value between biomarkers (after inverse normal transformation) as indicated in the color scale on the right (–1 to 1), with darker blue indicating stronger positive correlation (diagonals are darkest blue indicating correlation of 1 by definition) and darker red indicating stronger negative correlation. Only correlations with P < .01 are plotted. Biomarkers are ordered by hierarchical clustering using Ward’s D2 metric. The plot was constructed using the corrplot function from the R package corrplot. CA-9 indicates carbonic anhydrase 9; FOLR3, folate receptor γ; G-CSF, granulocyte colony-stimulating factor; GH, growth hormone; HB-EGF, heparin-binding EGF-like growth factor; hCG, human chorionic gonadotropin β; HER-2, human epidermal growth factor receptor 2; IL-1R1, interleukin-1 receptor type 1; ITAC, interferon-inducible T-cell α chemoattractant; MCP-4, monocyte chemotactic protein 4; MICA, MHC class I chain-related protein A; PARC, pulmonary and activation-regulated chemokine; SDF-1, stromal cell-derived factor-1; SOD-1, superoxide dismutase 1, soluble; TSH, thyroid-stimulating hormone.
Correlogram of biomarkers. Color corresponds to Pearson correlation value between biomarkers (after inverse normal transformation) as indicated in the color scale on the right (–1 to 1), with darker blue indicating stronger positive correlation (diagonals are darkest blue indicating correlation of 1 by definition) and darker red indicating stronger negative correlation. Only correlations with P < .01 are plotted. Biomarkers are ordered by hierarchical clustering using Ward’s D2 metric. The plot was constructed using the corrplot function from the R package corrplot. CA-9 indicates carbonic anhydrase 9; FOLR3, folate receptor γ; G-CSF, granulocyte colony-stimulating factor; GH, growth hormone; HB-EGF, heparin-binding EGF-like growth factor; hCG, human chorionic gonadotropin β; HER-2, human epidermal growth factor receptor 2; IL-1R1, interleukin-1 receptor type 1; ITAC, interferon-inducible T-cell α chemoattractant; MCP-4, monocyte chemotactic protein 4; MICA, MHC class I chain-related protein A; PARC, pulmonary and activation-regulated chemokine; SDF-1, stromal cell-derived factor-1; SOD-1, superoxide dismutase 1, soluble; TSH, thyroid-stimulating hormone.
Enrichment analysis of biomarkers inTable 3
| Source | Term | Overlap | Genes | Q |
|---|---|---|---|---|
| KEGG_2019_Human | Cytokine-cytokine receptor interaction | 7/294 | CCL13;GH1;CSF3;CXCL11;CXCL12;IL1R1;CCL18 | 7.9e-08 |
| GeneSigDB | 20460173-ImmPortCytokines | 8/444 | CCL13;GH1;CSF3;CXCL11;CXCL12;CCL18;TSHB;HBEGF | 1.89e-07 |
| GO_Molecular_Function_2018 | Chemokine activity (GO:0008009) | 4/46 | CCL13;CXCL11;CXCL12;CCL18 | 1.16e-06 |
| GO_Molecular_Function_2018 | Chemokine receptor binding (GO:0042379) | 4/49 | CCL13;CXCL11;CXCL12;CCL18 | 1.16e-06 |
| GO_Molecular_Function_2018 | Cytokine activity (GO:0005125) | 5/155 | CCL13;CSF3;CXCL11;CXCL12;CCL18 | 1.46e-06 |
| GO_Biological_Process_2018 | Chemokine-mediated signaling pathway (GO:0070098) | 4/52 | CCL13;CXCL11;CXCL12;CCL18 | 2.17e-05 |
| GO_Biological_Process_2018 | Cytokine-mediated signaling pathway (GO:0019221) | 7/633 | CCL13;CSF3;CXCL11;CXCL12;IL1R1;CCL18;SOD1 | 4.12e-05 |
| Elsevier_Pathway_Collection | Proteins involved in atherosclerosis | 5/200 | GH1;CSF3;CXCL11;CXCL12;HBEGF | 0.000103 |
| GeneSigDB | 20460173-ImmPortChemokines | 4/97 | CCL13;CXCL11;CXCL12;CCL18 | 0.00014 |
| Elsevier_Pathway_Collection | Proteins involved in myocardial ischemia | 5/252 | GH1;CSF3;CXCL12;MB;SOD1 | 0.000161 |
| EnrichR_Users_Contributed_Lists_2020 | Secretome from protein atlas | 11/2640 | CCL13;GH1;CSF3;CXCL11;CXCL12;IL1R1;CGB3; FOLR3;CCL18;TSHB;HBEGF | 0.000206 |
| GO_Molecular_Function_2018 | Growth factor activity (GO:0008083) | 3/69 | GH1;CSF3;HBEGF | 0.000218 |
| GO_Molecular_Function_2018 | Hormone activity (GO:0005179) | 3/83 | GH1;CGB3;TSHB | 0.000304 |
| GO_Molecular_Function_2018 | Growth factor receptor binding (GO:0070851) | 3/92 | CSF3;IL1R1;HBEGF | 0.000345 |
| MSigDB_Hallmark_2020 | Inflammatory response | 4/200 | CSF3;CXCL11;IL1R1;HBEGF | 0.000354 |
| KEGG_2019_Human | Chemokine signaling pathway | 4/190 | CCL13;CXCL11;CXCL12;CCL18 | 0.000368 |
| GO_Molecular_Function_2018 | CXCR chemokine receptor binding (GO:0045236) | 2/17 | CXCL11;CXCL12 | 0.000475 |
| GO_Biological_Process_2018 | Lymphocyte chemotaxis (GO:0048247) | 3/44 | CCL13;CXCL11;CCL18 | 0.000545 |
| GO_Molecular_Function_2018 | Cytokine receptor binding (GO:0005126) | 3/137 | GH1;CSF3;CXCL12 | 0.000845 |
| Elsevier_Pathway_Collection | Proteins involved in diabetic nephropathy | 4/175 | GH1;CXCL12;SOD1;HBEGF | 0.000855 |
Discussion
In this substudy of CASSINI, 2 methods of analyzing potential biomarkers associated with VTE in cancer patients were performed. Significant differences in baseline distribution of biomarkers were most notable for SDF-1 and TSH. Among patients who died, several inflammatory biomarkers were associated with large and significant differences in median values. These included ST2, which is associated with heart failure and cardiac fibrosis21 and encoded by an IL-1 receptor family gene. IL-1R1 was significantly elevated in cancer patients who developed VTE compared with those who did not develop VTE. IL-1, the model proinflammatory cytokine, binds to IL-1R1 and leads to the expression of many inflammatory genes.22 CRP and MIP-3 α levels were elevated in patients who died during the study, and levels of the proinflammatory cytokine IL-8 showed a larger distribution among survivors but had a higher median value among those who died. However, IL-6 was not significantly different in either subgroup of patients based on survival or VTE occurrence, in contrast to prior reports.23,24
Results of the logistic regression and pathway analysis were supportive and complementary of these initial findings. SDF-1 and TSH remained the strongest predictors of VTE, and the majority of biomarkers identified in the distribution analysis were confirmed with logistic regression. In addition, the biomarkers showed some correlations with each other. Models based on pathway analysis of cytokine and chemokine activity were more than 85% effective in predicting VTE outcome. Additional biomarkers were identified in the regression analysis of VTE or death, but the 3 strongest biomarkers were consistent with initial findings in this cohort: IL-1R1, SDF-1, and GH.
Many factors and overlapping pathways are believed to contribute to cancer-associated VTE.11 Cancer induces a procoagulant state through various mechanisms related to tumor cells as well as the various types of cancer therapy. Inflammatory cytokines are released as part of the immune response that leads to tumor initiation and progression as well as in response to therapy-induced cellular damage and infection.10,25 Monocytes and endothelial cells express tissue factor, which is activated by inflammatory cytokines released from tumors.10 Expression of tissue factor is also induced by P-selectin, a key player in thrombogenesis that leads to a prothrombic state, and by CRP. Tissue factor is the primary initiator of the extrinsic coagulation cascade and increases fibrin deposition in close proximity to mononuclear cells in the tumor stroma.10,26 Exposure to inflammatory cytokines increases the amount of tissue factor available to participate in coagulation and also increases the production of tissue factor microparticles, which have been linked to VTE in patients with pancreatic cancer, particularly those with nonresectable metastatic and poorly differentiated adenocarcinomas.27 However, in addition to tissue factor, many other procoagulant and antifibrinolytic activities may be stimulated by inflammatory cytokines, including the formation of neutrophil extracellular traps, complement activation, and PAI-1 expression.
A prior study has shown that plasma levels of proinflammatory factors IL-1, TNFα, and serum amyloid A protein were significantly elevated in patients diagnosed with VTE compared with a control group of age- and sex-matched healthy subjects.28 Subsequent work by the same group identified a mutation in IL-1 that is associated with mortality due to VTE.29 In addition, ST2 was significantly elevated in VTE patients and appears to be an indicator of inflammatory, immune, and cardiovascular diseases. As was seen in our analysis of VTE among cancer patients, there was no difference in IL-6 between VTE and non-VTE groups.
The roles of TSH and GH in VTE risk are incompletely understood. Elevated levels of TSH have been reported in patients with VTE, which may be associated with effects of thyroid dysfunction on the hemostatic system.30,31 However, TSH levels had wide confidence intervals, and another study showed no association between TSH and VTE.32 The GH axis has been linked with cancer progression.33 Despite a broader distribution, the median value of GH in cancer patients with VTE was twice that of cancer patients without VTE. This finding may be consistent with the occurrence of VTE in cancer patients who have more advanced disease with distant metastasis.1 Interactions between the various biologic processes involved in cancer initiation and progression and hypercoagulability are complex and multifactorial. The pathway analysis showed enrichment for cytokine and chemokine activity, suggesting greater activity of inflammatory markers for VTE in cancer patients. Our findings support validation of these biomarkers in other populations, use of them in predictive models, and research exploring the causal pathways.
This comprehensive subanalysis of the CASSINI study had several limitations. Biomarker levels were analyzed at baseline, and there was no assessment of longitudinal changes in biomarker levels.11 The results were not adjusted for multiple comparisons, leading to a risk of false-positive findings. As VTE risk varies by cancer type, the inclusion of patients with various cancer types, both lymphoma and solid tumors, may have confounded the identification of specific biomarkers associated with VTE in patients with particular cancers. For example, the platelet activator podoplanin has been identified as a biomarker of VTE in brain tumor patients.34,35 In addition, multivariate analysis may have limited the predictive ability of biomarkers. As observed in an analysis of CATS, CRP levels were predictive of VTE in a univariate analysis with an HR of 1.2 per doubling but, in a multivariate analysis including chemotherapy, surgery, radiotherapy, metastasis, and P-selectin, CRP was no longer significantly associated with VTE.36 Another confounding factor may include the type of systemic therapy administered to cancer patients.37
The goal of risk stratification models is to personalize thromboprophylaxis to achieve the greatest risk reduction in thromboembolism while avoiding bleeding complications, particularly in patients at lower risk of VTE. The identification of biomarkers predictive of VTE in cancer patients will further optimize risk stratification models. Additional studies to prospectively validate candidate biomarkers and biomarker signatures would be of significant clinical relevance and utility.
Acknowledgments
This study was funded by Janssen and Bayer (ClinicalTrials.gov identifier, NCT02555878). A.A.K. acknowledges additional research support from the Sondra and Stephen Hardis Chair in Oncology Research and the Porter Family Fund. A.A.K., K.R.M., and J.B. are supported by the Consortium Linking Oncology with Thrombosis (CLOT), funded by the National Heart, Lung, and Blood Institute (U01HL143402). Medical writing support was provided by Michelle McDermott of Cello Health Communications/MedErgy (Yardley, PA).
Authorship
Contribution: A.A.K. participated in the conception of the study; A.A.K., T.W., and K.R.M. conducted the study; J.B., U.V., and C.V.D. performed the statistical analyses; and A.A.K., J.B. T.W., U.V., C.V.D., K.T.M., P.W., and K.R.M. participated in data interpretation and manuscript development and provided final approval of the submitted manuscript.
Conflict-of-interest disclosures: A.A.K. reports receiving personal fees for serving as cochair of the steering committee for CASSINI and nonfinancial support for travel from Janssen during the conduct of the study; personal fees and nonfinancial support for travel from Bayer, Sanofi, Parexel, Janssen, Halozyme, Pfizer, Bristol Myers Squibb, Leo Pharma, Medscape/WebMD, and Seattle Genetics; personal fees from Pharmacyclics, Pharmacyte, Anthos, Nektar, and TriSalus; and grants to his institution from Merck, Array, Bristol Myers Squibb, and Leap Pharma, outside the submitted work. A.A.K. was also the National Coordinator of the MARINER trial for Janssen. T.W. has served on steering committees for Janssen and Pfizer. K.R.M. has served on advisory boards for Dova Pharmaceuticals, Pfizer, Rigel Pharmaceuticals, and Sanofi. U.V., C.V.D., K.T.M., and P.W. are full-time employees of Janssen Scientific Affairs, LLC and own stock in Johnson & Johnson. J.B. has nothing to disclose.
Correspondence: Alok A. Khorana, Department of Hematology and Medical Oncology, Cleveland Clinic, 10201 Carnegie Avenue, CA60, Cleveland, OH 44106, e-mail: Khorana@ccf.org.

