

Key Points
FlowCT is a new computational workspace for unveiling cellular diversity and objectively identifying biomarkers in large immune monitoring studies.
FlowCT identified T-cell biomarkers predictive of malignant transformation and survival in SMM and active MM data sets.

Abstract
Large-scale immune monitoring is becoming routinely used in clinical trials to identify determinants of treatment responsiveness, particularly to immunotherapies. Flow cytometry remains one of the most versatile and high throughput approaches for single-cell analysis; however, manual interpretation of multidimensional data poses a challenge when attempting to capture full cellular diversity and provide reproducible results. We present FlowCT, a semi-automated workspace empowered to analyze large data sets. It includes pre-processing, normalization, multiple dimensionality reduction techniques, automated clustering, and predictive modeling tools. As a proof of concept, we used FlowCT to compare the T-cell compartment in bone marrow (BM) with peripheral blood (PB) from patients with smoldering multiple myeloma (SMM), identify minimally invasive immune biomarkers of progression from smoldering to active MM, define prognostic T-cell subsets in the BM of patients with active MM after treatment intensification, and assess the longitudinal effect of maintenance therapy in BM T cells. A total of 354 samples were analyzed and immune signatures predictive of malignant transformation were identified in 150 patients with SMM (hazard ratio [HR], 1.7; P < .001). We also determined progression-free survival (HR, 4.09; P < .0001) and overall survival (HR, 3.12; P = .047) in 100 patients with active MM. New data also emerged about stem cell memory T cells, the concordance between immune profiles in BM and PB, and the immunomodulatory effect of maintenance therapy. FlowCT is a new open-source computational approach that can be readily implemented by research laboratories to perform quality control, analyze high-dimensional data, unveil cellular diversity, and objectively identify biomarkers in large immune monitoring studies. These trials were registered at www.clinicaltrials.gov as #NCT01916252 and #NCT02406144.
Introduction
The promising results of novel immunotherapies for the treatment of solid and hematologic malignancies1-4 have boosted efforts to characterize the immune escape that underlies tumor progression and determine immune responsiveness to treatment.5-13 Ideally, dissecting the relationship between immune states and tumor depletion will accelerate the development of more effective immunotherapies.14 Accordingly, comprehensive studies that profile multiple cell types at different time points are frequently included in clinical trials with the aim of developing large immune data sets integrated with the features, treatment, and outcome of patients. This is mandatory for discovering biomarkers and for risk stratification toward precision immunotherapy.
Flow cytometry is commonly used for immune monitoring because of its ability to rapidly measure multiple parameters with high accuracy and single-cell resolution, low operating costs, and wide availability. Furthermore, technological advances in flow cytometry led to an increasing number of parameters being measured simultaneously in millions of single cells.15 However, fast-growing high-dimensional data continue to be manually analyzed through traditional inspection of 2-dimensional biaxial plots and the sequential application of Boolean gates, which are hand-drawn on the basis of the distribution of marker intensity of individual cells.16 In theory, this may lead to subjective and potentially biased results with low reproducibility; in practice, such time- and labor-consuming analyses are almost unfeasible in large data sets. Thus, there is an unmet need for novel computational tools for immune monitoring using flow cytometry.
Computational flow cytometry uses a data-driven approach to analyze, visualize, and interpret data in a more automated, reproducible, and unbiased way when compared with manual analysis.15-17 A few software tools were developed in recent years to perform quality control, visualize, or analyze large high-dimensional flow cytometry data sets.18-24 However, computational frameworks with good flexibility and scalability for analyzing multiple batches of high-dimensional immunophenotypic studies are scarce.25,26 Thus, there is a need to develop workspaces with all of the tools required for complete processing of large data sets27,28 ; the workspaces should be user friendly for flow cytometry users who have limited training in bioinformatics, and they should be open-source for easy adoption.
Here we present FlowCT, an all-in-one workspace empowered to process large flow cytometry data sets that include high numbers of cells and parameters in multiple samples from large cohorts. The workflow includes data pre-processing and normalization, automated clustering, dimensionality reduction, and predictive modeling coupled with statistical tools; in addition, our framework facilitates the incorporation of single-cell tools developed for other omics (eg, Seurat and Monocle). As a proof of concept, we used FlowCT to address 4 research questions in multiple myeloma (MM) and T-cell biology. We deliberately selected MM because of the growing interest in immune monitoring of premalignant stages to understand, predict, and overcome disease progression,29,30 for profiling patients’ immune status to identify determinants of response and resistance to therapies, and for defining posttreatment signatures of immune surveillance.31
Patients and methods
Patients and samples
A total of 354 samples from 250 patients were included in this study. There were 164 peripheral blood (PB) and 10 bone marrow (BM) specimens from 150 patients with smoldering MM (SMM), as well as 180 BM aspirates from 100 patients with active MM. These cohorts were selected to evaluate the performance of FlowCT while addressing a specific research question. Thus, paired BM and PB samples from 10 patients with SMM were analyzed to objectively compare T-cell distribution in both specimens. PB samples from 150 patients with SMM were analyzed for discovery of immune biomarkers associated with disease progression. PB samples from 14 patients were profiled to compare the distribution of T-cell subsets at baseline and the moment of progression. BM specimens from 100 patients with MM collected before maintenance were mined to impartially identify immune signatures predictive of outcome. A total of 120 BM aspirates from 40 patients with MM collected at the beginning of and after 1 and 2 years of maintenance therapy were selected to analyze multiple batches of experiments performed at different time points, while determining the effect of prolonged immune modulation on T cells.
Median time between diagnosis and immune profiling of patients with SMM was 20 months. Patients with active MM were treated according to the GEM2012MENOS65 and GEM2014MAIN clinical trials.32,33 The first trial included 6 induction cycles of bortezomib, lenalidomide, and dexamethasone (VRD), autologous transplantation, and 2 consolidation cycles of VRD. Afterward, patients were enrolled in the GEM2014MAIN clinical trial, which randomly assigned maintenance therapy with lenalidomide and dexamethasone (RD) or RD with ixazomib for 2 years, after which patients continued maintenance with RD for 3 additional years if they were minimal residual disease (MRD) positive or stopped maintenance if they were MRD negative. Each study site’s independent ethics committee approved the protocol and informed consent forms, which were required before patients could enroll. Studies were conducted per the ethical principles of the Declaration of Helsinki.
Multidimensional flow cytometry immunophenotyping
Samples were collected in tubes containing EDTA and were processed within 24 hours after the EuroFlow lyse-wash-and-stain protocol (adjusted to 106 nucleated cells).34 Detailed information about monoclonal antibodies (mAbs) per combination (Tubes) used in this study is provided in supplemental Table 1. Paired BM and PB specimens from 10 patients with SMM were stained with a mAb combination designed to characterize the polarization of CD4 T cells (Tube 1). PB samples from 150 patients with SMM were analyzed with another mAb combination to evaluate the expression of activation molecules and checkpoint inhibitors in multiple T-cell subsets (Tube 2). Then, 180 BM aspirates from 100 patients with MM collected before and during maintenance were profiled with a combination of markers to characterize T-cell subsets (Tube 3). Data acquisition of 8-color mAb combinations was performed in a FACSCanto II flow cytometer using FACSDiva 8.0.1 software (both from Becton Dickinson Biosciences, San Jose, CA). Data acquisition of 8 and 17 markers (Tubes 4 and 5) was performed in a CytoFlex LX flow cytometer using CytExpert software (both from Beckman Coulter Life Sciences, Indianapolis, IN). Data acquisition of a 24-mAb combination (Tube 6) was performed by using an Aurora flow cytometer and SpectroFlo software (both from Cytek Biosciences, Fremont, CA).
Fluorescence-activated cell sorting
Ten different T-cell subsets were sorted from PB samples from 3 healthy adults, processed immediately after collection by using a FACSAria II flow cytometer (Becton Dickinson Biosciences) and a combination of 8 mAbs (CD27-BV421, CD4-BV510, CD45RA-fluorescein isothiocyanate [FITC], CXCR3-phycoerythrin [PE], CD8-peridinin chlorophyll protein complex Cy5.5 (PerCPCy5.5), CCR4-PECy7, CCR6-allophycocyanin [APC], and CD197-APC-H7). Each subset was defined by its singular immunophenotypic profile determined by FlowCT. Approximately 30 000 isolated cells per subset were collected in 100 µL of lysis/binding buffer (Thermo Fisher Scientific, Waltham, MA) and immediately processed for RNA sequencing (RNA-seq).
RNA-seq
RNA-seq was performed after massively parallel single-cell RNA-seq (MARS-seq) protocol with minor modifications adapted for measuring RNA expression in bulk cells.10 Poly-A RNA was reverse transcribed using poly-dT oligos carrying a 7-bp index. Pooled samples were subjected to linear amplification by in vitro transcription. The resulting RNA was fragmented and dephosphorylated. Ligation of partial Illumina adaptor sequences was followed by a second reverse transcriptase reaction. Full Illumina adaptor sequences were added during final library amplification. Quantification of RNA-seq libraries was performed with a Qubit 3.0 Fluorometer (Life Technologies, Carlsbad, CA) and size profiles were examined with a 4200 TapeStation System (Agilent Technologies, Santa Clara, CA). Libraries were sequenced in an Illumina NextSeq 500 (Illumina, San Diego, CA) at a depth of 10 million reads per sample.
Data analysis and system requirements
Immunophenotypic data were analyzed using R version 4.0.0 software. All phases of the workflow were performed on laptops equipped with an i7 8565u central processing unit and 16 GB DDR4 random access memory, except the analysis of 150 patients with SMM and 100 patients with MM that was run on an x86_64-redhat-linux-gnu platform (under CentOS Linux 7 [Core]). When indicated, other flow cytometry software was used (Infinicyt v2.0; Cytognos SL, Salamanca, Spain). FlowCT can be installed from GitHub and a detailed tutorial is available at https://github.com/paiva-s-lab/FlowCT/blob/main/tutorial.md. Table 1 describes the algorithms embedded in FlowCT and a list of the main software packages included in FlowCT is available in supplemental Table 2. Those interested in using FlowCT should have a basic knowledge of R software to understand and use its script, which is described in the tutorial. A brief description of the FlowCT workflow is provided in the supplemental Material.
Main functions embedded in FlowCT and their application
| Embedded functions | Utility | |
|---|---|---|
| Quality control | ||
| flowAI | flow_auto_qc | Removes low-quality events by evaluating flow rate, signal acquisition, and dynamic range. |
| Marker normalization | ||
| flowStats | gaussNorm & warpSet | Normalizes flow cytometry data sets by aligning high-density regions (ie, landmarks or peaks) for each channel. |
| Seurat | SelectIntegrationFeatures & IntegrateData | Identifies anchors between pairs of data sets and uses them to remove confounding factors. |
| harmony | HarmonyMatrix | Corrects batch effects through a maximum diversity algorithm (ie, soft k-means) and a mixture model–based linear correction. |
| Automatic clustering | ||
| FlowSOM | BuildSOM & ConsensusClusterPlus | Creates clusters from flow cytometry data sets based on self-organizing map (SOM) and minimal spanning trees (MSTs). |
| PARC | PARC | Identifies single-cell clusters through a combination of graph-based clustering and pruning, coupled with the Leiden community-detection algorithm. |
| Rphenograph | Rphenograph | Clusters single cells by using the Louvain method based on a previous phenotypically defined graph. |
| Seurat | FindNeighbors & FindClusters | Finds single-cell communities based on k-nearest neighbor (KNN) graphs and clustering via Louvain or smart local moving (SLM) algorithms. |
| Dimensionality reduction | ||
| Rtsne | Rtsne | Calculates t-distributed stochastic neighbor embedding (t-SNE). |
| uwot | tumap | Calculates uniform manifold approximation and projection (UMAP). |
| densvis | densmap & densne | Produces lower-dimensional embeddings (t-SNE- and UMAP-based) preserving the density of cells. |
| Machine learning | ||
| biosigner | biosign | Features selection by running partial least squares-discriminant analysis (PLS-DA), random forest, and support vector machine (SVM) simultaneously (all methods as binary classifiers). |
| randomForestSRC | rfsrc | Selects immune populations based on random forest building and incorporates survival information. |
| SurvBoost | boosting_core | Detects more relevant populations through gradient boosting algorithm and includes survival data. |
Statistical analyses were performed using FlowCT. The Mann-Whitney and Kruskall-Wallis nonparametric tests were used to compare differences between groups. Time to progression (TTP), progression-free survival (PFS), and overall survival (OS) were estimated using the Kaplan-Meier method, and differences were tested for statistical significance with the (two-sided) log-rank test. TTP was defined as the time from immunophenotyping until the date of disease progression to active MM; patients not known to have progressed at last follow-up were censored on the date they were last examined. PFS was defined as the time from immunophenotyping until disease progression or death as a result of any cause. OS was defined as the time from immunophenotyping until death as a result of any cause; patients not known to have progressed or died at last follow-up were censored on the date they were last examined.
RNA-seq data were analyzed as described elsewere.10 Briefly, raw sequencing data were demultiplexed using bcl2fastq software (version 2.20.0; Illumina) and aligned to the GRCh37 human genome using STAR35 aligner (version 2.6.1c). Matrixes with gene counts were generated with quant3p (a wrapper based on HTSeq36 dynamics). Analysis of differentially expressed genes was performed using DESeq237 and DEGreports38 R packages available in version 3.5.1. A likelihood-ratio test was used to select genes differentially expressed across all cell types identified by using FlowCT (Bonferroni-adjusted P < .01), which were then used to perform a supervised hierarchical clustering of different samples.
Results
T-cell distribution in paired PB and BM samples
It is expected that monitoring tumor immune surveillance and escape could help identify patients with SMM at risk of malignant transformation.39 In this case, it would be desirable if immune monitoring could be performed periodically in PB samples as opposed to a (single) BM aspirate analyzed at diagnosis. However, it is currently unknown whether the immune composition in PB mirrors the one found in the tumor microenvironment. So we used FlowCT to perform a holistic and objective comparison of the T-cell compartment in paired PB and BM specimens from patients with SMM (n = 10). We also selected this example for a stepwise detailed explanation of its workflow in the online tutorial.
After quality control using flowAI23 to remove outliers, margin events, and doublets (supplemental Figure 2), automated clustering was performed by using self-organized maps (FlowSOM) (supplemental Figure 3A-B). At this stage, cluster annotation can be achieved by visualizing expression levels of each marker on uniform manifold approximation and projection (UMAP) (supplemental Figure 3C) and on 2-dimensional biaxial plots using either FlowCT (supplemental Figure 3D) or standard flow cytometry software on saved flow cytometry standard (FCS) files (supplemental Figure 4). Lymphocytes were selected for downstream subclustering after supervised annotation (Figure 1A). Batch effect was removed with canonical correlation analysis (supplemental Figure 5) and lymphocytes were subclustered using phenotyping by accelerated refined community partitioning (PARC). Automated clustering identified 25 subsets (Figure 1B; supplemental Figure 6), and a significant correlation between PB and BM was observed in 20 of the 25 subsets (Figure 1C). Conversely, the percentage of CD4 central memory (CM) T cells (CD4 CM CCR4+CXCR3+, CD4 CM CCR6+, CD4 CM Th17) and CD4 stem cell memory (SCM) T cells (CD4 SCM CCR4+) was significantly higher in PB than in BM, whereas a natural killer cell subset without CD8 expression was significantly reduced (Figure 1D; supplemental Figure 7A-B). Significant correlations within PB and BM subsets were observed and could potentially be related to antigen-dependent differentiation of CD4 and CD8 T cells (supplemental Figure 8).
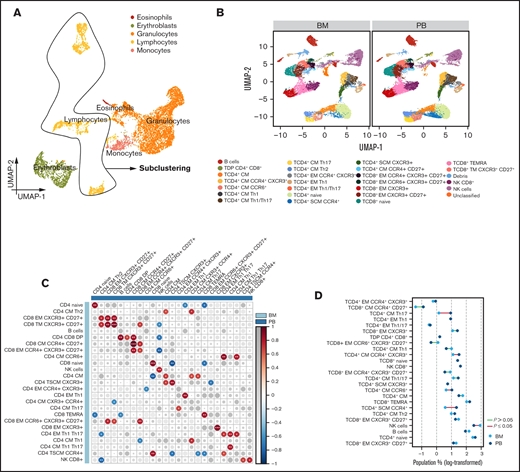
T-cell distribution in paired BM and PB samples. (A) UMAP of eosinophils, erythroblasts, granulocytes, lymphocytes, and monocytes. (B) UMAP of 25 lymphocyte subsets identified in BM and PB samples from patients with SMM (n = 10). (C) Correlation map comparing the frequency of each lymphocyte subset in BM to the subsets in PB. Size and color of circles are proportional to the correlation coefficients, and the number of asterisks represents significance. *< .05; **< .01; ***< .001. (D) Dumbbell plot reporting lymphocyte subset distribution between BM and PB (statistically significant differences are identified by red lines).
T-cell distribution in paired BM and PB samples. (A) UMAP of eosinophils, erythroblasts, granulocytes, lymphocytes, and monocytes. (B) UMAP of 25 lymphocyte subsets identified in BM and PB samples from patients with SMM (n = 10). (C) Correlation map comparing the frequency of each lymphocyte subset in BM to the subsets in PB. Size and color of circles are proportional to the correlation coefficients, and the number of asterisks represents significance. *< .05; **< .01; ***< .001. (D) Dumbbell plot reporting lymphocyte subset distribution between BM and PB (statistically significant differences are identified by red lines).
Automated clustering using PARC uncovered the presence of 13 CD4 T-cell clusters, including 2 CD4 TSCM subsets with (potentially) divergent polarization based on differential expression of CCR4 and CXCR3 (Figure 2A). To assess whether these unique phenotypic clusters were linked to well-defined transcriptional states and were not an artifact of computational flow cytometry, we isolated 10 subsets associated with the transition from CD4 naïve to CD4 CM cells from PB samples of 3 healthy adults (to avoid confounding factors associated with cancer or treatment in patients) and performed RNA-seq (Figure 2A-B). There was identical clustering according to gene expression profiles of the 10 CD4 T-cell subsets defined on phenotypic grounds, including the 2 CD4 TSCM clusters identified by differential expression of CCR4 and CXCR3 (Figure 2C). Thus, while performing an objective comparison of lymphocyte distribution in the PB and BM of patients with SMM, FlowCT enabled the identification of unique phenotypic and transcriptional states within the CD4 differentiation and polarization trajectories (Figure 2D).
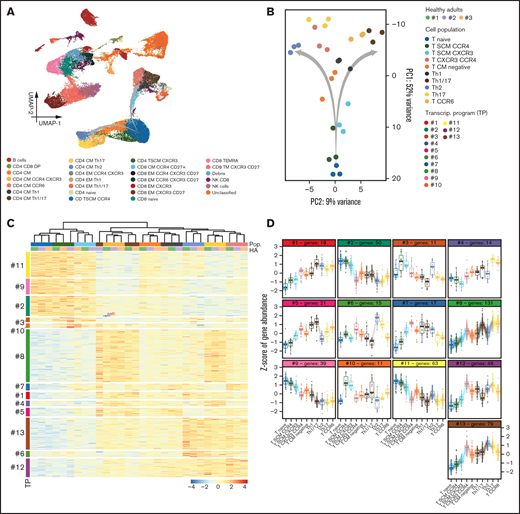
CD4 T-cell subsets with singular transcriptional states. (A) UMAP of peripheral blood lymphocytes from 3 healthy adults analyzed by flow cytometry immunophenotyping. (B) Principal component (PC) analysis of RNA-seq data from 10 subsets identified within the CD4 T-cell compartment and isolated by multidimensional fluorescence-activated cell sorting. A putative trajectory is indicated in (A) and from Naïve to central memory (CM) CD4 T cells (B), which subsequently diverge according to T-helper polarization. (C) Heatmap based on gene expression of 10 CD4 T-cell subsets: naive, SCM CCR4+, TSCM CXCR3+, central memory (CM) CXCR3+ and CXCR4+, CM without expression of any marker, T-helper type 1 (Th1), T-helper type 1/17 (Th 1/17), T-helper type 2 (Th2), T-helper type 17 (Th17), and CCR6+ CM. Transcriptional programs were defined by k-means clustering. Gene expression is represented by a row z-score. (D) The z-score of gene expression in CD4 T-cell subsets according to their transcriptional program.
CD4 T-cell subsets with singular transcriptional states. (A) UMAP of peripheral blood lymphocytes from 3 healthy adults analyzed by flow cytometry immunophenotyping. (B) Principal component (PC) analysis of RNA-seq data from 10 subsets identified within the CD4 T-cell compartment and isolated by multidimensional fluorescence-activated cell sorting. A putative trajectory is indicated in (A) and from Naïve to central memory (CM) CD4 T cells (B), which subsequently diverge according to T-helper polarization. (C) Heatmap based on gene expression of 10 CD4 T-cell subsets: naive, SCM CCR4+, TSCM CXCR3+, central memory (CM) CXCR3+ and CXCR4+, CM without expression of any marker, T-helper type 1 (Th1), T-helper type 1/17 (Th 1/17), T-helper type 2 (Th2), T-helper type 17 (Th17), and CCR6+ CM. Transcriptional programs were defined by k-means clustering. Gene expression is represented by a row z-score. (D) The z-score of gene expression in CD4 T-cell subsets according to their transcriptional program.
T-cell subsets associated with the malignant transformation of SMM
Immune dysfunction is a hallmark of benign and active stages of MM.9,29,40 However, which immune cell types are significantly associated with its malignant transformation remains largely unknown.29,41 So we evaluated the performance of FlowCT for immune biomarker discovery in 150 PB samples from patients with SMM. In spite of the large data set and the length of time needed to gather it (22 months), technical variability was successfully corrected using the gaussNorm method. Afterward, we narrowed the analysis to CD4 and CD8 T cells that were subclustered after initial clustering of PB lymphocytes using FlowSOM (Figure 3A). FlowCT identified 22 CD4 and 18 CD8 T-cell subsets. A statistical comparison between patients with SMM who had stable disease (n = 124) and those who had progressive disease (n = 26) uncovered significantly higher frequencies of TCD4+CD28–TIGIT+CD127low, TCD4+CD28–CD127+, TCD8+CD28–TIGIT+, and TCD8+CD28–TIGIT+CD127+ T cells in the latter (supplemental Figure 9).
![T-cell subsets associated with the malignant transformation of SMM. (A) UMAP of the entire T-cell compartment and CD4 and CD8 subsets in PB of 150 patients with SMM. (B) Risk stratification according to the presence of −4 or fewer vs −4 or more points (prognostic scores of 1 and 2, respectively) based on 1, 2, or 3 points being attributed according to low, intermediate, or high frequency of double-positive (DP), TCD4+CD28+CD127+, TCD4+CD28+TIGIT+CD127low, Treg TIGIT+CD39dim, Treg TIGIT+CD39+, and TCD8+CD28–TIGIT+PD1+CD127+ T cells. (C) Pie charts display the distribution of patients based on the 2/20/20 [>2 g/dL of serum M-protein, >20% serum free light-chain ratio, and >20% plasma cells found by BM biopsy] risk model of the IMWG in each subgroup of patients defined by their immune score. Significant differences were observed in the frequency of patients with low risk according to the IMWG when comparing patients with low- and high-risk immune scores.](https://ash.silverchair-cdn.com/ash/content_public/journal/bloodadvances/6/2/10.1182_bloodadvances.2021005198/5/m_advancesadv2021005198f3.png?Expires=1769777951&Signature=lCgCNyCfDfsgsd0WIbrgZXlVjoLMu8~VQx4Z16RNY-MciveakEp8aiK0WOnM~ZA-OZAOc3WfUDwxQq8yB~YM0LyUEBkvjEebPDd6Cbbp0ApKcKBeSKV2Kg1XgjlKB0jx-i0BKvcZwBEQ91a9FSdqwZjYD3YvvQWTtoVjhLT8ABo2qI11IH5uKoFaB8w7Z459VPrjLPie-rExgCrycMDxV3nYGXPTsbfT9aCwa35srqV8V7hR57U16M1H7oc-vdjS4d-AURwJRTrknCaia9Zrz4H9jmnRvG3iRAkYdUk3chGc1vkRraoFVo-sOMmS~5PHEO9415RNi3ZJUD7t8TDkWg__&Key-Pair-Id=APKAIE5G5CRDK6RD3PGA)
T-cell subsets associated with the malignant transformation of SMM. (A) UMAP of the entire T-cell compartment and CD4 and CD8 subsets in PB of 150 patients with SMM. (B) Risk stratification according to the presence of −4 or fewer vs −4 or more points (prognostic scores of 1 and 2, respectively) based on 1, 2, or 3 points being attributed according to low, intermediate, or high frequency of double-positive (DP), TCD4+CD28+CD127+, TCD4+CD28+TIGIT+CD127low, Treg TIGIT+CD39dim, Treg TIGIT+CD39+, and TCD8+CD28–TIGIT+PD1+CD127+ T cells. (C) Pie charts display the distribution of patients based on the 2/20/20 [>2 g/dL of serum M-protein, >20% serum free light-chain ratio, and >20% plasma cells found by BM biopsy] risk model of the IMWG in each subgroup of patients defined by their immune score. Significant differences were observed in the frequency of patients with low risk according to the IMWG when comparing patients with low- and high-risk immune scores.
T-cell subsets associated with the malignant transformation of SMM. (A) UMAP of the entire T-cell compartment and CD4 and CD8 subsets in PB of 150 patients with SMM. (B) Risk stratification according to the presence of −4 or fewer vs −4 or more points (prognostic scores of 1 and 2, respectively) based on 1, 2, or 3 points being attributed according to low, intermediate, or high frequency of double-positive (DP), TCD4+CD28+CD127+, TCD4+CD28+TIGIT+CD127low, Treg TIGIT+CD39dim, Treg TIGIT+CD39+, and TCD8+CD28–TIGIT+PD1+CD127+ T cells. (C) Pie charts display the distribution of patients based on the 2/20/20 [>2 g/dL of serum M-protein, >20% serum free light-chain ratio, and >20% plasma cells found by BM biopsy] risk model of the IMWG in each subgroup of patients defined by their immune score. Significant differences were observed in the frequency of patients with low risk according to the IMWG when comparing patients with low- and high-risk immune scores.
We next sought to identify an immune signature associated with TTP. Because of the risk of overfitting when using Cox proportional hazard models to analyze high-dimensional data,42 we implemented the FlowCT machine learning tools that were designed to overcome this limitation. By applying the gradient boosting algorithm to the data set (with patients being classified into different groups based on high, intermediate, or low frequency of each subset according to their 66th and 33rd percentiles) (supplemental Table 3), we identified 6 populations—double positive, TCD4+CD28+CD127+, TCD4+CD28+TIGIT+CD127low, regulatory T cell (Treg) TIGIT+CD39dim, Treg TIGIT+CD39+, and TCD8+CD28–TIGIT+PD1+CD127+ T cells—whose frequency was associated with TTP. On the basis of the weight direction of the 6 immune subsets (ie, highest values being associated with inferior TTP; supplemental Figure 10A), we developed a model in which low, intermediate, or high frequency of these cell groups were assigned 1, 2, or 3 points, respectively. After dividing patients with SMM into 2 groups on the basis of a score below or above the median scoring value, we observed that those with more than −4 points had significantly higher risk of transformation (n = 21 of 65) compared with patients with equal to or less than −4 points (n = 5 of 85) (hazard ratio [HR], 1.7; 95% confidence interval [CI], 1.33-2.18; P = .00002) (Figure 3B). Interestingly, the frequency of Treg CD39dim, double-positive, and CD8+CD28–TIGIT+PD1+CD127+ T cells further increased from baseline to the moment of progression (supplemental Figure 10B). We found a significant correlation between our risk model (based on immune profiling) and the 2/20/20 [>2 g/dL of serum M-protein, >20% serum free light-chain ratio, and >20% plasma cells found by BM biopsy] risk model proposed by the International Myeloma Working Group (IMWG) (P = .02) (Figure 3C).
T-cell biomarkers of survival in active MM
Despite the longstanding enthusiasm regarding the putative role of the immune system in controlling low levels of MRD, there is virtually no information regarding which cell types are prognostically relevant in this disease setting. So we used FlowCT to analyze the BM T-cell compartment of 100 patients with MM after treatment intensification and before maintenance therapy to identify immune biomarkers of prolonged survival.
Technical variability was corrected by using the warpSet and gaussNorm algorithms, and BM lymphocytes were clustered with FlowSOM. A total of 33 subpopulations were identified: 15 CD4, 11 CD8, and 4 γδ T-cell subsets plus a single CD4 and CD8 double-positive T-cell cluster (Figure 4A). We then performed an unsupervised hierarchical clustering to evaluate possible correlations between patients’ tumor immune microenvironment and clinical features by using the Revised International Staging System, standard-risk vs high-risk cytogenetic abnormalities, and MRD response assessed by next-generation flow cytometry. There was no evident correlation between patient clustering according to the distribution of the 33 immune cell types and clinical features (supplemental Figure 11A); no significant differences were observed between MRD+ and MRD– patients.
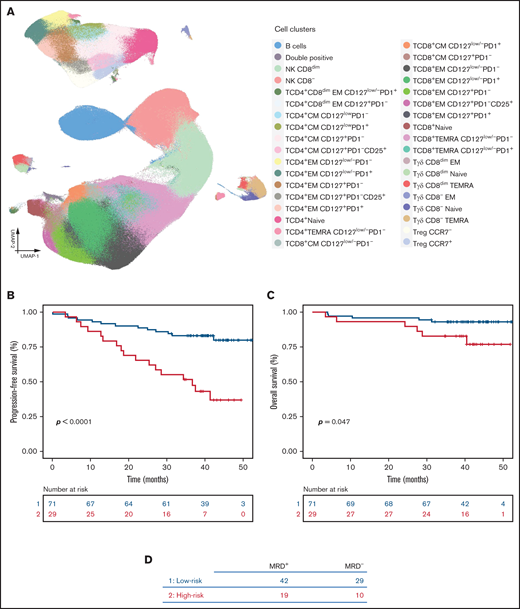
T-cell biomarkers of survival in active MM. (A) UMAP of BM lymphocytes in BM aspirates from 100 patients with MM that were collected after treatment intensification (GEM2012MENOS65) and before maintenance (GEM2014MAIN). (B-C) Gradient boosting was performed in all 33 subsets to identify prognostic T-cell biomarkers; 6 T-cell types (TCD4+Naive, TCD4+EM CD127lowPD1+, TCD4+CM CD127lowPD1–, TCD8+EM CD127lowPD1+, TCD8+TEMRA CD127low PD1+, and Tγδ CD8– TEMRA) were associated with survival and were modeled to generate a prognostic score. Based on the negative or positive weight of the 6 subsets, a model was developed in which low frequency was assigned 1 point and high frequency was assigned 2 points. Patients were stratified according to the presence of ≤5 points (prognostic score 1) or >5 points (prognostic score 2). PFS (B) and OS are shown (C). (D) Number of MRD-positive and MRD-negative patients in each immune risk group.
T-cell biomarkers of survival in active MM. (A) UMAP of BM lymphocytes in BM aspirates from 100 patients with MM that were collected after treatment intensification (GEM2012MENOS65) and before maintenance (GEM2014MAIN). (B-C) Gradient boosting was performed in all 33 subsets to identify prognostic T-cell biomarkers; 6 T-cell types (TCD4+Naive, TCD4+EM CD127lowPD1+, TCD4+CM CD127lowPD1–, TCD8+EM CD127lowPD1+, TCD8+TEMRA CD127low PD1+, and Tγδ CD8– TEMRA) were associated with survival and were modeled to generate a prognostic score. Based on the negative or positive weight of the 6 subsets, a model was developed in which low frequency was assigned 1 point and high frequency was assigned 2 points. Patients were stratified according to the presence of ≤5 points (prognostic score 1) or >5 points (prognostic score 2). PFS (B) and OS are shown (C). (D) Number of MRD-positive and MRD-negative patients in each immune risk group.
We then applied the gradient boosting algorithm and identified 6 immune subsets whose frequency was significantly associated with PFS: TCD4+ Naive, TCD4+ EM CD127lowPD1+, TCD4+ CM CD127lowPD1–, TCD8+ EM CD127lowPD1+, TCD8+ EMRA CD127lowPD1+, and Tγδ TCD8– TEMRA T cells [TEMRA is defined as effector memory CD45RA+ T cell] (supplemental Figure 11B). High and low frequencies of each subset were defined by using cutoffs identified by maxstat and were respectively assigned 1 or 2 points. Patients were then scored and divided into 2 risk groups on the basis of a score below or above the median scoring value; the frequency of each cell type in both groups is shown in supplemental Figure 11C. Patients with high-risk score (≤5 points) showed significantly inferior PFS (HR, 4.09; 95% CI, 1.98-8.45; P = .0001) and OS (HR, 3.12; 95% CI, 0.95-10.23; P = .047) (Figure 4B-C). There were no significant differences in patients’ MRD status according to the immune risk score (Figure 4D).
Immune modulation of BM T cells during maintenance
Current maintenance regimens in MM use lenalidomide for long periods, but knowledge about the effects of prolonged immune modulation remains limited. Thus, we used FlowCT to analyze the BM T-cell compartments of 40 patients with MM before and after 1 and 2 years of maintenance. This is an ideal data set for evaluating the performance of FlowCT in processing data collected over time and resolving inevitable technical variation in studies conducted over long periods.
Technical variability was corrected using warpSet and gaussNorm. The automated clustering of BM lymphocytes was performed with FlowSOM, and the cluster annotation was performed with Infinicyt (supplemental Figure 12A). Computational analysis of 8-dimensional immunophenotypic data uncovered the presence of 33 T-lymphocyte clusters in the tumor microenvironment: 15 CD4 T-cell subsets, including 2 types of Tregs (CCR7+ and CCR7–), 11 CD8 T-cell subsets, CD4 and CD8 double-positive T cells, and 6 clusters of γδ T cells (Figure 5A-B; supplemental Figure 12B-F). The frequency of TCD4+ CM CD127lowPD1–, TCD4+ EM CD127+PD1–CD25+, Treg CCR7–, TCD8+ EM CD127+PD1–, TCD8+ EM CD127+PD1–CD25+, and Tγδ CD8dim EM cells increased over time (Figure 5C). Conversely, TCD4+ CM CD127lowPD1+, TCD4+Naïve, and TCD4+ EMRA CD127lowPD1– cells decreased during maintenance. Moreover, we found divergent trajectories in the distribution of 3 immune cell types (ie, double positive, TCD4+ TEMRA CD127lowPD1–, and TCD8+ EM CD127+PD1– T cells) in patients treated with RD compared with these 2 drugs plus ixazomib (Figure 5D). It should be noted that even though the differences are statistically significant, most of the differences in the frequencies of T-cell clusters were subtle and their clinical significance is unknown.
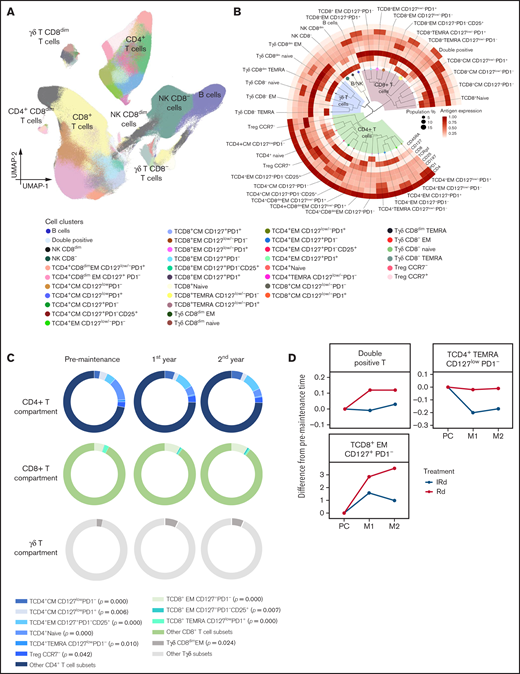
Immune modulation of BM T cells during lenalidomide maintenance. (A) UMAP of BM lymphocytes from patients with active MM (n = 40). (B) Phylogenetic tree and hierarchical clustering of unique subpopulations within CD4, CD8, and γδ T cells. (C) Pie chart diagrams showing the distribution of T-cell subsets significantly altered from the pre-maintenance time point to the second year of maintenance within CD4+, CD8+, and γδ T cells. (D) Spider plots displaying the kinetics of T-cell subsets that were significantly different between patients treated with Rd and these 2 drugs plus ixazomib (IRd). M1, 1st year of maintenance; M2, 2nd year of maintenance; PC, post-consolidation; TEMRA, T-cell effector memory CD45RA+.
Immune modulation of BM T cells during lenalidomide maintenance. (A) UMAP of BM lymphocytes from patients with active MM (n = 40). (B) Phylogenetic tree and hierarchical clustering of unique subpopulations within CD4, CD8, and γδ T cells. (C) Pie chart diagrams showing the distribution of T-cell subsets significantly altered from the pre-maintenance time point to the second year of maintenance within CD4+, CD8+, and γδ T cells. (D) Spider plots displaying the kinetics of T-cell subsets that were significantly different between patients treated with Rd and these 2 drugs plus ixazomib (IRd). M1, 1st year of maintenance; M2, 2nd year of maintenance; PC, post-consolidation; TEMRA, T-cell effector memory CD45RA+.
Discussion
Standard flow cytometry has been frequently used for immune monitoring43 and newer instruments measuring 30 or more parameters will undoubtedly enhance the ability of flow cytometry to profile patients with cancer. However, data interpretation based on multiple biaxial plots that increase quadratically with the number of parameters being analyzed is a dimensionality explosion that should not be prolonged.43 Thus, the analysis of high-dimensional single-cell flow cytometry should rely on computational methods that leverage the multiparametric nature of this technology. Here, we present FlowCT to empower flow cytometry users with a relatively simple workspace to process, analyze, and visualize large data sets. Final results can be exported in tabular format for statistical analysis and in FCS format for classical flow cytometry interpretation using other software; however, both can be performed within FlowCT. To our knowledge, this is the first time this type of tool has been used in MM, and we illustrated the strength of computational flow cytometry by answering 4 research questions.
A critical aspect of immunophenotyping in large studies is the technical variation between cytometers and longitudinal differences in samples collected across broad time scales (eg, clinical trials).16 Thus, we embedded multiple methods in FlowCT that enable data cleaning and quality checking, including canonical correlation analysis from Seurat,44 which was adopted for the first time to normalize flow cytometry data. Indeed, we showed here how technical artifacts or batch effects intrinsic to large cohorts studied over long periods were successfully normalized using FlowCT.
There has been a massive increase in data collection in biomarker cancer research.45 Clustering leads to the loss of single-cell resolution, but it also facilitates interpretation of large data sets, so multiple techniques for automated clustering were included in FlowCT (ie, FlowSOM, Phenograph, Seurat, and PARC). Unlike other algorithms, FlowSOM and PARC do not require down-sampling (ie, reducing the number of events being analyzed); therefore, they can analyze larger numbers of cells within a reasonable computation time.18,21 Clustering approaches using FlowSOM or PARC can provide optimal results in large flow cytometry data sets,43,46 and they outperform Phenograph or Seurat in terms of both speed and ability to detect rare cell populations. We demonstrated the capability of both techniques by showing how they clustered and subclustered major lymphocyte compartments into numerous immune subsets. This was evident when using more conventional 8-color immunophenotyping and became even more evident when applied to high-dimensional flow cytometry data (an example of increasing complexity of scaling from 8 to 17 mAb combinations is provided in supplemental Figures 13 and 14). Although it is beyond the scope of this study, we also evaluated the performance of FlowCT in PB samples from 3 healthy adults that were stained with 24 mAbs and measured in a spectral flow cytometer (supplemental Figure 15). Collectively, these findings illustrate the high level of cellular diversity within common immune subsets, which can be depicted by FlowCT analysis of both conventional and spectral flow cytometry data.
Effective visualization of large, diverse, and high-dimensionality data is mandatory.45 Although principal component analysis is commonly used as a linear approach, it is typically less powerful than nonlinear methods such as t-distributed stochastic neighbor embedding (t-SNE) and UMAP. t-SNE is frequently used in mass cytometry or for single-cell RNA-seq data, but it struggles to analyze large numbers of cells because of its slow computational time.47 Conversely, recently developed UMAP overcomes this and other constraints on t-SNE performance by preserving both local and global distances among cells without requiring greater computational load. UMAP also adds new observations to existing plots and recapitulates developmental trajectories. Here we showed that FlowCT was computationally efficient on standard computers, and by avoiding down-sampling, it was able to identify clusters with low frequency such as 2 SCM T-cell subsets based on differential antigen expression of CCR4 and CXCR3 (3.78% and 1.89% of the lymphocyte subpopulation, respectively, that is, ≤0.5% of total PB cells), which were associated with singular transcriptional states. We also performed an objective comparison between lymphocyte distribution in paired PB and BM samples from patients with SMM and observed that most subsets showed a significant correlation. Exceptions were TCD4 SCM or TCD4 CM cells, which could be related to the diversity of antigens present in PB and BM, or in other sites from which CD4 T cells egressed into the PB.
Using big data and machine learning for clinical cancer care is now a realistic and achievable goal, as demonstrated recently by analyzing samples from solid tumors.48 Several machine learning algorithms are included in FlowCT and could be used to build predictive models of survival (gradient boosting49 and random forest50 ) or to learn classification rules (ie, to identify variables associated with a specific feature, such as partial least squares [discriminant analysis], random forest, and support vector machines).51 In this study, we used gradient boosting to identify new T-cell biomarkers in patients with SMM or active MM. It is plausible that these T-cell subsets could remain unnoticed with manual analysis of data; thus, computational flow cytometry will likely be mandatory for biomarker discovery and precision immunotherapy. Here, patients with SMM who had increased percentages of 4 TIGIT+ T-cell subsets showed a higher risk of transformation, and others have shown that MM escape can be prevented by TIGIT blockade.52 Interestingly, patients’ immunoscore were only partially related to the IMWG 2/20/20 criteria,53 and future studies should investigate a potential complementarity between both models toward the identification of patients with high-risk IMWG symptoms that may not progress at 2 years because of active immune surveillance, as well as patients with IMWG low- or intermediate-risk disease who progress earlier than expected because of immune escape.
Novel tools for mining single-cell data have been specifically designed for mass cytometry or single-cell RNA-seq. Likely because of this and because of the fact that there are few open-source and integrated frameworks,43,44 computational flow cytometry is not being applied in cancer immunology. Workspaces such as FlowCT are a prerequisite for accelerating the analysis of large immunophenotypic data sets toward the development of deep learning algorithms, which would improve the ability of flow cytometry to predict outcomes in patients with hematologic malignancies.54 Its open-source nature provides room for continuous improvement and for the development of data-driven predictive models resulting from embedded large data sets carefully annotated with patients’ treatments and outcomes. Here, we started with 100 patients with active MM who were monitored before maintenance, and we showed a potential complementarity between immune and MRD monitoring to predict outcome and the impact that maintenance may have in the frequency of singular cell types.
One limitation of this study is that the discovery of putative predictive immune biomarkers in patients with SMM or active MM was not validated in independent data sets. Ideally, these results will motivate worldwide investigators to add immune profiles from these and other disease scenarios to pave the way for a holistic, unbiased, and objective association between cellular phenotypes and clinical outcomes.
Acknowledgments
This work was supported by grants from the Instituto de Salud Carlos III/Subdireccion General de Investigacion Sanitaria and co-financed by FEDER funds (CB16/12/00233, CB16/12/00369, PI17/01243 and PI20/00048), and together with FCAECC for iMMunocell Transcan-2 (AC17/00101), the Cancer Research UK (C355/A26819), Fundación Científica de la Asociación Española Contra el Cáncer and Italian Association for Cancer Research (AIRC) under the Accelerator Award Program (EDITOR), 2017 Multiple Myeloma Research Foundation Immunotherapy Networks of Excellence, Black Swan Research Initiative of the International Myeloma Foundation, European Hematology Association nonclinical advanced research grant (3680644), European Research Council 2015 Starting Grant (MYELOMANEXT grant 680200), the Cancer Research Innovation in Science Cancer Foundation (PR_EX_2020-02), the Leukemia Lymphoma Society, unrestricted grants from Bristol-Myers Squibb/Celgene and Takeda, Roche imCORE program (NAV-15), Innovative immunotherapeutic treatments of human cancer, Multi-Unit Regional (n. 16695 2015/2018, co-financed by AIRC and CARICAL Foundation; and n. 24689 IG-2020 financed by AIRC), Fondazione Regionale per la Ricerca Biomedica (Regione Lombardia) (Project ID 065 JTC 2016), ERA-NET TRANSCAN-2, and by My First AIRC Grant 2020 (n. 24534, 2021/2025), and by the Riney Family Multiple Myeloma Research Program Fund.
Authorship
Contribution: C.B., C.M., J.-J.G., and B.P. conceived and designed the study; C.B., C.M., R.T., C.P., and I.M. performed the automated analysis of flow cytometry data; C.M., C.P., L.B., A.Z., and J.M. performed the manual analysis of flow cytometry data; J.-J.G. and C.B. designed the R package; D.A. performed cell sorting; S.S. and J.-J.G. performed and analyzed RNA-seq experiments; N.P., M.-T.C., M.R., P.T., M.G., P.C., I.B., E.T., T.J., A.P., A.R., H.G., H.A.-L., L.R., M.-V.M., J.M.-L., J.-J.L., J.B., and J.F.S.-M. provided study material and/or patients and support; C.B., C.M., and J.-J.G. performed the statistical analysis; C.B., C.M., J.-J.G., and B.P. wrote the manuscript; and all authors reviewed and approved the manuscript.
Conflict-of-interest disclosure: A.R. has received honoraria from Amgen, Celgene, and Janssen and a research grant from AstraZeneca. H.G. has received speakers bureau honoraria from Academy2, KG, Agentur Hogg Robinson Germany, Amgen, ArtTempi, Beupdated Helbig Consulting and Research AG Schweiz, Bristol Myers Squibb, Celgene, Chop, Chugai, Congress Culture Concept Dr. S. Stocker München, Connectmedia Warschau/Polen, Dr. Hubmann Tumorzentrum München, FomF, GlaxoSmithKline, GWT Forschung und Innovation Dresden, Institut für Versorgungsforschung in der Onkologie GbR, Janssen, Kompetenznetz Maligne Lymphome, MedConcept, Medical Communication, Münchner Leukämie Labor Prof. Haferlach, New Concept Oncology, Novartis, Omnia Med Deutschland, Onko Internetportal DKG-web, Sanofi, STIL Forschungs, and Veranstaltungskonzept Gesundheit Mechernich, has served as a member on advisory boards for Adaptive Biotechnology, Amgen, Bristol Myers Squibb, Celgene, Janssen, Sanofi, and Takeda, and has received research grants and/or materials such as investigational medicinal products from Amgen, Bristol Myers Squibb, Celgene, Chugai, Dietmar-Hopp-Foundation, Janssen, John Hopkins University, and Sanofi. B.P. has received honoraria for lectures from and served as a member on advisory boards for Adaptive, Amgen, Bristol-Myers Squibb/Celgene, Creative BioLabs, Janssen, Kite Pharma, Sanofi, and Takeda, has received unrestricted grants from Celgene, EngMab, Roche, Sanofi, and Takeda, and has served as a consultant for Bristol Myers Squibb/Celgene, Janssen, Sanofi, and Takeda. The remaining authors declare no competing financial interests.
Correspondence: Cirino Botta, Hematology Unit, Department of Health Promotion, Mother and Child Care, Internal Medicine and Medical Specialties, University of Palermo, Via del Vespro, 90127 Palermo, Italy; e-mail: cirino.botta@unipa.it; and Bruno Paiva, Center for Applied Medical Research, Clinica Universidad de Navarra, Av. Pío XII, 55, 31008 Pamplona, Spain; e-mail: bpaiva@unav.es.

