

Key Points
We developed a novel algorithm based on a disease-specific ICD code and diagnostic criteria to calculate incidence and prevalence of iMCD.
Treatment with siltuximab is uncommon in those with iMCD, despite being the only US Food and Drug Administration– approved therapy.

Abstract
The epidemiology of human herpesvirus-8–negative/idiopathic multicentric Castleman disease (iMCD) remains incompletely understood. Prior epidemiologic studies of CD and iMCD have been hampered by difficulties in accurate case ascertainment resulting from a lack of uniform diagnostic criteria and a disease-specific International Classification of Diseases (ICD) code. In this study, we provide reliable estimates of CD and iMCD in the United States using a novel claims-based algorithm that includes a CD-specific ICD (10th revision) diagnosis code (D47.Z2) supported by the presence of ≥2 claims codes corresponding to the minor criteria from the international evidence-based diagnostic criteria for iMCD. We additionally analyzed the treatment classes and patterns in the clinical course of patients with iMCD. Using an administrative claims database of 30.7 million individuals enrolled between 1 January 2017 and 31 December 2018, we identified 254 patients with iMCD, with an estimated annual incidence and prevalence of 3.4 (95% confidence interval [CI], 1.4-9.2) and 6.9 (95% CI, 3.7-13.3) cases per million, respectively. Among patients with iMCD, 39% received corticosteroid monotherapy, 33.1% received no iMCD-directed treatment, and 9.8% received interleukin-6 (IL-6)–targeted therapy with tocilizumab or siltuximab. Siltuximab, which is the only US Food and Drug Administration–approved treatment and established first-line treatment recommendation, was used in only 8.7% of patients with iMCD. This study provides the most up-to-date understanding of the iMCD disease burden in the United States and identifies a major unmet treatment need for IL-6–directed therapy in this vulnerable cohort.
Introduction
Castleman disease (CD) encompasses a group of lymphoproliferative disorders that share common histopathologic features with widely different etiologies, clinical features, treatments, and outcomes.1,2 Unicentric CD (UCD) typically presents as enlarged lymph node(s) at a single anatomic site, and surgical excision is typically considered curative. Multicentric CD (MCD) involves multiple regions of enlarged lymph nodes and may be associated with hepatosplenomegaly, cytopenias, systemic inflammatory response, and life-threatening multiple organ dysfunction resulting from dysregulated production of cytokines or a so-called cytokine storm that includes elevated levels of interleukin-6 (IL-6) and other cytokines. In a subset of MCD cases, the excessive cytokine production has been associated with uncontrolled human herpesvirus-8 (HHV-8) infection in HIV+ patients or otherwise immunocompromised individuals, and these cases are referred to as HHV-8–associated MCD (HHV-8-MCD). One third to one half of MCD cases occur in patients who are HHV-8− and HIV− and have no clearly identifiable etiology; these cases are referred to as HHV-8−/idiopathic MCD (iMCD), and historically, they have poor outcomes.3
The epidemiology of CD and, more specifically, iMCD in the United States and worldwide remains poorly understood. Earlier studies in the United States relied on administrative claims databases and institutional experiences to estimate the incidence of CD subtypes.4,5 However, these studies were limited in their ability to accurately assess incidence as a result of the lack of uniform diagnostic criteria for iMCD and the absence of a CD-specific International Classification of Diseases (ICD) code. With the introduction of a CD-specific ICD (10th revision; ICD-10) code (D47.Z2) in 2017 and publication of international evidence-based diagnostic criteria and treatment guidelines in 2017 and 2018, respectively, it is now feasible to obtain more accurate population estimates.3,6
Several treatment approaches have been used for managing iMCD in the last decade, including corticosteroids, B cell–depleting agents, chemotherapies, immunomodulators, and, more recently, IL-6–targeted monoclonal antibody therapies. Siltuximab, a monoclonal antibody that targets IL-6, is currently the only therapy approved by the US Food and Drug Administration (FDA) and European Medicines Agency for iMCD and is recommended as first-line therapy in the treatment guidelines.6,7 However, siltuximab use patterns in patients with iMCD since FDA approval of the drug in 2014 and general adherence to treatment guidelines are unknown.
The primary objective of this study was to calculate the estimated incidence and prevalence of iMCD in the United States using a novel claims-based algorithm based on the recently introduced CD-specific ICD-10 code and adoption of international evidence-based consensus diagnostic criteria for iMCD. A secondary objective was to evaluate treatment patterns and sequence of treatment in patients with iMCD.
Methods
Data source
Anonymized longitudinal patient data were sourced from the IBM MarketScan Research Databases (MarketScan), an administrative claims database that contains data on inpatient and outpatient claims, including medical, laboratory, procedural, and prescription claims from January 2006 through March 2020.8 The database is composed of patients from 3 insured populations: (1) patients with employer-based private health insurance plans sponsored by >100 large- and medium-sized employers in the United States, (2) Medicare beneficiaries who possess supplemental insurance paid by their employers, and (3) patients with Medicaid in 1 of 11 participating states.8 Enrollment data include information on age, sex, and periods of service eligibility. Use of medical services is recorded in the database with date of service, geographic location of patient residence, provider type, associated diagnoses, and performed procedures. Diagnoses and procedures are recorded based on ICD-9 Clinical Modification (ICD-9-CM) or ICD-10-CM and Current Procedural Terminology (fourth edition; CPT-4) codes. Prescription claims include the National Drug Code (NDC), quantity of units dispensed, and days of supply. A detailed list of all ICD-9-CM, ICD-10-CM, and CPT-4 codes and National Drug Codes used in this study can be found in supplemental Table 1. The database is compliant with the Health Insurance Portability and Accountability Act. Because the data are commercially available and deidentified, institutional review board approval was not required. Analyses were conducted in June 2020.
Study population
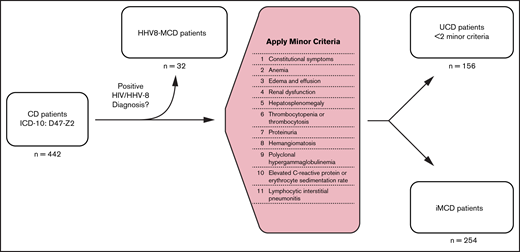
Patients with a CD-specific ICD-10 code, D47.Z2 (adopted 1 January 2017) between 1 January 2017 and 31 December 2019 were included in this analysis. All adjudicated claims of this cohort from 2006 to 2019 were analyzed to identify and rule out CD mimics, determine incidence and prevalence of CD and its subtypes, and evaluate treatment patterns of iMCD. To differentiate patients with iMCD from those with other CD subtypes, we developed a claims-based algorithm that, in addition to the CD-specific ICD-10 diagnosis code, required negative HHV-8 and HIV viral status and presence of corresponding diagnostic or laboratory claims for ≥2 minor criteria, consistent with the published diagnostic criteria recommendations for iMCD.9 All patients with <2 minor criteria were defined as having UCD. All patients with >1 diagnostic code for HHV-8 or HIV within 1 year of CD diagnosis were defined as having HHV-8-MCD. Lastly, we looked for claims codes for the common MCD mimics (rheumatoid arthritis, lupus, lymphomas including both Hodgkin and non-Hodgkin lymphomas, and myelomas) within 1 year of CD diagnosis to identify patients who had claims codes for any 1 of these diagnoses. The patient selection algorithm is depicted in Figure 1.
Calculating incidence and prevalence rates
Our base population comprised all insured patients, healthy or with medical conditions, continuously enrolled in the database from 1 January 2017 through 31 December 2018. Because of the inherent time lag in reporting claims to administrative health claims databases and consequent incompleteness of data, we censored all patients identified in 2019 from incidence and prevalence estimates. To estimate incidence, we reviewed all available historical claims data for the study population defined above dating back to 2006. Because a CD-specific ICD-10 code was not in effect before 2017, we defined each patient’s index diagnosis date (IDD) as the first date of the D47.Z2 diagnosis claims code when available or the previous nonspecific ICD-9-CM code for enlargement of lymph nodes previously used for CD (785.6), whichever appeared first. Annual incidence of CD, UCD, MCD, HHV-8-MCD, and iMCD was defined as the number of patients with an IDD during 2017 and 2018 per 100 000 patients continuously enrolled in a health plan during those years, respectively. Patients with claims associated with ICD-9-CM code 785.6 before 2017 were not included in incidence calculations.
We estimated the annual prevalence of CD, UCD, MCD, HHV-8-MCD, and iMCD for the years 2017 and 2018 where a unique ICD-10 code for CD was in effect and complete data were available. Annual prevalence was defined as the total number of diagnosed CD and iMCD cases recorded during 2017 and 2018 per 100 000 patients continuously enrolled in a health plan during those years, respectively. Confidence intervals (CIs) for both incidence and prevalence were calculated assuming a Poisson distribution.
To estimate the number of CD, UCD, MCD, HHV-8-MCD, and iMCD cases in the United States, the calculated prevalence was projected onto the complete 2010 US Census data (population 327.2 million) adjusted by age and sex.10
Treatment pattern analysis
Claims for prescribed medications were evaluated for all patients with CD in the study following each patient’s IDD, as defined previously. Therapies recommended or commonly prescribed to treat iMCD based on published clinical guidelines6,7 and natural history studies11 were queried in the database and grouped under 6 therapeutic categories: (1) chemotherapy (bortezomib, bendamustine, bleomycin, cisplatin, cyclophosphamide, dacarbazine, decitabine, doxorubicin etoposide, lenalidomide, thalidomide, vinblastine, and vincristine), (2) immunomodulators (anakinra, cyclosporine, eculizumab, hydroxychloroquine, mycophenolate mofetil, and sirolimus), (3) B cell–depleting agents (rituximab), (4) direct IL-6 inhibitors (siltuximab), (5) corticosteroids, and (6) IL-6 receptor inhibitors (tocilizumab). Of these queried therapeutics, those identified in this patient population are detailed in supplemental Table 2. Patients were considered to have been treated with a medication if they had ≥2 claims for filled prescriptions. The number of unique therapies and different therapeutic classes prescribed for each patient was tabulated for all patients with CD and separately for patients with iMCD. Patients were considered to have switched to a different medication class if they had ≥2 filled prescriptions for a new therapeutic class with no overlapping prescriptions (≥1 month) for the prior therapeutic class. If 2 different classes were prescribed during the same time interval, patients were considered to be on both classes during that time and were not classified as having switched until there were no longer claims for the prior medication.
To analyze the factors determining initial treatment selection and subsequent treatment switching, we stratified patients with iMCD into 4 treatment groups: (1) no treatment, (2) corticosteroid monotherapy, (3) IL-6–targeted therapy (siltuximab or tocilizumab) for any duration of time after initial iMCD diagnosis (with or without other concomitant treatments), and (4) other iMCD therapy including iMCD treatments other than IL-6–targeted therapy or corticosteroid monotherapy (immunomodulators, chemotherapy, or rituximab). For each treatment group, mean age, sex distribution, clinical setting of initial iMCD diagnosis (inpatient or outpatient), mean years of follow-up after initial iMCD diagnosis, mean number of iMCD minor criteria coded, and distribution of different minor criteria were calculated. Formal pairwise comparison was performed between the no treatment or corticosteroid monotherapy group vs IL-6–targeted therapy or other iMCD therapy group based on the demographic and clinical variables described above.
Statistical analysis
All significance tests for continuous variables were calculated using Welch’s unequal variance t test with a significance level of .05. A 2-proportion test was used to identify significance between features described by discrete counts.
Results
After applying the newly developed claims-based algorithm for case identification to our base sample population of 30.7 million (including healthy individuals and those with medical conditions), we identified 442 CD cases, which included 188 non-iMCD cases and 254 iMCD cases. Of the 188 non-iMCD cases, 156 were identified as UCD and 32 as HHV-8-MCD (Figure 1). Of 254 patients with iMCD, 55 had at least 1 diagnosis claims code for a common MCD mimic. These patients were not excluded from the final iMCD cohort, because the CD-specific ICD-10 code is much less likely to be inserted erroneously during diagnostic evaluation and even less likely to endure in the medical record compared with codes for more common conditions like lymphoma that are often entered during the diagnostic workup of lymphadenopathy. We additionally performed a sensitivity analysis to quantify the impact of excluding these 55 patients from the final iMCD cohort on the incidence and prevalence estimates of CD and iMCD and found no significant difference after exclusion (supplemental Table 3). Patient characteristics and distribution of iMCD therapies among different CD subtypes and the base sample population are summarized in Table 1.
Patient characteristics
| Characteristic | Base Sample* | All CD | Non-iMCD | iMCD | P† | |
|---|---|---|---|---|---|---|
| UCD | HHV-8-MCD | |||||
| Total n | 30 757 413 | 442 | 156 | 32 | 254 | |
| Sex | ||||||
| Male | 14 041 488 (45.7) | 216 (48.9) | 82 (52.6) | 24 (75.0) | 110 (43.3) | |
| Female | 16 715 925 (54.3) | 226 (51.1) | 74 (47.4) | 8 (25.0) | 144 (56.7) | .007 |
| Mean age ± SD, y | 37.3 ± 21.8 | 49.1 ± 16.6 | 45.3 ± 16.4 | 50.9 ± 14.1 | 51.4 ± 16.6 | .001 |
| Age group, y | ||||||
| 0-17 | 7 597 776 (24.7) | 20 (4.5) | 9 (5.8) | 0 | 11 (4.3) | |
| 18-34 | 7 442 931 (24.2) | 83 (18.8) | 33 (21.2) | 7 (21.9) | 43 (16.9) | |
| 35-44 | 3 782 149 (12.3) | 56 (12.7) | 27 (17.3) | 3 (9.4) | 26 (10.2) | |
| 45-54 | 3 843 007 (12.5) | 101 (22.9) | 30 (19.2) | 9 (28.1) | 62 (24.4) | |
| 55-64 | 4 358 740 (14.2) | 134 (30.3) | 48 (30.8) | 9 (28.1) | 77 (30.3) | |
| ≥65 | 3 732 809 (12.1) | 48 (10.9) | 9 (5.8) | 4 (12.5) | 35 (13.8) | |
| Insurance | ||||||
| Medicare | 1 800 471 (5.9) | 31 (7.0) | 5 (3.2) | 2 (6.3) | 23 (9.1) | |
| Medicaid | 10 528 744 (34.2) | 108 (24.4) | 25 (16.3) | 16 (50.0) | 67 (26.4) | |
| Private | 18 428 198 (59.9) | 303 (68.6) | 126 (80.8) | 14 (43.8) | 164 (64.6) | |
| Mean continuous enrollment ± SD, y | 6.3 ± 3.8 | 6.3 ± 4.0 | 5.1 ± 3.8 | 4.8 ± 3.3 | 6.9 ± 4.0 | <.001 |
| Initial CD diagnosis setting | ||||||
| Inpatient | NA | 107 (22.2) | 17 (10.9) | 17 (53.1) | 73 (28.7) | |
| Outpatient | NA | 335 (77.8) | 139 (89.1) | 15 (46.9) | 181 (71.3) | |
| iMCD therapy | ||||||
| Chemotherapy‡ | NA | 23 (5.2) | 0 | 5 (15.6) | 18 (7.1) | |
| Immunomodulator§ | NA | 32 (7.2) | 3 (1.9) | 2 (6.3) | 27 (10.6) | .001 |
| Rituximab | NA | 39 (8.8) | 6 (3.8) | 8 (25.0) | 25 (9.8) | .380 |
| Siltuximab | NA | 25 (5.7) | 2 (1.3) | 1 (3.1) | 22 (8.7) | .001 |
| Corticosteroid | NA | 253 (57.2) | 75 (48.1) | 21 (65.6) | 157 (61.8) | |
| Tocilizumab | NA | 7 (1.6) | 2 (1.3) | 0 | 5 (1.9) | |
| Noneǁ¶ | NA | 170 (38.5) | 78 (50) | 8 (25.0) | 84 (33.1) | |
| N of patients with ≥1 therapeutic class | ||||||
| 1 | NA | 194 (43.9) | 68 (43.6) | 15 (46.9) | 111 (43.7) | |
| 2 | NA | 56 (12.7) | 10 (6.4) | 5 (15.6) | 41 (16.1) | |
| ≥3 | NA | 22 (5.0) | 0 | 4 (12.3) | 18 (7.1) | |
Data are presented as n (%) of patients unless otherwise indicated.
NA, not applicable; SD, standard deviation.
Base sample refers to all patients in the database with or without CD.
Comparison of all non-iMCD cases (UCD and HHV-8-MCD) with iMCD cases.
Bendamustine, bleomycin, cisplatin, cyclophosphamide, dacarbazine, decitabine, doxorubicin etoposide, vinblastine, and vincristine.
Anakinra, bortezomib, cyclosporin, eculizumab, hydroxychloroquine, lenalidomide, mycophenolate mofetil, sirolimus, and thalidomide.
None refers to no treatment claims for iMCD-directed treatments.
Pairwise comparison between patients with iMCD and those with other types of CD identified significant differences in demographic and treatment characteristics. Compared with patients with other types of CD, those with iMCD were significantly older (51.4 vs 46.2 years), more commonly female (56.7% vs 43.6%), and more likely to have received immunomodulators (10.6% vs 2.7%) and siltuximab (8.7% vs 1.6%) and had a longer period of continuous enrollment (6.9 vs 5.2 years). As anticipated, iMCD and HHV8-MCD patient groups tended to have increased frequencies of abnormal minor criteria than the UCD group (Table 2). The most prevalent minor criteria in patients with iMCD were constitutional symptoms (89%), anemia (68.5%), edema and effusion (58.3%), renal dysfunction (33.5%), hepatosplenomegaly (24%), and thrombocytopenia (18.9%). Consistent with the literature, a majority of patients with UCD did not have abnormal features at presentation.
iMCD minor criteria and distribution across patient populations
| Minor criterion* | Base sample (N = 30 757 413) | All CD (n = 442) | UCD (n = 156) | HHV-8-MCD (n = 32) | iMCD (n = 254) |
|---|---|---|---|---|---|
| Constitutional symptoms | 14 841 131 (48.3) | 311 (70.4) | 55 (35.3) | 30 (93.8) | 226 (89.0) |
| Anemia | 4 816 950 (15.7) | 215 (48.6) | 12 (7.7) | 29 (90.6) | 174 (68.5) |
| Edema and effusion | 3 234 866 (10.5) | 188 (42.5) | 16 (10.3) | 24 (75.0) | 148 (58.3) |
| Renal dysfunction | 1 684 450 (5.5) | 106 (24) | 1 (0.6) | 20 (62.5) | 85 (33.5) |
| Hepatosplenomegaly | 484 617 (1.6) | 81 (18.3) | 6 (3.8) | 14 (43.8) | 61 (24.0) |
| Thrombocytopenia | 604 507 (2.0) | 66 (14.9) | 0 | 18 (56.3) | 48 (18.9) |
| Proteinuria | 629 765 (2.0) | 42 (9.5) | 1 (0.6) | 5 (15.6) | 36 (14.2) |
| Hemangiomatosis | 973 976 (3.2) | 27 (6.1) | 3 (1.9) | 1 (3.1) | 23 (9.1) |
| Thrombocytosis | 112 787 (0.4) | 20 (4.5) | 2 (1.3) | 2 (6.3) | 16 (6.3) |
| Hypergammaglobulinemia | 19 914 (0.1) | 16 (3.6) | 2 (1.3) | 2 (6.3) | 12 (4.7) |
| Elevated ESR | 95 130 (0.3) | 14 (3.2) | 0 | 2 (6.3) | 12 (4.7) |
| Elevated CRP | 103 165 (0.3) | 10 (2.3) | 0 | 1 (3.1) | 9 (3.5) |
| LIP | 308 (<0.1) | 0 | 0 | 0 | 0 |
Data are presented as n (%) of patients.
CRP, C-reactive protein; ESR, erythrocyte sedimentation rate; LIP, lymphocytic interstitial pneumonitis.
There are 11 minor criteria for iMCD diagnosis, with thrombocytopenia/thrombocytosis and elevated CRP/ESR each counting as a single criterion.
Annual incidence and prevalence estimates for all CD cases and each subtype during 2017 to 2018 are presented in Table 3. CD incidence was estimated to be 5.5 (95% CI, 2.8-11.5) per million in 2017 and 5.8 (95% CI, 3.0-12.9) per million in 2018. CD prevalence was estimated to be 10.2 (95% CI, 6.2-17.3) per million in 2017 and 16.2 (95% CI, 10.5-25.6) per million in 2018. iMCD incidence was estimated to be 3.4 (95% CI, 1.4-9.2) per million in 2017 and 3.1 (95% CI, 1.2 − 10.0) per million in 2018. iMCD prevalence was estimated to be 6.9 (95% CI, 3.7-13.3) per million in 2017 and 9.7 (95% CI, 5.6-17.8) per million in 2018.
Annual incidence and prevalence from 2017 to 2018
| All CD | UCD | MCD | HHV-8-MCD | iMCD | ||||||
|---|---|---|---|---|---|---|---|---|---|---|
| Cases per million | Total US cases | Cases per million | Total US cases | Cases per million | Total US cases | Cases per million | Total US cases | Cases per million | Total US cases | |
| Incidence | ||||||||||
| 2017 | 5.5 (2.8-11.5) | 1804 (928-3768) | 1.9 (0.7-5.5) | 612 (239-1804) | 4 (1.71-9.9) | 1303 (560-3250) | 0.4 (0.1-1.6) | 141 (44-514) | 3.4 (1.4-9.2) | 1111 (440-2996) |
| 2018 | 5.8 (3.0-12.9) | 1904 (994-4216) | 2.5 (0.9-7.9) | 800 (307-2572) | 3.7 (1.57-10.7) | 1213 (513-3503) | 0.6 (0.1-3.1) | 193 (39-1027) | 3.1 (1.2-10.0) | 1022 (405-3274) |
| Prevalence | ||||||||||
| 2017 | 10.2 (6.2-17.3) | 3326 (2034-5671) | 2.7 (1.2-6.6) | 894 (409-2174) | 7.7 (4.3-14.3) | 2504 (1407-4675) | 0.7 (0.2-3.1) | 235 (65-1024) | 6.9 (3.7-13.3) | 2246 (1223-4348) |
| 2018 | 16.2 (10.5-25.6) | 5282 (3450-8385) | 5.1 (2.6-11.2) | 1653 (855-3662) | 11 (6.6-19.5) | 3613.4 (2154-6381) | 1.2 (0.4-4.3) | 395 (131-1407) | 9.7 (5.6-17.8) | 3172 (1820-5835) |
Data are presented as n (95% CI) of patients.
Applying our prevalence estimates to the US population, ∼3326 (95% CI, 2034-5671) total patients with CD would be estimated to be alive in the United States in 2017, with ∼2246 (95% CI, 1223-4348) estimated to have iMCD. For 2018, the corresponding numbers would be ∼5282 (95% CI, 3450-8385) patients with CD alive in the United States, of whom 3172 (95% CI, 1820-5835) would be estimated to have iMCD.
Among patients with iMCD, corticosteroid monotherapy was the most commonly used treatment (39.0%), whereas 33.1% of patients had no claims for iMCD treatments. Surprisingly, only 9.8% of patients received an IL-6–targeted therapy (siltuximab or tocilizumab; Table 1). The proportion of patients receiving other iMCD therapies, including immunomodulators, chemotherapy, or rituximab, but never IL-6–targeted therapies, was 18.1%. Of a total of 170 patients with iMCD who received any therapy, 65.3% received only a single therapeutic class during the study period, whereas far fewer patients received 2 (24.4%) or ≥3 classes (9.5%). Treatment histories for all patients with iMCD who received at least 1 iMCD therapy are depicted in supplemental Figure 1.
For the 59 patients with iMCD (23.2%) who received ≥2 classes of therapies, an analysis of their switching pattern was performed (Figure 2). Among the 37 patients who received corticosteroid monotherapy as a first-line therapy and were switched to a second-line therapy, approximately one-third (32.4%) were switched to siltuximab, with the remaining patients split between immunomodulators, chemotherapy, and rituximab. Among the 22 patients who received a noncorticosteroid as a first-line therapy and were switched to a second-line therapy, 77.2% were switched to a corticosteroid. Switching patterns among the small number of patients who switched to third- and fourth-line therapies demonstrated similar trends.
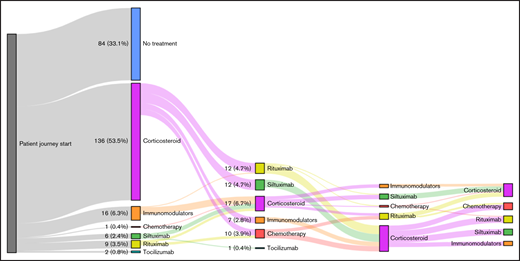
Treatment switching patterns in patients with iMCD. No treatment cohort refers to patients who had no claims for iMCD-directed treatments.
Treatment switching patterns in patients with iMCD. No treatment cohort refers to patients who had no claims for iMCD-directed treatments.
To further analyze the use of IL-6–targeted therapies among the iMCD cohort, we separated patients ever treated with an IL-6–targeted therapy (siltuximab or tocilizumab) from those who never received either IL-6–targeted therapy. The never-treated group was further divided into no treatment, corticosteroid monotherapy, and other iMCD therapy groups. Patient characteristics, presence of iMCD minor criteria, and overall disease severity as assessed by average number of minor criteria features and setting of initial diagnosis (inpatient vs outpatient) were evaluated for each group (Table 4).
Treatment analysis of patients with iMCD
| Characteristic | IL-6–targeted therapy* | Other iMCD therapy† | Corticosteroid monotherapy | No treatment |
|---|---|---|---|---|
| Total n | 25 | 46 | 99 | 84 |
| Sex | ||||
| Male | 14 (56.0) | 21 (45.7) | 45 (45.5) | 30 (35.7) |
| Female | 11 (44.0) | 25 (54.3) | 54 (54.5) | 54 (64.3) |
| Mean age ± SD, y | 47.9 ± 17.3 | 51.0 ± 15.8 | 53.8 ± 15.7 | 49.8 ± 17.8 |
| Initial iMCD diagnosis setting | ||||
| Inpatient | 12 (48.0) | 17 (37.0) | 21 (21.2) | 23 (27.4) |
| Outpatient | 13 (52.0) | 29 (63.0) | 78 (78.8) | 61 (72.6) |
| Average follow-up after iMCD diagnosis ± SD, y | 2.0 ± 1.6 | 3.4 ± 3.0 | 3.7 ± 3.4 | 1.8 ± 2.1 |
| Average n of iMCD minor criteria | 4.3 ± 2.0 | 4.2 ± 1.7 | 3.0 ± 1.0 | 3.0 ± 1.3 |
| Distribution of minor criteria‡ | ||||
| Anemia | 19 (76) | 32 (69.6) | 64 (64.6) | 59 (70.2) |
| Constitutional symptoms | 21 (84) | 42 (91.3) | 87 (87.9) | 76 (90.5) |
| Edema and effusion | 17 (68) | 33 (71.7) | 52 (52.5) | 46 (54.8) |
| Elevated CRP | 1 (4) | 3 (6.5) | 3 (3) | 2 (2.4) |
| Elevated ESR | 1 (4) | 3 (6.5) | 3 (3) | 5 (6) |
| Hemangiomatosis | 3 (12) | 4 (8.7) | 10 (10.1) | 6 (7.1) |
| Hepatosplenomegaly | 12 (48) | 17 (37) | 19 (19.2) | 13 (15.5) |
| Hypergammaglobulinemia | 2 (8) | 1 (2.2) | 6 (6.1) | 3 (3.6) |
| Proteinuria | 7 (28) | 12 (26.1) | 9 (9.1) | 8 (9.5) |
| Renal dysfunction | 12 (48) | 22 (47.8) | 30 (30.3) | 21 (25) |
| Thrombocytopenia | 10 (40) | 17 (37) | 12 (12.1) | 9 (10.7) |
| Thrombocytosis | 3 (12) | 7 (15.2) | 3 (3) | 3 (3.6) |
| LIP | 0 | 0 | 0 | 0 |
Data are presented as n (%) of patients unless otherwise indicated.
CRP, C-reactive protein; ESR, erythrocyte sedimentation rate; LIP, lymphocytic interstitial pneumonitis.
Any duration of siltuximab and/or tocilizumab therapy.
Other iMCD therapy includes immunomodulators, chemotherapy, and rituximab. Patients could have no history of siltuximab or tocilizumab therapy.
There are 11 minor criteria for iMCD, with thrombocytopenia/thrombocytosis and elevated CRP/ESR each counting as a single criterion.
The 4 iMCD treatment groups (corticosteroid monotherapy, IL-6–targeted therapy, other iMCD therapy, and no treatment) were comparable with regard to age, sex distribution, and average years of follow-up (Table 4). However, patients treated with an IL-6–targeted therapy or other iMCD therapy regimen had significantly more iMCD minor criteria at presentation compared with patients treated with corticosteroid monotherapy or those who received no treatment (supplemental Table 4). Patients treated with an IL-6–targeted therapy or other iMCD therapy regimen were more likely to have received their initial iMCD diagnosis in the inpatient setting than patients treated with corticosteroid monotherapy; there was a similar trend (P = .053) for patients treated with an IL-6–targeted therapy compared with patients who received no treatment.
Discussion
This is the first study to our knowledge to report incidence and prevalence estimates of CD and iMCD after the introduction of a CD-specific ICD-10 code and publication of international evidence-based diagnostic criteria for iMCD in 2017.3 To date, data on the epidemiology of CD come from a variety of sources that include US academic centers,12 Japan,13 the Asia-Pacific region,14 and US administrative claims databases.3 Each of these studies reported on the incidence and prevalence of CD, UCD, and MCD, but not iMCD, primarily because of the lack of available criteria and specific disease code. The adoption of iMCD diagnostic criteria, introduction of a CD-specific diagnosis code, and rigorous methodology in our study overcome these limitations to a large extent. Interestingly, the iMCD incidence and prevalence estimates in this study ranged from 3.1 to 3.4 and 6.9 to 9.7 cases per million, respectively, approximating the corresponding incidence and prevalence rates of MCD (combined HHV-8-MCD and iMCD) previously reported in the literature,3,14 suggesting that prior studies likely undercaptured iMCD cases. A prior administrative claims–based study on MCD epidemiology in the United States estimated an incidence and prevalence of 5.1 to 5.7 and 10 to 23 cases per million, respectively.4 Whereas that insurance claims–based study estimated 6500 to 7600 new CD cases annually, our estimates are lower at 1800 to 1900 new CD cases annually (95% CI, 900-4200), suggesting that the earlier study may have overestimated the incidence of CD as a result of the inclusion of non-CD cases. The previous study had several notable limitations: (1) the study predated the introduction of a CD-specific ICD-10 diagnosis code and instead relied on a nonspecific ICD code for generalized lymphadenopathy that included CD and other conditions, and (2) the study classified MCD based on the use of any systemic medications rather than HHV-8− status and presence of minor criteria. Another more recent publication estimated incidence and prevalence of MCD in Japan.13 This study identified patients with MCD based on chart review, using patients from a small rural area who were treated at 3 major medical centers. On the basis of 23 patients with MCD, the annual incidence of MCD in Japan was estimated to be 2.4 to 5.8 cases per million individuals, similar to what we found in our US population. Given the differences in prior reports and a limitation of claims data, it is likely that there is underreporting of prevalence in our study. Absence of a claim being generated for CD for a patient in a given year would result in the patient not being counted in the prevalent population in that year. Thus, a patient in remission and/or not requiring clinical contact, treatment noncompliance with failure to follow up, migration to another health care system, or death could all result in a patient not being counted in the prevalence population. This limitation would not affect incidence. Given that our study is the first to characterize the epidemiology of iMCD in the United States after the introduction of new coding and diagnostic criteria, our calculated incidence is likely to be the most accurate estimate to date.
There is a lack of consensus regarding the proportion of UCD vs MCD in the published literature.4,12,15,16 In our data set, UCD comprised 35% of all patients with CD, and iMCD accounted for 57.4% of all patients with CD. We compared our numbers with those of published studies4,12,15,16 and unpublished findings from the ACCELERATE registry of CD; our proportions are comparable to UCD (27.8%) and iMCD (33.2%) proportions in ACCELERATE (supplemental Table 5). A notable proportion of cases in ACCELERATE could not be easily classified as having UCD or iMCD: 23.7% with unknown CD subtype and MCD with unknown HHV-8 status and 5.49% with another diagnosis. The average age of our iMCD population was similar to that in prior studies, with a mean age of 51 years.15 However, there was a relative paucity of pediatric patients in our study (4.3% age <18 years), although prior literature reviews have suggested ∼11% of patients with iMCD are age <19 years.17 We found a slight predominance of women in our iMCD population (56.7% female); however, prior studies have found 38% to 56% of patients with iMCD were female.12,15
The reported prevalence of HHV-8 in patients with CD can vary greatly depending on the source of information. In a large systematic review of published literature that identified 1923 patients with iMCD over a period from January 1995 to May 2013, 42% of patients were either HHV-8+, HIV+, or both, and 33% of patients were HHV-8−. Alternatively, in the international ACCELERATE registry (unpublished data) that collects clinical and pathologic data on patients with CD longitudinally, only 3.7% (13 of 346) of those with CD were HHV-8+. In our study, the proportions of patients with CD who were HHV-8+ and HIV+ were 4% and 5.2%, respectively, comparable to ACCELERATE registry findings but lower than those reported in the systematic review. We believe that the high proportion of HHV-8+ patients with MCD reported in the systematic review likely represents publication and reporting bias; positive HHV-8 testing was historically considered to be a requirement for diagnosing MCD, so HHV-8− MCD cases would not have been published. Furthermore, the search was focused on identifying articles that reported HHV-8 or HIV status, and HHV-8 reporting improved in the latter part of the study period. The proportion of patients with CD who were HHV-8+ was reported to be very low at 0.3% to 0.4% in a recent population study on the epidemiology of CD in the United States using a claims-based administrative data set. Although it is possible that cases could have been missed given the inherent limitations of claims-based data sets, this would not be expected to occur more frequently for HIV or HHV-8 than any other codes in the data set. Given our comprehensive search methodology, we feel confident that we effectively identified and excluded HHV-8+ or HIV+ patients from our iMCD cohort.
As part of our study, we evaluated the treatment landscape of patients with iMCD and found that a larger-than-expected proportion of patients with iMCD (33.1%) received no treatment or corticosteroid monotherapy (39.0%), conflicting with established evidence-based treatment guidelines despite the life-threatening nature of iMCD.6,7 Although corticosteroids are not recommended as monotherapy or for long-term use in iMCD, we observed that corticosteroid monotherapy was the most common iMCD therapy (39.0%), most frequently used as first-line therapy in patients with iMCD (53%), and multiple patients received long-term therapy or multiple cycles of corticosteroids. IL-6–targeted therapies (siltuximab and tocilizumab) were administered in a small fraction (9.8%) of patients, most frequently following corticosteroid monotherapy. Given that siltuximab is the only FDA- and European Medicines Agency–approved treatment of iMCD based on randomized controlled trial data, and considering the morbidity and mortality associated with this condition, it is surprising that 90.2% of patients with iMCD did not receive IL-6–targeted therapy. Thus, many patients either are not receiving the recommended treatment or may be suboptimally treated, potentially contributing to poor outcomes. The underlying reasons for this large proportion of patients with iMCD not being appropriately treated are likely multifactorial. Plausible reasons include a lack of awareness about treatment options for this rare disease, limited experience or familiarity with established treatment guidelines and FDA label indications, and physicians’ perception bias regarding the symptom threshold upon which to initiate treatment. The latter assertion is supported by our study findings that showed an association between receiving treatment with severity of iMCD at presentation. Patients with a higher average number of minor clinical criteria at presentation and those hospitalized at the time of diagnosis were more likely to receive treatment. An alternative explanation for the low numbers of patients on IL-6–targeted or other iMCD therapies is that the MarketScan database does not fully capture claims for all iMCD therapies. For example, the database does not include data from specialty pharmacies, therapies received during an inpatient hospital admission, or discounted medication received directly from pharmaceutical companies through patient assistance programs or through clinical trials. Furthermore, our approach to identifying patients with iMCD may have misclassified some patients with UCD or HHV-8-MCD as having iMCD or vice versa. In line with expectations, 22 of the 25 patients treated with siltuximab in the population of all patients with CD were classified as having iMCD, and only 2 and 1 were classified as having UCD and HHV-8-MCD, respectively. Another possibility is that systemic disorders that can present with CD-like features could have cooccurred and influenced therapeutic decisions. Manual review of therapies administered to the complete iMCD study cohort did not reveal any drugs used frequently for other conditions that would support this assertion.
Despite the low number of patients on IL-6–targeted therapies, there were some notable differences between these patients and those treated with corticosteroids only or not treated. Patients treated with siltuximab or tocilizumab had a higher average number of iMCD minor criteria and were more likely to have received their first CD diagnosis during an inpatient admission rather than in an outpatient setting. These results suggest that patients with iMCD with greater disease severity (accounted for by high burden of minor criteria and diagnosis on inpatient admission) were more likely to receive IL-6–targeted therapies than patients with less severe disease. It is reassuring that patients with more severe cases are treated with targeted therapies, but this may reflect a misconception that IL-6–targeted therapies should only be initiated for highly symptomatic patients with iMCD.
The current study has several limitations. First, although the MarketScan database provides a large sample of privately insured patients and, to a lesser extent, patients with supplemental Medicare and Medicaid, the data may not adequately capture or therefore be generalizable to uninsured patients or to those who primarily receive care through governmental insurance programs. Second, administrative claims databases may have database errors or omissions, which may limit the accuracy of the data. Third, CD cases in this study were identified based on the ICD-10-CM diagnostic code and not confirmed by pathology reports, which may limit the certainty of CD diagnoses. Lastly, we classified CD cases into UCD or iMCD based on the number of minor criteria from the iMCD diagnostic criteria rather than the number of regions of enlarged lymph nodes. Claims data contain information on radiologic investigations performed for assessment of lymphadenopathy but do not provide information on the number of lymph nodes or regions involved. Because ICD-10 and CPT-4 codes were used to identify iMCD-specific diagnostic criteria, less commonly used codes, such as those for abnormal laboratory values, may be underestimated compared with actual clinical occurrence (eg, elevated erythrocyte sedimentation rate and/or C-reactive protein). This may result in underestimation of the incidence of iMCD as a portion of total patients with CD. Given the methodology used in this study, the incidence likely reflects the incidence of individuals with a new CD diagnosis, and the prevalence likely reflects the prevalence of individuals with CD currently listed in their medical record. Patients with a historical CD diagnosis for which they are currently receiving active care would have likely been identified in this study. To overcome some of these limitations, we applied rigorous criteria that included both CD-specific ICD-10 diagnosis and coding for ≥2 minor criteria to arrive at our findings. Although underestimation is a possibility with this approach, we believe the estimates in our study are more likely to be accurate. Our ability to effectively discriminate UCD from iMCD by using ≥2 clinical or laboratory abnormalities is supported by the differences in treatment patterns that would be clinically expected. The trend toward increased use of rituximab in non-iMCD cases is also consistent with the first-line therapy status of rituximab for HHV-8-MCD. The unique ICD-10 coding for CD is less than 4 years old, so it may take some time to gain familiarity and widespread use among practitioners.
Limited data exist regarding the epidemiology and treatment patterns of iMCD, and CD more generally, in the United States, particularly among patients receiving care in nonacademic settings. Administrative claims databases are valuable epidemiologic tools for studying natural history and treatment outcomes of rare diseases in the real-world setting, but the ability to do this for iMCD has previously been precluded by nonspecific diagnostic coding. Our study using a novel administrative claims–based methodology provides the most up-to-date population estimates of the incidence and prevalence of CD and iMCD in the United States and sheds light on the treatment landscape of this rare disease. Our findings highlight significant treatment gaps for patients with iMCD, a large unmet treatment need for IL-6–directed therapies, and poor adherence to treatment guidelines; the reasons for these findings must be further investigated.
Acknowledgments
The authors thank Chad Glen and David Kauffman, employees of Eversana, for their help in collecting and analyzing the data presented in this manuscript.
Authorship
Contribution: S.M., D.C.F., R.M., and B.S. jointly conceived, analyzed, and interpreted the data and critically reviewed and edited the manuscript; and J.S.P. collected and assembled the data, analyzed and interpreted the data, and drafted the manuscript.
Conflict-of-interest disclosure: D.C.F. has received research funding from Janssen Pharmaceuticals and EUSA Pharma and has a provisional patent pending related to JAK1/2 inhibition in iMCD and predictive biomarkers in iMCD. J.S.P. is a paid consultant for Eversana, LLC. R.M. and B.S. are employees of EUSA Pharma. S.M. has served on advisory boards for Celgene/Acceleron, Bristol-Myers Squibb, Novartis, Blueprint Medicines, Genentech, and AbbVie; received honoraria from the Aplastic Anemia and MDS International Foundation, Celgene (now Bristol-Myers Squibb), Bristol-Myers Squibb, McGraw Hill Hematology Oncology Board Review, and the Partnership for Health and Analytic Research, LLC; served as a consultant for BioPharm, Celgene, Novartis, and Bristol-Myers Squibb; and received research funding from Bristol-Myers Squibb (formerly Celgene), Novartis, and Jazz Pharmaceuticals.
Correspondence: Sudipto Mukherjee, 10201 Carnegie Ave, Cleveland, OH 44195; e-mail: mukhers2@ccf.org.

