

TO THE EDITOR:
The iron chelator deferasirox (DFX) can improve anemia, as observed in patients with transfusional iron overload, such as patients with myelodysplastic syndrome (MDS),1-4 myeloproliferative neoplasms,5 aplastic anemia,2,6 pure red cell aplasia,7 and the iron metabolism disorder aceruloplasminemia.8 How DFX improves anemia is unclear. It may increase erythropoietin production, improve iron availability for hematopoietic tissue,9 and modify the bone marrow (BM) microenvironment by reducing oxidative stress10,11 and inflammation.12 Here, we describe the sustained and dose-dependent erythroid improvement in a patient with constitutional variants in the TRIB2 and ABCB6 genes.
A 55-year-old woman presented with chest pain and a 2-week history of dyspnea on exertion. A diagnosis of macrocytic anemia was made (hemoglobin [Hb], 10.8 g/dL; mean corpuscular volume, 103 fL) and, 5 weeks later, she was referred to our hospital because of hyporegenerative, transfusion-dependent anemia (Hb, 7.8 g/dL). Laboratory evaluation revealed moderate thrombocytosis and leukopenia, hyperferritinemia, and elevated inflammatory parameters (C-reactive protein [CRP], α-1-globulin; Table 1). Her last documented Hb level from 2013 had been normal. She had received 1 red blood cell (RBC) transfusion a few days before the referral but no other lifetime transfusions. Further workup was notable for mild splenomegaly, type C gastritis, and IgM-κ monoclonal gammopathy of undetermined significance. RBC morphology on the peripheral blood smear was overall normal. BM examination showed mild hypercellularity, megakaryocytic and erythroid hyperplasia, impaired erythroid maturation, and interstitial lymphocytosis (Figure 1A). Plasma cell percentage was normal. Ferritin and hemosiderin were considerably increased and ring sideroblasts were absent on examination of iron staining on BM smears. The karyotype was normal, no mutations were detected with a panel of 54 genes associated with myeloid disorders, and the cause of anemia remained unclear.
Laboratory data
| Variable | Reference range | At time of referral | 15 mo after initial presentation |
|---|---|---|---|
| Hb, g/dL | 11.6-15.5 | 7.8 | |
| RBC, ×1012/L | 4.0-5.2 | 3.95 | |
| Hematocrit, % | 34.6-45.3 | 20.9 | |
| MCV, fL | 80.0-95.5 | 91.7 (103*) | |
| MCH, pg | 26.1-32.6 | 34.2 (36*) | |
| MCHC, g/dL | 31.9-35.5 | 37.3 (35*) | |
| Reticulocytes, % | 0.54-2.02 | 0.57 | |
| Red cell distribution width, % | <15 | 12.9 | |
| RPI | >2† | 0.1 | |
| Reticulocytes, ×109/L | 19.8-80.7 | 13 | |
| Platelets, ×109/L | 176-391 | 527 | |
| White blood cells, ×109/L | 4.0-10.4 | 3.29 | |
| Differential count, % | |||
| Neutrophils | 40-70 | 72 | |
| Lymphocytes | 20-40 | 22 | |
| Monocytes | 3-7 | 5 | |
| Eosinophils | 2-4 | 0 | |
| Basophils | 0-1 | 0 | |
| Iron, µg/dL | 37-145 | 63 | |
| Transferrin, mg/dL | 200-360 | 169 | |
| Transferrin saturation, % | 16-45 | 26 | |
| Ferritin, ng/mL | 15-150 | 372 | |
| Soluble transferrin receptor, mg/L | 1.9-4.4 | 0.7‡ | |
| Hepcidin, ng/mL | 1.5-41.5 | 34 | |
| Zinc protoporphyrin, µmol/mol haem | <40 | 26.5 | |
| Potassium, mmol/L | 3.5-5.1 | 4.5 | |
| Haptoglobin, mg/dL | 30-200 | 223 | |
| Lactate dehydrogenase, U/L | 135-214 | 173 | |
| Total bilirubin, mg/dL | <0.9 | 1.0 | |
| CRP, mg/L | <5 | 40 | |
| α-1-Globulin, % | 2.9-4.9 | 8.0 | |
| α-2-Globulin, % | 7.1-11.8 | 11.5 | |
| β-Globulin, % | 7.9-13.7 | 11.0 | |
| γ-Globulin, % | 11.1-18.8 | 10.9 | |
| IgA, mg/dL | 70-400 | 150 | |
| IgG, mg/dL | 700-1600 | 654 | |
| IgM, mg/dL | 40-230 | 228 | |
| Erythropoietin, mU/mL | 4.3-29 | 508 | |
| Vitamin B12, pg/mL | 197-771 | 519 | |
| Folate, ng/mL | 4.6-34.8 | 14.1 | |
| IL-2 receptor, U/mL | 158-623 | 179 | |
| IL-1 β, pg/mL | <5 | <5 | |
| IL-6, pg/mL | <7 | <1.5 | |
| IL-10, pg/mL | <9.1 | <1.0 | |
| TNF-α, pg/mL | <8.1 | 12.0 | |
| Glutathione | |||
| Total, µmol/L | 1669 | ||
| Reduced, µmol/L | 500-1500 | 1314 | |
| Oxidized, µmol/L | 25-150 | 178 | |
| Malondialdehyde, µmol/L | 0.36-1.2 | 1.5 |
IL, interleukin; MCH, mean corpuscular hemoglobin; MCHC, mean corpuscular hemoglobin concentration; MCV, mean corpuscular volume; RPI, reticulocyte production index; TNF, tumor necrosis factor.
Before red blood cell transfusions and referral to Freiburg University Hospital.
Anemia with adequate regeneration.
Determined 3 mo after initial consultation.
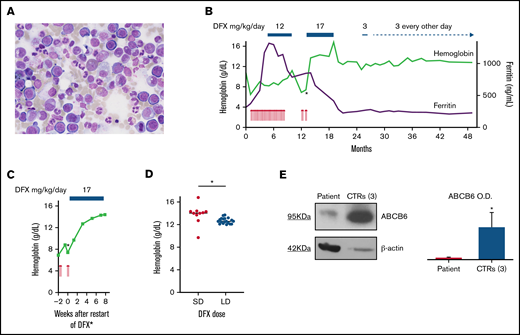
Robust and dose-dependent erythroid response of hyporegenerative anemia during DFX treatment. (A) BM morphology of the aspiration specimen obtained on initial consultation shows erythroid hyperplasia and impaired erythroid maturation without evidence of MDS or other malignancies (original magnification ×40). (B) Overview of the kinetics of Hb (green line) and ferritin (purple line) levels, transfusion requirements, and DFX dosing. Each red arrow denotes the transfusion of 1RBC unit. Within the first 8 months, a total of 29 RBC units were transfused. Periods of DFX treatment are indicated at the top. Changes in line thickness reflect changes in drug dose. The asterisk marks the start of the DFX rechallenge, a closer view of which is provided in panel C. Ferritin levels were already increased on initial presentation and continued to rise during transfusion therapy until DFX treatment was initiated. Subsequently, ferritin levels declined and stabilized at slightly elevated levels of >200 ng/mL. (C) Rapid increase in Hb levels within a few weeks after restart of DFX treatment. The corresponding time point in panel B is indicated by an asterisk. Of note, CRP was elevated to 57.9 mg/L at week 0 and normalized to <3 mg/L (without any antibiotics) at week +7. (D) Dose-dependent distribution of Hb levels during DFX treatment. Standard-dose (SD) DFX was administered between months 13 and 19, and low-dose (LD) DFX between months 25 and 49 after initial presentation. Hb levels were significantly higher during SD (17 mg/kg/d) than during LD (3 mg/kg/d or even every other day) DFX treatment (median Hb of 14.1 g/dL vs 12.6 g/dL; P = .02 by unpaired t test). Horizontal lines represent the median; asterisk indicates statistical significance. (E) (Left) Representative immunoblot of ABCB6 protein in the membrane of RBC lysate of the proband and a pool of 3 healthy controls. β-actin is the loading control. (Right) Quantification by densitometric analysis from 3 separate western blots with similar results. Data are means ± standard deviation (*P < .05). OD, optical density.
Robust and dose-dependent erythroid response of hyporegenerative anemia during DFX treatment. (A) BM morphology of the aspiration specimen obtained on initial consultation shows erythroid hyperplasia and impaired erythroid maturation without evidence of MDS or other malignancies (original magnification ×40). (B) Overview of the kinetics of Hb (green line) and ferritin (purple line) levels, transfusion requirements, and DFX dosing. Each red arrow denotes the transfusion of 1RBC unit. Within the first 8 months, a total of 29 RBC units were transfused. Periods of DFX treatment are indicated at the top. Changes in line thickness reflect changes in drug dose. The asterisk marks the start of the DFX rechallenge, a closer view of which is provided in panel C. Ferritin levels were already increased on initial presentation and continued to rise during transfusion therapy until DFX treatment was initiated. Subsequently, ferritin levels declined and stabilized at slightly elevated levels of >200 ng/mL. (C) Rapid increase in Hb levels within a few weeks after restart of DFX treatment. The corresponding time point in panel B is indicated by an asterisk. Of note, CRP was elevated to 57.9 mg/L at week 0 and normalized to <3 mg/L (without any antibiotics) at week +7. (D) Dose-dependent distribution of Hb levels during DFX treatment. Standard-dose (SD) DFX was administered between months 13 and 19, and low-dose (LD) DFX between months 25 and 49 after initial presentation. Hb levels were significantly higher during SD (17 mg/kg/d) than during LD (3 mg/kg/d or even every other day) DFX treatment (median Hb of 14.1 g/dL vs 12.6 g/dL; P = .02 by unpaired t test). Horizontal lines represent the median; asterisk indicates statistical significance. (E) (Left) Representative immunoblot of ABCB6 protein in the membrane of RBC lysate of the proband and a pool of 3 healthy controls. β-actin is the loading control. (Right) Quantification by densitometric analysis from 3 separate western blots with similar results. Data are means ± standard deviation (*P < .05). OD, optical density.
The patient subsequently required about 4 RBC units per month (Figure 1B) because of symptomatic anemia. After 4 months and a total of 15 transfusions, iron chelation therapy (DFX 12 mg/kg daily) was initiated because of iron overload indicated by serum ferritin levels (Figure 1B). Four months after starting DFX, Hb levels increased, the patient became transfusion-independent, and DFX was stopped. However, 2 months later, erythroid normalization was lost. Findings of a BM reexamination were unchanged from initial consultation. Three weeks after reinitiated transfusions plus standard-dose DFX (17 mg/kg daily), Hb levels increased and the patient became transfusion-independent again, this time within several weeks (Figure 1C). DFX remained the only plausible cause of this second remission of anemia and the regained erythroid response was maintained (median Hb, 14.1 g/dL; Figure 1B,D) with DFX. Six months later, treatment was interrupted because of cholestatic liver disease, Coombs-negative hemolysis, abdominal discomfort, and cholecystolithiasis. Both the cholestatic disease and the hemolysis were presumed to be due to DFX because no other cause could be identified, and liver and hemolysis parameters normalized after stopping DFX. The patient subsequently maintained Hb levels ≥12 g/dL for 6 months without DFX (Figure 1B).
When the Hb level eventually dropped below a (predefined) threshold of 12 g/dL, DFX was restarted, but, given its apparent potency upon erythropoiesis, at a markedly reduced dose (3 mg/kg, initially daily, then every other day; Figure 1B). After >2 years of low-dose DFX and a sustained erythroid response (median Hb, 12.6 g/dL; Figure 1D), the patient continues to be on the drug at this dose. Of note, Hb levels during low-dose DFX were significantly lower than during standard dose (Figure 1D; P = .02).
To identify pathogenic mutations linked to the response of this anemia to DFX, we performed whole‐exome sequencing (WES), after obtaining informed written consent, of peripheral blood samples of the patient and her father. Her mother had already died. Details of WES and immunoblotting are provided in the supplemental Methods.
Comparison of variants between the patient and her father revealed 2 genes that were unique to the patient and showed links to hematopoietic/iron-related phenotypes. First, we detected a compound mutation in ABCB6 in the patient but not the father: NM_005689:c.C764G, p.P255R - rs1316630944 - (C = 1/244992; GnomAD_exome) predicted as likely pathogenic by InterVar (American College of Medical Genetics and Genomics [ACMG]/Association for Molecular Pathology 2015 guideline); NM_005689:c.G575A, p.R192Q - rs150221689 - T = 0.00345 (864/250726; GnomAD_exome), CM1411559 (Human Gene Mutation Database). The variant p.R192Q reduces ABCB6 expression in RBCs and causes Langereis (Lan)− group.13-15
Second, we found a homozygous missense variant, p.His4Arg (predicted as of uncertain significance according to ACMG/Association for Molecular Pathology guidelines) in the TRIB2 gene (rs55813198, G = 0.01, 3249/251418; GnomAD_exome; heterozygous in the father). TRIB2, a member of the Tribbles family of pseudokinases,16 plays a role in leukemogenesis,17 malignant melanoma,18 and autoimmune uveitis.19
Sanger sequencing of ABCB6 and TRIB2 in hematopoietic cells and germline DNA from fingernails confirmed the variants to be constitutional. ABCB6 protein expression in the plasma membrane of RBCs of the patient was decreased compared with healthy controls (Figure 1E), demonstrating that the ABCB6 variants cause a loss-of-function phenotype and a Lan− group.
Though we acknowledge that the DFX-induced reversal of unexplained anemia constitutes a temporal association in a single patient and that there is a possibility of a chance association, different mechanisms might underlie the time- and dose-dependent relationship between DFX and erythropoiesis. Whereas the gradual Hb increase over several months leading to the first remission may be compatible with effective chelation, the rapid increase within weeks after restarting DFX implies a direct effect on erythropoiesis (Figure 1C). Temporary higher dosing might have optimized iron chelation and reduced DFX dependency later during management. Because CRP levels declined as erythropoiesis improved, we hypothesized that DFX alleviated the suppressive effect of inflammation on erythropoiesis and iron availability. Results of hepcidin and cytokine levels, determined after Hb levels had normalized, were consistent with an absence of inflammation at that time (Table 1). In cases of patients with MDS and transfusional iron overload,1,2 DFX is presumed to improve erythropoiesis by reducing oxidative stress and NF-κB activity. Other iron-chelating agents (deferiprone or deferoxamine) do not reduce NF-κB activity,12 suggesting that DFX responsiveness may be unrelated to iron chelation.
WES revealed variants in TRIB2 and ABCB6. Though we cannot exclude that the patient’s mother harbored these mutations, they may be related to the patient’s phenotype of DFX-responsive dyserythropoiesis. Trib2 is expressed in murine hematopoietic progenitors and lymphoid and early erythroid lineages, and Trib2-deficient mice show macrocytic anemia and increased sensitivity to hemolytic stress.20 The TRIB2 variant found in the patient is predicted as of uncertain significance according to ACMG guidelines. Therefore, we can only hypothesize that this variant in the homozygous state can cause loss of function, which would be consistent with the patient’s phenotype resembling that of Trib2-deficient mice. ABCB6 transports porphyrin in nucleated cells21 and bears the Lan blood group antigen system in erythrocyte membranes.22 Our patient carries a Lan− blood group caused by ABCB6 loss-of-function mutations.22 Her lack of anti-Lan alloimmunization despite transfusion exposures suggests that the total number of transfusions was insufficient to trigger alloimmunization. It is possible that ABCB6 loss of function contributed to hyperferritinemia because recent data link ABCB6 to ferroptosis,23 and ABCB6 overexpression reduces cytosolic reactive oxygen species and protects against arsenite, which induces oxidative stress and ferroptosis.24
The late onset of anemia suggests that, in addition to a genetic predisposition, other factors such as unknown environmental triggers and epigenetic mechanisms contributed to disease development. To establish a link between DFX response and the variants, more studies are needed, examining for example the effect of DFX on the patient’s peripheral blood or BM using colony-forming unit assays, and the effect of TRIB2 variants and DFX on TRIB2 expression.
In summary, DFX treatment reversed hyporegenerative, transfusion-dependent anemia in a patient with TRIB2 and ABCB6 mutations in a robust and dose-dependent manner. Constitutional variants in TRIB2 and ABCB6 could account for a digenic condition that might underlie the pathogenesis of anemia and its response to DFX.
Acknowledgments: The authors thank Drs. Tobias Berg, Heiko Becker, Jürgen Finke, Heike Pahl, and Daniela Cilloni for helpful discussions. J.S. is a Fellow of the SUCCESS program of the Department of Hematology, Oncology and Stem Cell Transplantation of the University of Freiburg Medical Center.
Contribution: J.S. collected clinical data, analyzed and interpreted data, and wrote the manuscript; P.R.-P. performed experiments, analyzed and interpreted data, and edited the manuscript; D.P. performed experiments and analyzed and interpreted data; I.A. performed experiments, analyzed and interpreted data, and edited the manuscript; A.I. and M.U.M. analyzed and interpreted data and edited the manuscript; and M.L. provided patient care, designed research, interpreted data, and wrote the manuscript.
Conflict-of-interest disclosure: A.I. participates in the advisory board for Celgene. M.U.M. participated in the advisory board for Novartis and received research funding from Novartis. The remaining authors declare no competing financial interests.
Correspondence: Michael Lübbert, Department of Hematology, Oncology and Stem Cell Transplantation, University of Freiburg Medical Center, Hugstetter Str. 55, D-79106 Freiburg, Germany; e-mail: michael.luebbert@uniklinik-freiburg.de.

