

Key Points
Point estimates of survival and FFS at 6 months from second-line treatment for acute GVHD were 64% and 46%, respectively.
We identify risk factors and provide models to predict 6- and 12-month mortality after second-line systemic treatment for acute GVHD.

Abstract
Acute graft-versus-host disease (GVHD) requiring second-line treatment represents a highly morbid complication of allogenic hematopoietic cell transplantation (HCT). Recent studies have defined short-term outcomes after second-line treatment for acute GVHD, but longer-term outcomes have not been well defined. We examined overall survival (OS) and failure-free-survival (FFS) of 216 patient who had HCT who received second-line treatment for acute GVHD. Failure time for FFS was defined as the earliest of death, relapse, or implementation of third-line treatment. Multivariable Cox regression was used to identify risk factors for mortality and failure, and predictive models were derived for 6- and 12-month mortality. Point estimates of OS at 6 and 12 months were 59% (95% confidence interval [CI], 52-65) and 52% (95% CI, 45-68), respectively. Point estimates of FFS at 6 and 12 months were 42% (95% CI, 35-48) and 37% (95% CI, 31-43), respectively. Predictive models for both end points included serum albumin and total bilirubin concentrations at the onset of second-line treatment, patient age at onset of second-line therapy, and a combination of abdominal pain/stage 4 gut involvement. Optimism-corrected areas under the receiver-operator characteristic curve and Brier scores were 77.4 and 0.169 for 6-month mortality, respectively, and 80.0 and 0.169 for 12-month mortality. We identify risk factors associated with mortality and failure after second-line treatment of acute GVHD, provide historical benchmarks for assessment of FFS and OS in other studies, and propose predictive models for 6- and 12-month mortality that could be used to generate population-specific benchmarks.
Introduction
Acute graft-versus-host disease (GVHD) remains a significant cause of morbidity and mortality after allogenic hematopoietic cell transplantation (HCT). Initial treatment with corticosteroids produces sustained responses in less than 50% of patients.1 Many retrospective and prospective studies have evaluated interventions for patients with GVHD that has not responded to initial corticosteroid treatment, but very few randomized controlled trials have tested treatments for this indication.1-9 Evaluation of results in these studies has been complicated by the heterogeneity in the patient population (eg, patient age, conditioning regimens, donor type, GVHD prophylaxis, type of HCT, and variable organ involvement), lack of a clear definition of steroid-refractory disease, and inconsistent study end points.
Despite decades of research and efforts to improve outcomes, patients who require second-line systemic treatment for acute GVHD have a poor prognosis.8,10 , -14 Review of experience at 2 different centers showed approximately 50% survival rates at 6 months and 30% to 35% at 12 months after starting second-line treatment.15,16 In randomized prospective trials, survival rates at 6 months after enrollment have ranged from 40% to 50% in studies that used horse antithymocyte globulin (ATG),3 rabbit ATG,5,17 or best available therapy6,7 as the control for investigational second-line treatment in adult or mixed adult and pediatric cohorts of patients. In a review of studies published between 1990 and 2011, the weighted average 6-month survival rate in retrospective or prospective studies of steroid-refractory or treatment-refractory acute GVHD was 49%,1 and in a subsequent review of studies published after 2011, the weighted average 6-month survival rate was 55%.8
We conducted the current retrospective study to assess overall survival (OS) after second-line treatment of acute GVHD in patients who had received corticosteroids as initial treatment. We also evaluated failure-free survival (FFS), a composite end point defined as the earliest of death, relapse, or implementation of third-line treatment, and we examined potential risk factors for both mortality and failure. Last, we developed predictive models for both 6- and 12-month mortality and evaluated their performance by estimating the area under the receiver-operator characteristic curve (AUC) and Brier score for each outcome.
Methods
Patients and data collection
The study cohort included patients who received second-line systemic treatment of acute GVHD at the Fred Hutchinson Cancer Research Center (FHCRC)/Seattle Cancer Care Alliance from January 2006 through August 2018, regardless of the indication for transplantation, the conditioning regimen, graft source, donor relationship, or HLA matching. Patients had given consent allowing the use of medical records for research, as approved by the FHCRC Institutional Review Board. During this time, 3472 allogeneic transplantations were done at our center. Of these, 2161 received initial systemic treatment for acute GVHD. Nearly all were treated with prednisone at doses ranging from 0.5 to 2.0 mg/kg per day. The database identified 257 patients who received a new systemic treatment for acute GVHD after initial treatment with prednisone, representing 12% of all patients who received first-line treatment. Of these, we excluded 5 with recurrent malignancy or diagnosis of chronic GVHD before the change, 7 for whom the change was motivated by toxicity of an agent used for prophylaxis, 10 who had changes for other reasons such as low donor chimerism or difficulty controlling blood concentrations of agents used for prophylaxis, 1 who withdrew consent to use data for research, and 18 with inadequate information, leaving 216 patients included in the analysis. Follow-up clinical information was available from medical records submitted by referring physicians and from documentation generated by a dedicated long-term follow-up clinical program.
Definitions
Acute GVHD was graded according to previously described criteria.18 FFS was defined by the absence of treatment change, nonrelapse mortality, and recurrent malignancy. Abdominal pain requiring extended opioid treatment was defined as severe. Stage 4 GVHD was defined by the presence of overt hemorrhage or severe abdominal pain.
Statistical analysis
Both OS and FFS were treated as time-to-event outcomes. Failure time for the composite end point of FFS was defined as the earliest of death, relapse, or implementation of third-line treatment. Survival and FFS after second-line treatment were estimated using the Kaplan-Meier method. To estimate the contribution of each component of failure to FFS, cumulative incidence estimates of recurrent malignancy, nonrelapse mortality, and treatment change were derived, treating each event as a competing risk for the other 2.19
Cox regression was used to assess the association of various factors with the hazards of failure associated with each of these outcomes. In Cox regression models, factors having a likelihood ratio P ≤ .05 for association with mortality or failure in univariate testing were initially assessed for inclusion in appropriate multivariable models, but other factors were also considered even if the univariate model yielded a P > .05. Because of collinearity of various factors, the likelihood ratio test was used to determine which factors ultimately were included in the multivariable model for each end point. Factors at initiation of second-line treatment that were considered for inclusion in multivariable models and predictive models included pretransplant Hematopoietic Cell Transplant Comorbidity Index (HCT-CI), age at second-line treatment, time from transplant to first treatment, time from first treatment to second-line treatment, serum albumin and total bilirubin concentrations, any abdominal pain, presence of stage 4 gut involvement (defined as presence of severe abdominal pain requiring opioid treatment or presence of overt gastrointestinal bleeding), presence of fever, evidence of active infection, number of previous autologous or allogeneic transplants, skin GVHD stage at second-line treatment, percentage of body surface with rash, prednisone-equivalent steroid dose at time of second-line treatment, and agents used for second-line treatment. For the multivariable analyses, a model was fit from among variables other than the agent used for second-line treatment variables, and then the agent used for second-line treatment was added to this model. All noncategorical variables were modeled as continuous linear variables in the regression models.
Models for 6- and 12-month mortality were derived by using step-wise logistic regression (all patients had complete follow-up to 1 year), and the corresponding areas under the receiver-operator characteristic curves (AUC) and Brier scores were estimated as a means of assessing model discrimination and performance. The Brier score measures the accuracy of probability predictions and is equivalent to the mean square error but with outcomes being binary (dead [1] or alive [0]). The difference between the observed outcome (0 or 1) and the predicted probability of the outcome (ranging from 0 to 1) is squared for each patient, and the average of these squared differences is taken across all patients. As such, the score has a range from 0 to 1, where a score of 0 indicates perfect accuracy and a score of 1 indicates perfect inaccuracy. Because these performance measures were derived from the same data used to build the models, the inflation (for AUC) and deflation (for Brier score) were estimated using Harrell’s optimism.20,21 Harrell’s optimism for Brier scores and AUC was estimated from 200 bootstrap samples of 216 patients that were randomly generated, with replacement, and a model was generated for each bootstrap sample using stepwise logistic regression.22 This model was then applied to the original population of 216 patients, and the metrics from both the bootstrap sample and the original population were estimated. The average difference in metrics between these groups across the 200 bootstrap samples served as the estimate of optimism for each performance measure. These bootstrap samples serve as replicate development samples, allowing for correction of the overestimation of model performance that results from overfitting in the model-building process, thereby yielding an anticipated estimate of performance that might be expected in an independent data set.
Calibration for predictive models was assessed using calibration curves that show a locally estimated scatterplot smoother through the observed vs predicted probabilities of 6- and 12-month mortality based on the models. Calibration slope and intercept were estimated by regressing (via logistic regression) the observed 6- and 12-month probabilities on the logit of the predicted 6- and 12-month probabilities, respectively. The optimism in the slope and intercept was estimated using the same bootstrap approach described above.
Results
Patient characteristics
The analysis included 216 patients, representing 6.2% of the 3472 allogeneic transplantations at our center from January 2006 through August 2018. Patient characteristics are summarized in Table 1. The median age of patients was 41 years (range, 1-76 years). Of the 216 patients, 125 (58%) were prepared with high-dose conditioning regimens, 130 (60%) received mobilized PBSC graft, 33 (15%) had HLA-matched related donors, 100 (46%) had HLA-matched unrelated donors, and 83 (39%) had HLA-mismatched related or unrelated donors. One hundred seven (50%) patients had a pretransplant HCT-CI score of 3 or higher.
Patient characteristics (N = 216)
| Characteristic | n (%) |
|---|---|
| Patient age at onset of second-line treatment, y | |
| Median | 41 |
| Range | 1-76 |
| <12 y | 38 (18) |
| 12-17 | 17 (8) |
| 18-39 | 47 (22) |
| 40-59 | 70 (32) |
| 60 | 44 (20) |
| Patient sex | |
| Female | 97 (45) |
| Donor-patient sex combination | |
| Female to male | 46 (21) |
| Diagnosis at transplant | |
| Myeloid malignancy | 115 (53) |
| Lymphoid malignancy | 66 (31) |
| Other/nonmalignant | 35 (16) |
| Disease risk at transplant* | |
| Low risk | 7 (3) |
| Standard risk | 179 (83) |
| High risk | 30 (14) |
| Conditioning regimen | |
| High dose without total body irradiation | 65 (30) |
| High dose with total body irradiation | 60 (28) |
| Reduced intensity | 91 (42) |
| Graft source | |
| Bone marrow | 53 (25) |
| PBSCs | 130 (60) |
| Cord blood | 33 (15) |
| Donor and HLA type | |
| HLA-matched related | 33 (15) |
| HLA-matched unrelated | 100 (46) |
| HLA antigen or allele-mismatched related | 12 (6) |
| HLA antigen or allele-mismatched unrelated | 71 (33) |
| GVHD prophylaxis | |
| Cyclosporine or tacrolimus | 208 (96) |
| Methotrexate or mycophenolate mofetil | 204 (94) |
| Sirolimus | 5 (2) |
| Posttransplant cyclophosphamide | 19 (9) |
| HCT-CI before transplantation | |
| 3 | 107 (50) |
| Prior allogeneic transplantation | 35 (16) |
Low-risk diseases included chronic myeloid leukemia (CML) in chronic phase; high-risk diseases included acute leukemia not in remission, CML in blast crisis, refractory anemia with excess blasts (RAEB), or RAEB in transformation and myeloma; all other diseases and stages were categorized as standard risk.
Patient characteristics at initial second-line treatment are summarized in Table 2. We could not assign overall GVHD grades at the onset of second-line treatment in this retrospective review because reliable stool volume measurements were not available for many patients. Immediately before initial second-line treatment, prednisone doses were <1.0 mg/kg daily in 24 patients (11%), ≥1.0 but <2.0 mg/kg daily in 64 (30%), and ≥2.0 mg/kg daily in 128 (50%). No patient received prednisone at >2.5 mg/kg per day. Sixty-seven (31%) started second-line treatment less than 14 days after the onset of systemic steroid treatment. At the onset of second-line treatment, 28 patients (13%) had serum total bilirubin concentrations ≥2.0 mg/dL, 29 (13%) had serum albumin concentrations <2.0 g/dL, 135 (63%) had diarrhea, 93 (43%) had abdominal pain, 9 (4%) had overt gastrointestinal bleeding, 98 (45%) had rash, 13 (6%) had fever, and 44 (20%) had documented concurrent active infection.
Patient characteristics at the onset of second-line treatment (N = 216)
| Characteristic | n (%) |
|---|---|
| Prednisone-equivalent steroid dose immediately before second-line treatment | |
| 1 mg/kg daily | 24 (11) |
| 1.0 but < 2.0 mg/kg daily | 64 (30) |
| 2.0 mg/kg daily | 128 (59) |
| Less than 14 d from transplant to first treatment | 45 (21) |
| Less than 14 d from first treatment to second treatment | 67 (31) |
| Bilirubin (mg/dL) at time of second-line treatment | |
| 1.0 | 124 (57) |
| 1.0-1.9 | 64 (30) |
| 2.0-3.9 | 16 (7) |
| 4.0 | 12 (6) |
| Albumin (g/dL) | |
| 4.0 | 15 (7) |
| 3.0-3.9 | 80 (37) |
| 2.0-2.9 | 92 (43) |
| 1.0-1.9 | 29 (13) |
| Any diarrhea | 135 (63) |
| No abdominal pain, no stage 4 gut | 121 (56) |
| Any abdominal pain, no stage 4 gut | 52 (24) |
| No abdominal pain, stage 4 gut | 2 (1) |
| Any abdominal pain, stage 4 gut | 41 (19) |
| Overt gastrointestinal hemorrhage | 9 (4) |
| Stage 4 gut GVHD (severe abdominal pain or overt hemorrhage) | 98 (45) |
| Rash | |
| Stage 1 | 10 (5) |
| Stage 2 | 23 (11) |
| Stage 3 | 61 (28) |
| Stage 4 | 4 (2) |
| Presence of fever | 13 (6) |
| Presence of active infection | 44 (20) |
Outcomes after second-line treatments
Second-line treatments were ATG (21%), mycophenolate (20%), sirolimus (19%), α1 antitrypsin (9%), extracorporeal photopheresis (7%), infliximab (7%), or other (17%). Point estimates of OS after second-line treatment were 59% (95% confidence interval [CI], 52-65) and 52% (95% CI, 45-59) at 6 and 12 months, respectively (Figure 1A). Point estimates of FFS were 42% (95% CI, 35-48) and 37% (95% CI, 31-43) at 6 and 12 months, respectively (Figure 1B). New systemic treatment and death were the predominant categories of treatment failure. At 2 years, cumulative incidence frequencies for new systemic treatment and death were 29% and 31%, respectively, compared with 7% for recurrent malignancy (Figure 1C).
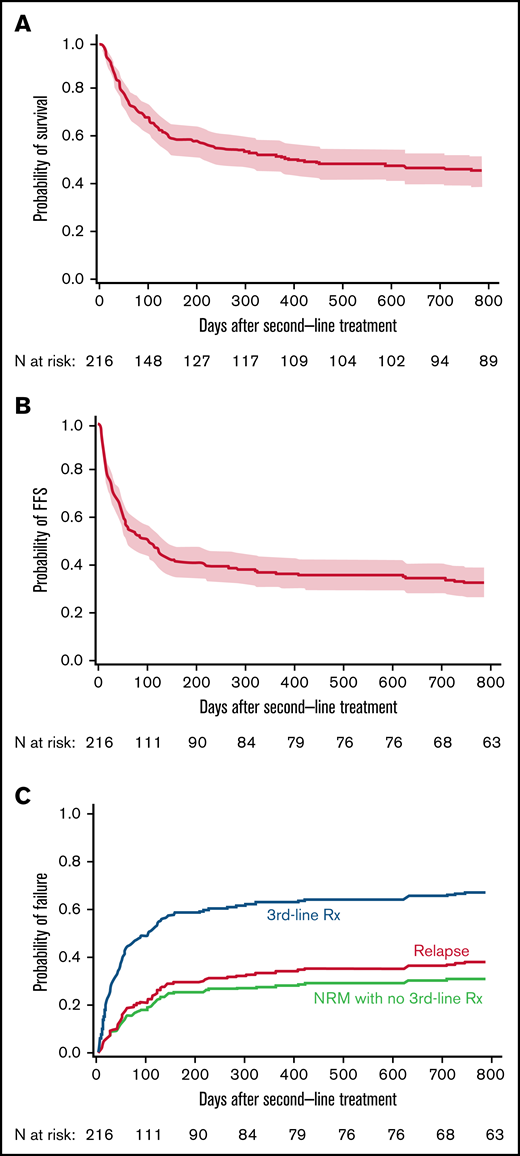
Third-line treatment and non-relapse mortality without third-line treatment account for most failures after second-line treatment. (A) Survival, (B) FFS, and (C) causes of failure after second-line treatment of GVHD. Dotted lines above and below the Kaplan-Meier survival plot (solid line) show the pointwise 95% CI.
Third-line treatment and non-relapse mortality without third-line treatment account for most failures after second-line treatment. (A) Survival, (B) FFS, and (C) causes of failure after second-line treatment of GVHD. Dotted lines above and below the Kaplan-Meier survival plot (solid line) show the pointwise 95% CI.
Risk factors associated with overall mortality
In univariate analyses (Table 3), factors statistically associated with risk of overall mortality included older patient age, longer interval time from transplant to first treatment, higher serum total bilirubin concentration (per mg/dL increase), lower serum albumin concentration (per g/dL decrease), presence of diarrhea, abdominal pain, stage 4 gut involvement, overt gastrointestinal bleeding or rash, higher steroid dose (per mg/kg prednisone equivalent), and higher HCT-CI. Given the association between abdominal pain and stage 4 gut involvement, these factors were combined into one as summarized in Table 3. Second-line treatment agent was also associated with risk of mortality in univariate analysis. Transplant number, transplant year, interval time from initial systemic treatment to onset of second-line treatment, fever, and active infection were not statistically associated with the risk of overall mortality. In multivariable analysis (after forcing second-line treatment agent into the model), the risk factors for overall mortality that remained included older patient age, lower serum albumin concentration, higher serum total bilirubin concentration, and the combined stage 4 gut/abdominal pain. After adjusting for these factors, second-line treatment showed no statistically significant evidence of an association with the risk of mortality (global P = .39).
Patient, disease, and treatment characteristics associated with risk of mortality
| Characteristic at start of second-line treatment | Univariate analysis | Multivariable analysis | ||||
|---|---|---|---|---|---|---|
| HR | 95% CI | P | HR | 95% CI | P | |
| Age at second-line treatment (per decade) | 1.34 | 1.22-1.46 | .0001 | 1.22 | 1.10-1.35 | .0002 |
| Weeks from transplant to first treatment (per week) | 1.09 | 1.02-1.16 | .007 | |||
| Bilirubin (per mg/dL) | 1.16 | 1.07-1.26 | .0004 | 1.17 | 1.07-1.28 | .001 |
| Albumin (per g/dL decrease) | 2.53 | 1.96-3.25 | .0001 | 1.83 | 1.30-2.57 | .0005 |
| Diarrhea | 2.06 | 1.42-3.00 | .0002 | |||
| Any abdominal pain | 2.54 | 1.80-3.58 | .0001 | |||
| Stage 4 gut | 3.57 | 2.42-5.28 | .0001 | |||
| No abdominal pain, no stage 4 gut | Ref† | NA | NA | Ref† | NA | NA |
| Any abdominal pain, no stage 4 gut* | 1.81 | 1.20-2.75 | .005 | 1.17 | 0.71-1.91 | .54 |
| Any abdominal pain with stage 4 gut | 4.39 | 2.86-6.73 | <.0001 | 2.96 | 1.76-4.98 | <.0001 |
| Overt gastrointestinal hemorrhage | 4.07 | 2.04-8.13 | .0001 | |||
| HCT-CI (per unit) | 1.24 | 1.14-1.34 | .0001 | |||
| Steroid dose (per mg/kg prednisone equivalent) | 1.74 | 1.22-2.47 | .002 | |||
| Skin stage (per stage) | 0.83 | 0.73-0.94 | .004 | |||
| Body surface with rash (per 10%) | 0.92 | 0.87-0.97 | .001 | |||
| Number of prior transplants | 1.04 | 0.70-1.55 | .84 | |||
| Transplant year (per year) | 1.04 | 0.99-1.09 | .09 | |||
| Weeks from first treatment to second treatment (per week) | 0.97 | 0.93-1.01 | .16 | |||
| Fever | 0.64 | 0.26-1.57 | .33 | |||
| Active infection | 0.81 | 0.51-1.26 | .35 | |||
| Agent | Global P = .39 | |||||
| Extracorporeal photopheresis | Ref† | NA | NA | Ref† | NA | NA |
| α-1 antitrypsin | 3.72 | 1.34-10.35 | .01 | 1.45 | 0.51-4.14 | .49 |
| ATG | 4.42 | 1.73-11.25 | .002 | 1.74 | 0.66-4.58 | .27 |
| Infliximab | 2.26 | 0.76-6.75 | .14 | 1.33 | 0.43-4.09 | .62 |
| Mycophenolate mofetil (not used for prophylaxis) | 1.61 | 0.61-4.23 | .34 | 1.69 | 0.62-4.64 | .31 |
| Sirolimus | 1.40 | 0.52-3.79 | .50 | 1.47 | 0.54-3.98 | .45 |
| Other | 3.37 | 1.29-8.75 | .01 | 2.51 | 0.95-6.59 | .06 |
HR, hazard ratio; NA, not applicable.
This group also included the 2 patients with no abdominal pain and stage 4 gut involvement because of overt hemorrhage.
Reference groups were used as the comparison for other groups.
Risk factors associated with treatment failure
In univariate analyses (Table 4), factors statistically associated with the risk of treatment failure included older patient age, longer interval time from initial systemic treatment to onset of second-line treatment, higher serum total bilirubin concentration (per mg/dL increase), lower serum albumin concentration (per g/dL decrease), presence of diarrhea, abdominal pain, stage 4 gut involvement, abdominal pain/stage 4 gut involvement, overt gastrointestinal bleeding or rash, higher steroid dose (per mg/kg prednisone equivalent), and higher HCT-CI. Second-line treatment agent was also associated with risk of failure in univariate analysis. Transplant number, transplant year, interval time from transplant to initial systemic treatment, fever, and active infection were not statistically associated with risk of treatment failure. In multivariable analysis, lower serum albumin concentration, higher total serum bilirubin concentration, and the combined variable stage 4 gut/abdominal pain showed an association with treatment failure. After adjusting for these factors, second-line treatment agent showed no statistically significant evidence of an association with the risk of failure (global P = .69).
Patient, disease, and treatment characteristics associated with risk of failure (new treatment, relapse, or death)
| Characteristic at start of second-line treatment | Univariate analysis | Multivariable analysis | ||||
|---|---|---|---|---|---|---|
| HR | 95% CI | P | HR | 95% CI | P | |
| Age at second-line treatment (per decade) | 1.16 | 1.07-1.25 | .0002 | |||
| Weeks from transplant to first treatment (per week) | 1.05 | 0.99-1.12 | .10 | |||
| Bilirubin (per mg/dL increase) | 1.15 | 1.07-1.24 | .0002 | 1.18 | 1.08-1.28 | .0002 |
| Albumin (per g/dL decrease) | 2.27 | 1.82-2.84 | .0001 | 1.87 | 1.42-2.46 | .0001 |
| Diarrhea | 2.13 | 1.50-3.01 | .0001 | |||
| Any abdominal pain | 2.10 | 1.53-2.89 | .0001 | 1.39 | 0.94-2.06 | .10 |
| Stage 4 gut | 2.61 | 1.81-3.78 | .0001 | |||
| No abdominal pain, no stage 4 gut | Ref† | NA | NA | Ref† | NA | NA |
| Any abdominal pain, no stage 4 gut* | 1.65 | 1.12-2.41 | .01 | 1.17 | 0.71-1.91 | .54 |
| Any Abdominal pain with stage 4 gut | 3.06 | 2.05-4.56 | <.0001 | 2.96 | 1.76-4.98 | <.0001 |
| Overt GI hemorrhage | 3.53 | 1.78-7.01 | .0003 | |||
| HCT-CI (per unit) | 1.12 | 1.04-1.22 | .004 | |||
| Steroid dose (per mg/kg prednisone equivalent) | 1.73 | 1.25-2.39 | .0001 | |||
| Skin stage (per stage) | 0.78 | 0.69-0.88 | .0001 | |||
| Body surface with rash (per 10%) | 0.90 | 0.86-0.95 | .0001 | |||
| Number of prior transplants | 1.19 | 0.84-1.70 | .33 | |||
| Transplant year (per year) | 1.03 | 0.99-1.08 | .15 | |||
| Weeks from first treatment to second treatment (per week) | 0.96 | 0.92-1.00 | .05 | |||
| Fever | 0.82 | 0.39-1.76 | .62 | |||
| Active infection | 0.88 | 0.58-1.32 | .54 | |||
| Agent | Global P = .69 | |||||
| Extracorporeal photopheresis | Ref† | NA | NA | Ref† | NA | NA |
| α-1 antitrypsin | 3.08 | 1.37-6.94 | .007 | 1.58 | 0.68-3.67 | .29 |
| ATG | 2.07 | 1.00-4.28 | .05 | 1.12 | 0.52-2.40 | .77 |
| Infliximab | 1.69 | 0.71-4.01 | .24 | 1.04 | 0.43-2.52 | .94 |
| Mycophenolate mofetil (not used for prophylaxis) | 0.88 | 0.41-1.88 | .73 | 1.03 | 0.47-2.27 | .94 |
| Sirolimus | 0.96 | 0.45-2.08 | .92 | 0.98 | 0.45-2.11 | .96 |
| Other | 1.59 | 0.75-3.37 | .23 | 1.42 | 0.67-3.04 | .36 |
HR, hazard ratio; NA, not applicable.
This group also included the 2 patients with no abdominal pain and stage 4 gut involvement because of overt hemorrhage.
Reference groups were used as the comparison for other groups.
Predictive models for 6- and 12-month mortality
The same factors identified in the Cox model for overall mortality were identified for predictive models for both 6- and 12-month mortality. Summarized in Table 5 are various metrics for both discrimination and calibration for these models, along with corresponding optimism-corrected estimates. Figure 2 shows the calibration curves for 6- and 12-month mortality. Also shown in Table 5 are the estimated coefficients for the various factors included in the models. The values for these coefficients can be used to estimate the predicted probability of 6- or 12-month death as shown for a hypothetical patient in Figure 2.
Performance metrics from predictive models and estimated coefficients from the models
| Parameter | 6-mo mortality | 12-mo mortality |
|---|---|---|
| Number of events | 88 | 103 |
| Performance metrics | ||
| AUC | 85.0 | 85.9 |
| Optimism-corrected AUC | 77.4 | 80.0 |
| Brier score | 0.153 | 0.152 |
| Optimism-corrected Brier score | 0.169 | 0.169 |
| Calibration slope | 1.0000 | 1.0003 |
| Calibration intercept | −0.00043 | 0.00141 |
| Optimism-corrected slope | 0.85 | 0.85 |
| Optimism-corrected intercept | 0.09 | 0.10 |
| Intercept and coefficients | ||
| Intercept | 1.1149 | 1.4284 |
| Patient age | 0.0286 | 0.0331 |
| Bilirubin | 0.2520 | 0.2777 |
| Albumin | 1.2006 | 1.2698 |
| Abdominal pain, no stage 4 gut | 0.0661 | 0.3550 |
| Abdominal pain with stage 4 gut | 1.8603 | 1.7278 |
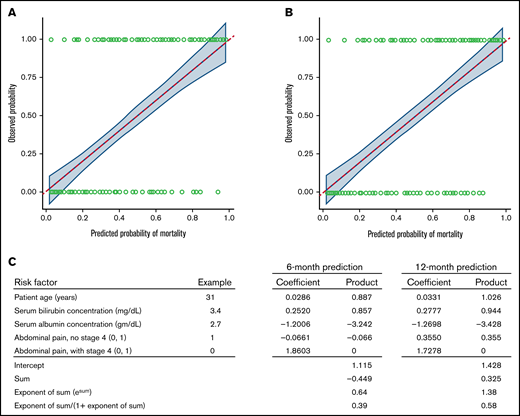
Statistical models predict the probability of mortality at 6 and 12 months after second-line treatment. Calibration curves for mortality at (A) 6 and (B) 12 months after starting second-line treatment with (C) an example for a hypothetical individual patient. The solid blue line shows the fit between the observed probabilities of mortality (y axis) with the estimated probabilities of mortality as predicted by the model (x axis) (see Methods for details). The fit is obtained by using locally estimated scatterplot smoothing. This approach is like standard linear least-squares regression, but this simpler model is fit to localized subsets of the data, leading to a more flexible representation of the fit between the predicted and observed outcomes than could be achieved assuming a linear association across the entire span of the data. The dashed red line shows results that would be expected for a perfect correlation. The shaded area shows the pointwise 95% CIs of the observed probabilities of mortality across the range of predicted probabilities. In the example, values for each risk factor are multiplied by the respective coefficients. The sum of the products plus the intercept is used to predict the probability of mortality from the formula in the bottom row. In this example, the predicted probability of mortality is 0.39 at 6 months and 0.58 at 12 months.
Statistical models predict the probability of mortality at 6 and 12 months after second-line treatment. Calibration curves for mortality at (A) 6 and (B) 12 months after starting second-line treatment with (C) an example for a hypothetical individual patient. The solid blue line shows the fit between the observed probabilities of mortality (y axis) with the estimated probabilities of mortality as predicted by the model (x axis) (see Methods for details). The fit is obtained by using locally estimated scatterplot smoothing. This approach is like standard linear least-squares regression, but this simpler model is fit to localized subsets of the data, leading to a more flexible representation of the fit between the predicted and observed outcomes than could be achieved assuming a linear association across the entire span of the data. The dashed red line shows results that would be expected for a perfect correlation. The shaded area shows the pointwise 95% CIs of the observed probabilities of mortality across the range of predicted probabilities. In the example, values for each risk factor are multiplied by the respective coefficients. The sum of the products plus the intercept is used to predict the probability of mortality from the formula in the bottom row. In this example, the predicted probability of mortality is 0.39 at 6 months and 0.58 at 12 months.
Discussion
This retrospective study was designed to examine outcomes and risk factors associated with treatment failure and overall mortality after second-line treatment for acute GVHD patients at our Center. The incidence of second-line treatment is lower than we had expected and is lower than the 36% incidence reported recently by Axt et al.16 We surmise that many other patients had GVHD that met criteria for steroid-refractory GVHD23 but did not receive second-line treatment because of (1) confidence that a temporary increase in steroid dose and a slower subsequent steroid taper with or without topical treatment could control the disease, especially in the context of an initial flare, (2) lack of confidence in the efficacy of second-line agents, or (3) concern about the side effects of second-line agents. The distribution of reasons for not using a second-line systemic agent could not be determined in this retrospective study. Small numbers of patients had prednisone-equivalent doses <0.5 mg/kg per day at the onset of second-line treatment. We surmise that decisions to use a second-line systemic agent for these patients were motivated by steroid side effects or repeated inability to taper steroid doses. To the best of our knowledge, other information to determine the extent to which practices at our center differ from those at other centers is not available.
We observed a high degree of collinearity in certain disease-related risk factors, and due, at least in part to this collinearity, the list of risk factors in univariate analyses foreshortened to only 3 risk factors for treatment failure (serum albumin, total bilirubin concentration, and abdominal pain/stage-4 gut involvement), and 4 risk factors for mortality (patient age, serum albumin and total bilirubin concentrations, and abdominal pain/stage 4 gut involvement) in the stepwise multivariable logistic regression analyses. These same 4 factors contributed to models for both 6- and 12-month mortality, for which we supply a formula to predict the patient-specific probability of each outcome based on values for each factor.
Higher total serum bilirubin concentration and lower serum albumin concentration were identified as risk factors associated with both FFS and OS. Previous studies have shown that high serum total bilirubin concentrations predict a high risk of mortality in patients with acute GVHD and more generally among all patients who underwent HCT.15,18,24 -27 In patients with GVHD, hyperbilirubinemia has been attributed to apoptotic bile duct epithelial damage or destruction, endothelial inflammation, pericholangitis, and cytokine effects.12 Low serum albumin concentration because of gastrointestinal protein loss has been shown as an early, often preclinical phenomenon in patients with acute GI GVHD after HCT and is associated with poor survival.28-31 Protein-losing enteropathy likely occurs through leaky epithelial tight junctions in the midgut epithelium, allowing transit of protein from the lamina propria into the lumen and reverse translocation of luminal bacteria and endotoxin into the lamina propria and thence into the circulation.12,32,33 Our finding that hypoalbuminemia is associated with an increased risk of mortality corresponds with previous results showing that grade 3 to 4 severity at the onset of second-line treatment is a risk factor for mortality in patients with steroid-refractory or -dependent acute GVHD.15 Other biomarkers such as fecal calprotectin, fecal α1-antitrypsin, and plasma citrulline have also been identified as useful indicators of protein-losing enteropathy and poor prognosis in patients with gastrointestinal GVHD.30,31,34,35 In addition, high serum concentrations of regenerating islet-derived 3-α (Reg3-α) released from Paneth cells and suppression of tumorigenicity 2 (ST2) indicate poor prognosis in patients with gastrointestinal GVHD because they represent biomarkers of damage at the base of intestinal crypts, where epithelial stem cells and Paneth cells are located.36-38 To the best of our knowledge, abdominal pain has not been previously identified as a risk factor for mortality in patients with acute GVHD, but in the current analysis, its association may depend on the presence of stage 4 gut involvement.
The treatment and management of steroid-refractory or -dependent acute GVHD is challenging, although numerous therapeutic agents have been studied in this context.1,8 Our analysis, not surprisingly, did not show substantial evidence of an association of second-line therapy agents with either the risk of mortality or treatment failure after adjusting for the identified risk factors. Although FFS and OS were not demonstrably different across different second-line therapies, the numbers of patients in each group were relatively small, limiting the statistical ability to detect anything but large differences. Moreover, this study was certainly not designed to assess treatment, as none of the regimens was given in a randomized manner. Recently, ruxolitinib was approved for treatment of steroid-refractory or -dependent acute GVHD in the United States based on a single-arm trial and a randomized open-label trial comparing ruxolitinib vs best available off-label therapy.7,23,39 Results of the REACH‐2 trial showed a significantly higher overall response rate at day 28 with ruxolitinib compared with best available standard of care for patients with steroid-refractory or -dependent acute GVHD.7 The durable overall response at day 56 and longer FFS (median, 5 months) were also significantly higher in the ruxolitinib group than in the control group. However, overall survival data at this point are not sufficiently mature to allow conclusions to be drawn regarding survival benefit. OS through 12 months in our cohort tracks closely with OS in the control arm of the REACH-2 trial.
Historically, OS has not served as the primary end point in trials of treatment for steroid-refractory or -dependent acute GVHD, primarily because many other variables unrelated to acute GVHD might affect survival of these patients and complicate the analysis and interpretation. Our results suggest that survival can be predicted reasonably well with a limited number of clinical variables. Based on our results, serum albumin and total bilirubin concentrations plus the presence of abdominal pain and stage 4 gut involvement should be included in future reports of clinical trial results. The models we developed for both 6- and 12-month mortality can also be used in future studies to predict the probability of each outcome based on patient-specific values of these factors. However, these models should be validated by examining their performance in an independent cohort. Such validation ideally would require at least 200 events and 200 nonevents for reliable assessment of calibration.40 Given these requirements, we were not able to identify an external validation cohort that reliably contained all parameters included in our predictive models. An external validation cohort would be expected to have poorer performance metrics than the metrics that were not corrected for optimism in our study. The accuracy of our optimism-corrected metrics will require further examination in an appropriate external cohort. Nonetheless, the internal validation performed with correction for optimism has been shown to yield a reasonably precise estimate of the optimism that might be expected when compared to an external sample.41
The estimated 59% 6-month survival rate in the current study may be higher than expected when compared with most previous studies, possibly because of a high proportion of pediatric patients, the exclusion of patients who had previously received agents other than corticosteroids for treatment of acute GVHD and improvements in prevention of infection. The high survival rate makes it more difficult to demonstrate improved survival even with a highly effective investigational treatment. Improved OS might not stand as a bar of success for current studies at this early stage, but the field should hold it as a goal to reach in the future.
Limitations of our study include the retrospective design and the small numbers of patients that impaired our ability to observe demonstrable differences in survival among the treatment groups. We could not evaluate GVHD grade, because accurate stool volume measurements were not available, and we did not attempt to assess response in this retrospective study. Despite these limitations, the results of this study are important because they provide historical benchmarks for the longer-term outcomes of OS and FFS that would be useful in assessing results of future single-arm and controlled trials testing new agents for second-line treatment of acute GVHD. Our identified risk factors associated with mortality and treatment failure will also help evaluate whether differences between trials or study arms might be attributable to patient selection rather than the effects of the investigational product. These same risk factors may provide valuable prognostic information in counseling patients who require second-line treatment for acute GVHD. The models for 6- and 12-month mortality could be useful in this regard, as well as in calculating an appropriate study-specific benchmark from a given study based on the patient demographics for the 4 factors identified. Although we used Harrell’s optimism as a means of internal validation, these models should be further assessed in external independent cohorts such as REACH-2 study and their performance estimated as noted above.
Previous studies have shown that a biomarker combination of Reg3α and ST2 with or without tumor necrosis factor receptor 1 can be used to predict dichotomized low and high risks of nonrelapse mortality from the onset of acute GVHD and from day 7 afterward, regardless of second-line treatment.38,42,43 This biomarker combination has not yet been tested for prediction of nonrelapse mortality or survival after the onset of second-line treatment, and calibration to provide survival predictions for individual patients with the use of this biomarker panel has not been developed. In future studies, it would be of considerable interest to compare the accuracy and utility of the biomarker-based approach vs the clinical risk factor approach and to evaluate a combination of the 2 approaches for calibrated prediction of survival after second-line systemic treatment for acute GVHD.
Acknowledgments
The authors thank Gary Schoch for assistance with data management.
Research funding was provided by the National Institutes of Health, CA18029.
Authorship
Contribution: P.V. collected data and drafted the manuscript; P.A.C. and M.L.S. collected data; T.A.G. analyzed data; and P.J.M. collected data and drafted the manuscript. All authors critically revised the manuscript and reviewed and approved the final manuscript.
Conflict-of-interest disclosure: P.J.M. has served on advisory boards or consulted for Neovii Biotech GmbH, Genentech, Enlivex Therapeutics, Mesoblast, and Pharmacyclics; has received institutional research funding from AltruBio; and provided an invited lecture, sponsored by Janssen, to the 2019 meeting of the Israeli Society of Hematology and Transfusion Medicine (Janssen had no input regarding the content of the lecture). Funding was used solely for travel costs and housing directly related to the meeting; all arrangements were made by a third party, and he did not receive an honorarium.
Correspondence: Phuong Vo, Fred Hutchinson Cancer Research Center, PO Box 19024, 1100 Fairview Ave N, D1-104, Seattle, WA 98019-1024; e-mail, ptvo@fredhutch.org.

