

Abstract
von Willebrand disease (VWD) is associated with significant morbidity as a result of excessive mucocutaneous bleeding. Early diagnosis and treatment are important to prevent and treat these symptoms. We systematically reviewed the accuracy of diagnostic tests using different cutoff values of von Willebrand factor antigen (VWF:Ag) and platelet-dependent von Willebrand factor (VWF) activity assays in the diagnosis of VWD. We searched Cochrane Central Register for Controlled Trials, MEDLINE, and Embase databases for eligible studies. We pooled estimates of sensitivity and specificity and reported patient-important outcomes when relevant. This review included 21 studies that evaluated VWD diagnosis. The results showed low certainty in the evidence for a net health benefit from reconsidering the diagnosis of VWD vs removing the disease diagnosis in patients with VWF levels that have normalized with age. For the diagnosis of type 1 VWD, VWF sequence variants were detected in 75% to 82% of patients with VWF:Ag < 0.30 IU/mL and in 44% to 60% of patients with VWF:Ag between 0.30 and 0.50 IU/mL. A sensitivity of 0.90 (95% confidence interval [CI], 0.83-0.94) and a specificity of 0.91 (95% CI, 0.76-0.97) were observed for a platelet-dependent VWF activity/VWF:Ag ratio < 0.7 in detecting type 2 VWD (moderate certainty in the test accuracy results). VWF:Ag and platelet-dependent activity are continuous variables that are associated with an increase in bleeding risk with decreasing levels. This systematic review shows that using a VWF activity/VWF:Ag ratio < 0.7 vs lower cutoff levels in patients with an abnormal initial VWD screen is more accurate for the diagnosis of type 2 VWD.
Introduction
The reported prevalence of VWD is up to 1% in the general population based on epidemiologic studies1,2 with a symptomatic prevalence ∼0.1% at the level of primary care.3,4 The prevalence of VWD is ∼15% in women with heavy menstrual bleeding, making it the most common inherited bleeding disorder known in humans.5,6 VWD is caused by deficiency or dysfunction of VWF, a multimeric glycoprotein that binds platelets at sites of vascular injury and stabilizes circulating coagulation factor VIII (FVIII).7-10
Patients with VWD can experience easy bruising, bleeding from the oral cavity, heavy menstrual bleeding, as well as bleeding after dental work, surgical procedures, and childbirth. Joint bleeding may also occur in more severe deficiency. These symptoms vary among patients with VWD, and the bleeding phenotype can fluctuate throughout the life of a patient with VWD, leading to the need for accurate diagnosis of VWD types and subtypes and individualized management plans.11,12 Different types and subtypes of VWD have been defined depending on the type of abnormality in VWF. A patient with partial quantitative deficiency in VWF would have type 1 VWD, whereas a patient with virtual absence of VWF would have type 3 VWD. Patients with type 2 VWD have qualitative abnormalities of VWF: type 2A is characterized by reduced or absent high molecular weight VWF, type 2B results from a gain of function in VWF that increases its affinity for platelets, type 2M is caused by reduced VWF interactions with platelets or collagen, and type 2N results from reduced binding of VWF to FVIII.2,5,10
Multiple variables that affect VWF levels can make confirming a clear diagnosis of VWD difficult. For example, estrogen therapy or pregnancy will lead to an elevation in VWF, obscuring the diagnosis of hereditary VWD in some women. Additionally, mildly reduced VWF:Ag and platelet-dependent VWF activity levels do not always establish a diagnosis of VWD; conversely, low normal VWF:Ag and platelet-dependent VWF activity do not always exclude the diagnosis. This is related, in part, to the VWF:Ag assays, which have good precision and reproducibility; however, the platelet-dependent VWF activity assay has greater variability, resulting in the potential for misdiagnosis and/or misclassification.13
Data show that 43% of previously diagnosed patients with partial quantitative deficiency have normalized VWF levels with age.14-17 However, data are not available to show that an increase in VWF is accompanied by improvement in symptoms. This results in the need for health care providers to carefully consider excluding or removing the diagnosis.
In addition to variation in the diagnosis and management, there is limited awareness of the importance of VWD types and subtypes, as well as lack of consensus on diagnostic criteria.18 The aim of this systematic review was to determine the accuracy of different VWF diagnostic thresholds (ie, VWF cutoff values) for the diagnosis of VWD. Additionally, we assessed the potential benefits and harms from reconsidering the diagnosis of VWD vs simply removing the diagnostic label of VWD from patients with VWF levels that have normalized with age. The results were used to inform the recently published evidence-based recommendations for clinical practice guidelines on VWD, developed as a combined effort from the American Society of Hematology (ASH), the International Society on Thrombosis and Haemostasis (ISTH), the National Hemophilia Foundation, the World Federation of Hemophilia, and the University of Kansas Medical Center.19,20 The guidelines aim to inform all stakeholders on essential issues where there is variation or uncertainty in clinical practice, and they will support decision making in the context of patients’ values and preferences.
Methods
Search strategy and data sources
We searched MEDLINE, Embase, and the Cochrane Central Register of Controlled Trials from inception until August of 2019. We also manually searched the reference lists of relevant articles and existing reviews. Studies published in English were included in this review. We limited the search to studies reporting data on the accuracy of diagnostic tests. The complete search strategy is available in Supplement 1. The prespecified protocol for this review is registered with PROSPERO (CRD42020147977). This review is reported in accordance with Preferred Reporting Items for Systematic reviews and Meta-Analyses for diagnostic test accuracy guidelines.21
Study selection
The eligibility criteria are discussed below.
Studies.
We included studies reporting data on diagnostic test accuracy (cohort studies, cross-sectional studies) for VWD.
Participants.
Participants included patients, of any age, presenting to inpatient or outpatient settings with suspected VWD.
Index tests for diagnosis.
The following tests were considered in eligible studies: VWF:Ag and platelet-dependent VWF activity (VWF ristocetin cofactor [VWF:RCo], VWF activity assays based on ristocetin-induced binding of VWF to a recombinant wild-type GPIb fragment, and VWF activity assays based on spontaneous binding of VWF to a gain-of-function mutant GPIb fragment). We did not exclude studies based on the timing of when the index test was conducted.
Reference standards.
If a reference diagnostic test was not conducted, we accepted clinical follow-up for symptoms alone as a reference standard.
Exclusion criteria.
Although studies reporting on patients with VWD, as well as other bleeding disorders, were eligible for inclusion, we excluded studies in which >80% of the study population included a different bleeding disorder. When possible, we extracted data separately for patients with VWD from these studies. We also excluded studies that did not provide sufficient data to determine test accuracy (sensitivity and specificity), abstracts, and studies with a sample size < 10 patients.
Screening and data extraction
Independent reviewers conducted title and abstract screening and full-text review in duplicate to identify eligible studies. Two reviewers completed data extraction independently and in duplicate, and data were verified by a third reviewer (M.A.K.). Disagreements were resolved by discussion to reach consensus, in consultation with 2 expert clinician scientists (N.T.C. and P.D.J.). We extracted data about general study characteristics (investigators, publication year, country, study design), diagnostic index test and reference standard, prevalence of VWD, and parameters to determine test accuracy (ie, sensitivity and specificity of the index test).
Risk of bias and certainty of evidence
We conducted the risk of bias assessment for diagnostic test accuracy studies using the Quality Assessment of Diagnostic Accuracy Studies 2 revised tool.22 We used the Grading of Recommendations Assessment, Development and Evaluation (GRADE) framework to assess overall certainty by evaluating the evidence for each outcome on the following domains: risk of bias, imprecision, inconsistency, indirectness, and publication bias.23,24
Data synthesis
When feasible, we combined the accuracy estimates from individual studies quantitatively (ie, pooled) for each test using Open Meta-Analyst. We conducted a bivariate analysis for pooling sensitivity and specificity for each of the test comparisons to account for variation within and between studies. Forest plots were created for each comparison. The Breslow-Day test was used to measure the percentage of total variation across studies due to heterogeneity (I2); however, the results did not influence our judgment about inconsistency because of the known methodological limitations of I2 in test accuracy reviews.25
Diagnostic strategies for VWD are based on assessment of the pretest probability (PTP) for individual patients, which provides an estimate of the expected prevalence of VWD at a population level. We calculated the absolute differences in effects for each comparison as true positives, true negatives, false positives, and false negatives. Here, we present the results for the low-, intermediate-, and high-PTP groups.
Results
Description of studies
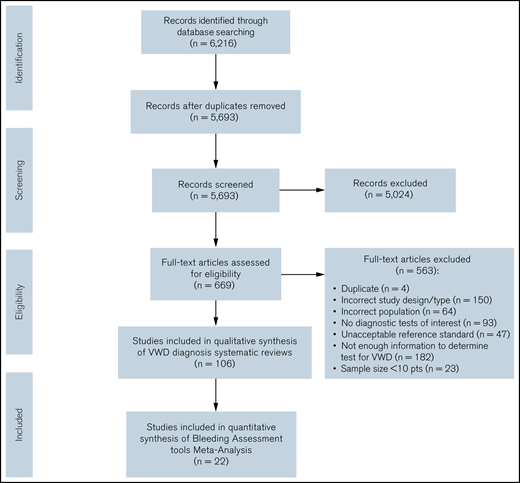
The initial search retrieved 5693 nonduplicate studies, of which 669 were included for full-text review. Following full-text review, we identified 106 studies eligible for data abstraction, of which 21 answered the questions addressed in this systematic review.14-17,26-34 A list of excluded studies is provided in Supplement 3. Reasons for exclusion at full-text review were ineligible study design, study population, or diagnostic test; sample size < 10 patients; unacceptable reference standards; and/or not enough information to determine diagnostic test accuracy for VWD. Figure 1 summarizes the flow diagram of the included studies.
Use of different VWF levels to diagnose type 1 VWD
Of the included studies, 9 reported on the cutoff values of VWF. Supplement 4 summarizes the general characteristics of the included studies, as well as the index and reference tests. The complete risk of bias assessment for individual studies is included in Supplement 5. There was very low certainty in the evidence supporting the use of different VWF levels to diagnose type 1 VWD and assessing the implications and consequences of using different levels.
Table 1 summarizes the evidence of using different VWF levels to diagnose type 1 VWD. The interactive summary of findings can be accessed using the following link: https://gdt.gradepro.org/presentations/#/isof/isof_c5b33e22-a646-4654-9f09-b820aff36c5c-1569520689536?_k=eump67.
GRADE test accuracy evidence summary for using different VWF levels to diagnose type 1 VWD
| Certainty assessment | Impact | Certainty | ||||||
|---|---|---|---|---|---|---|---|---|
| Studies, n | Study design | Risk of bias | Inconsistency | Indirectness | Imprecision | Other considerations | ||
| Mutation detection | ||||||||
| 327,31,a | Observational | Not serious* | Not serious | Not serious | Not serious | None | For VWF:Ag < 0.3, mutations were detected in 75-82% of patients in 2 studies. For VWF:Ag = 0.3 to 0.5, mutations were detected in 44-60% of patients in 3 studies. | ⨁⨁◯◯ Low |
| LR of VWD | ||||||||
| 213 ,b | Observational | Not serious* | Not serious | Not serious | Not serious | None | In patients who were investigated for bleeding episodes, for VWF:Ag levels 30-40 dL, LR of having VWD = ∞ (in all of them, VWD was confirmed by second-level tests). For levels 41-50 dL, LR = 0.73 (0.41-1.30), and for levels 51-60 dL, LR = 0.33 (0.18-0.62).13 Using MCMDM-1VWD, in patients with VWD and family history of VWD, for VWF:Ag level < 20, LR = 374 (52.2-2677); for level 20-40, LR = 95.1 (39.1-232); for level 40-60, LR = 1.82 (1.28-2.58); and for level > 60, LR = 0.10 (0.06-0.16).b | ⨁⨁◯◯ Low |
| VWF level and BS correlation | ||||||||
| 227 ,a | Observational | Not serious* | Serious† | Not serious | Not serious | None | The majority of patients with low VWF had significant bleeding histories, as determined using the ISTH BAT or the Condensed MCMDM-1 VWD score.27 There was no difference between BS and VWF levels because the BS used was after patients were recruited in the study and were receiving treatment. Data from unpublished work showed a continuum, with a higher BS in those with lower VWF at the time of enrollment/diagnosis.a | ⨁◯◯◯ Very low |
| Bleeding tendency | ||||||||
| 113 | Observational | Not serious* | Not serious | Not serious | Not serious | None | 70 of 93 (75%) patients with borderline VWF (0.3-0.5) were investigated after a bleeding episode: mucocutaneous bleeding was present in 35, 25 bled after surgery, and 10 bled after dental procedures. Ten patients experienced >1 symptom. | ⨁⨁◯◯ Low |
BAT, bleeding assessment tool; BS, bleeding score; LR, likelihood ratio; MCMDM-1 VWD, Molecular and Clinical Marker for the Diagnosis and Management of Type 1 (MCMDM-1) VWD Bleeding Questionnaire.
The majority of included studies were judged to be at a low risk for bias for patient selection and reference standard interpretation. Although there was unclear reporting about when the index test was conducted, the certainty of evidence was not downgraded for risk of bias. The index test risk of bias was moderate in 7 cohort studies.
Results from the 2 studies are not consistent with one another.
Flood,36 . . 2016.
Tosetto,37 . . 2007.
Use of platelet-dependent VWF activity/VWF:Ag ratio to confirm type 2 VWD
Of the included studies, 6 reported on the VWF level in type 2 VWD. Table 2 summarizes the general characteristics of included studies, as well the index and reference standards. The complete risk of bias assessment for individual studies is included in Supplement 4. The certainty of the evidence for test accuracy is very low, which is due to the case-control design leading to serious population-selection bias. The studies do not compare the 2 tests cutoffs directly, and there is significant unexplained inconsistency.
Study characteristics for diagnosing type 2 VWD using VWF:RCo/antigen ratio
| Study | Study design | Total patients (type 2M VWD), n | Reference standard | Prevalence, % |
|---|---|---|---|---|
| Vangenechten et al, 201834 | Cross-sectional, case control | 142 (8) | PFA, RIPA, VWF:Ag, FVIII:C, VWF:CB, molecular diagnosis through DNA sequencing | 37 |
| de Maistre et al, 201433 | Cross-sectional, case control | 80 (16) | Molecular analysis was performed to confirm the classification. | 58 |
| Chen et al, 201132 | Cross-sectional, case control | 453 (4) | Based on results of VWF:Ag, VWF:RCo, and VWF multimer analysis and available clinical information, samples were categorized as normal; VWD types 1, 2A/B, 2M, or severe 1 vs 2M; or AVWA as a result of the subtle loss of highest molecular weight multimers. | 6 |
| James et al, 200731 | Cross-sectional, case control | 16 (all) | A blood sample was obtained from all of the index cases, and genomic DNA was isolated from leukocytes using a salt-extraction method. | N/A |
| Caron et al, 200630 | Cross-sectional, case control | 31 (0) | RIPA and genetic testing | N/A |
| Adcock et al, 200629 | Cross-sectional, cohort | 497 (1) | VWF multimeric analysis, VWF:Ag, ristocetin cofactor activity, and collagen-binding activity | 10 |
AVWA, acquired VWF abnormalities; FVIII:C, FVIII activity; FVIII:CB, FVIII collagen binding; N/A, Not available; PFA, platelet function analyzer; RIPA, ristocetin-induced platelet aggregation.
Test accuracy of a platelet-dependent VWF activity assay/VWF:Ag ratio < 0.7 to confirm type 2 VWD was pooled from 5 cohort studies that included 204 participants. Studies used laboratory testing, including a platelet function analyzer (PFA), ristocetin-induced platelet aggregation (RIPA), VWF:Ag, FVIII activity, VWF collagen binding, and molecular diagnosis through DNA sequencing, as a reference standard for confirming type 2 VWD. The pooled estimates for sensitivity and specificity were 0.93 (95% CI, 0.87-0.98) and 0.82 (95% CI, 0.63-0.99), respectively (moderate certainty in the sensitivity results and very low certainty in the specificity results). Figure 2 shows the forest plot displaying the sensitivity and specificity from individual studies and the pooled estimates.
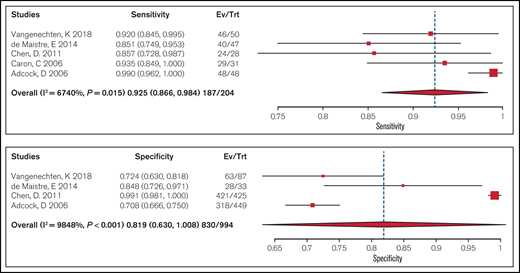
Forest plots for sensitivity and specificity for individual studies and the pooled estimates for a ratio < 0.7.
Forest plots for sensitivity and specificity for individual studies and the pooled estimates for a ratio < 0.7.
Table 3 shows GRADE test accuracy evidence summary when using a platelet-dependent VWF activity assay/VWF:Ag ratio < 0.7 to diagnose type 1 VWD. The interactive summary of findings can be accessed using the following link: https://gdt.gradepro.org/presentations/#/isof/isof_2e5b5dac-94e0-4108-9ff3-effcce27648b-1606770452095?_k=r1ooaz.
GRADE test accuracy evidence summary for using a platelet-dependent VWF activity assay/VWF:Ag ratio < 0.7 to diagnose type 1 VWD
| Outcome | Studies/ patients, n | Study design | Factors that may decrease CoE | Effect per 1000 patients tested; pretest probability of 30% | Test accuracy CoE | ||||
|---|---|---|---|---|---|---|---|---|---|
| Risk of bias | Indirectness | Inconsistency | Imprecision | Publication bias | |||||
| True positives* | 5/204 | Cohort and case-control type studies | Serious† | Not serious | Not serious | Not serious | None | 278 (260-295) | ⨁⨁⨁◯ Moderate |
| False negatives‡ | 22 (5-40) | ||||||||
| True negatives§ | 4/994 | Cohort and case-control type studies | Serious† | Not serious | Serious¶ | Seriousǁ | None | 573 (441-700) | ⨁◯◯◯ Very low |
| False positives# | 127 (0-259) | ||||||||
Sensitivity, 0.93 (95% CI, 0.83-0.94); specificity, 0.82 (95% CI, 0.63-0.99). Pooled in proportion; not enough studies to pool as test accuracy results.
CoE, certainty of the evidence.
Patients with type 2 VWD.
All included studies were judged to be low risk of bias for test. Although there was unclear reporting about when the index test was conducted in some studies, the certainty of evidence was generally not downgraded for risk of bias. The patient selection risk of bias was high because of the case control design and reference standard interpretation leading to serious risk of bias.
Patients incorrectly classified as not having type 2 VWD.
Patients without type 2 VWD.
Considering the upper vs the lower boundary of the effect estimate may lead to a different clinical decision.
Prevalences are 30%. This is typically seen in patients investigated for type 2 VWD because of a low VWF:RCo/antigen ratio.
Patients incorrectly classified as having type 2 VWD.
We summarized the test accuracy using a platelet-dependent VWF activity assay/VWF:Ag ratio < 0.6 to confirm type 2 VWD from 3 cohort studies that included 184 participants. Studies used laboratory testing, including PFA, RIPA, VWF:Ag, FVIII:C, VWF:CB, and molecular diagnosis through DNA sequencing, as a reference standard for confirming type 2 VWD, with some studies also including a clinical historic diagnosis. The ranges for estimates for sensitivity and specificity were 0.68 to 0.97 and 0.87 to 0.88, respectively (very low certainty in the sensitivity results and low certainty in the specificity results). Figure 3 shows the forest plot displaying the sensitivity and specificity from individual studies.

Forest plots for sensitivity and specificity for individual studies for a ratio < 0.6. FN, false negatives; FP, false positives; TN, true negatives; TP, true positives.
Forest plots for sensitivity and specificity for individual studies for a ratio < 0.6. FN, false negatives; FP, false positives; TN, true negatives; TP, true positives.
Table 4 shows the GRADE test accuracy evidence summary when using a platelet-dependent VWF activity assay/VWF:Ag ratio < 0.6 to diagnose type 1 VWD.
GRADE test accuracy evidence summary for using a platelet-dependent VWF activity assay/VWF:Ag ratio < 0.6 to diagnose type 1 VWD
| Outcome | Studies/ patients | Study design | Factors that may decrease CoE | Effect per 1000 patients tested; pretest probability of 30% | Test accuracy CoE | ||||
|---|---|---|---|---|---|---|---|---|---|
| Risk of bias | Indirectness | Inconsistency | Imprecision | Publication bias | |||||
| True positives* | 3/97 | Cohort and case-control type | Serious† | Not serious | Serious‡ | Serious§ | None | 203-291 | ⨁◯◯◯ Very low |
| False negatives¶ | 9-97 | ||||||||
| True negativesǁ | 1/87 | Cohort and case-control type | Serious† | Not serious | Not serious | Serious | None | 612 | ⨁⨁◯◯ Low |
| False positives# | 88 | ||||||||
Sensitivity, 0.68-0.97, specificity, 0.87-0.88.
Prevalences are 30%; typically seen in patients investigated for type 2 VWD because of a low VWF:RCo/Ag ratio.
CoE, certainty of the evidence.
Patients with type 2 VWD.
Serious patient selection risk of bias due to the case-control design. Also, issues around labeling as type 2M were noted.
Confidence intervals do not cross the effect estimates of different studies.
Small number of subjects.
Patients incorrectly classified as not having type 2 VWD.
Patients without type 2 VWD.
Patients incorrectly classified as having type 2 VWD.
We summarized the test accuracy using a 0.5 platelet-dependent VWF activity/VWF:Ag ratio < 0.5 to confirm type 2 VWD from 3 cohort studies that included 95 participants. Studies used laboratory testing, including PFA, RIPA, VWF:Ag, FVIII:C, VWF:CB and molecular diagnosis through DNA sequencing, as a reference standard for confirming type 2 VWD, with some studies also including clinical historic diagnosis. The range for estimates for sensitivity was 0.58 to 0.79; specificity was assumed to be 1 with a ratio < 0.5 (low certainty in the sensitivity results). Figure 4 shows the forest plot displaying the sensitivity and specificity from individual studies.

Forest plots for sensitivity and specificity for individual studies for a ratio < 0.5. FN, false negatives; FP, false positives; TN, true negatives; TP, true positives.
Forest plots for sensitivity and specificity for individual studies for a ratio < 0.5. FN, false negatives; FP, false positives; TN, true negatives; TP, true positives.
Table 5 shows GRADE test accuracy evidence summary when using a platelet-dependent VWF activity assay/VWF:Ag ratio < 0.5 to diagnose type 1 VWD.
GRADE test accuracy evidence summary for using a platelet-dependent VWF activity assay/VWF:Ag ratio < 0.5 to diagnose type 1 VWD
| Outcome | Studies/ patients, n | Study design | Factors that may decrease CoE | Effect per 1000 patients tested; pretest probability of 30% | Test accuracy CoE | ||||
|---|---|---|---|---|---|---|---|---|---|
| Risk of bias | Indirectness | Inconsistency | Imprecision | Publication bias | |||||
| True positives* | 3/95 | Cohort and case-control type | Serious† | Not serious | Not serious | Serious‡ | None | 174-237 | ⨁⨁◯◯ Low |
| False negatives§ | 63-126 | ||||||||
| True negatives¶ | 0/0 | 693-700 | — | ||||||
| False positivesǁ | 0-7 | ||||||||
Sensitivity, 0.58-0.79; specificity 0.99-1.00. Specificity assumed to be 100% with a ratio cutoff < 0.5.
Prevalences are 30%; typically seen in patients investigated for VWD because of a personal history of abnormal laboratory test (eg, increased partial thromboplastin time).
CoE, certainty of the evidence.
Patients with type 2 VWD.
Serious patient selection risk of bias due to case-control design. Also, issues around labeling as type 2M were noted.
Small number of subjects.
Patients incorrectly classified as not having type 2 VWD.
Patients without type 2 VWD.
Patients incorrectly classified as having type 2 VWD.
Normalization of VWF levels with age
Of the included studies, 6 reported on VWF levels that normalize with age in type 1 VWD. The risk of bias due to confounding factors was high, because the studies did not adjust for comorbidities, with the exception of the one by Sanders et al26 ; more elderly patients reported ≥1 comorbidity, including diabetes, cancer, cardiovascular disease, and depression, compared with younger patients. Atiq et al35 showed that comorbidities are associated with higher levels of VWF and FVIII in type 1 VWD, which may explain the age-related increase in VWF and FVIII levels. The complete risk of bias assessment for individual studies is included in Supplement 4. Table 6 summarizes the evidence assessing normalization of VWF levels with age.
GRADE evidence summary assessing the effect of normalization of VWF levels with age
| Certainty assessment | Impact | Certainty | ||||||
|---|---|---|---|---|---|---|---|---|
| Studies, n | Study design | Risk of bias | Inconsistency | Indirectness | Imprecision | Other considerations | ||
| Age change in VWF:Ag | ||||||||
| 5 | Observational | Serious* | Serious† | Serious‡ | Not serious | None | 5 studies with 1142 patients reported the change in VWF levels longitudinally (follow-up between 1 and 10 y). The mean change in VWF was 7.9 IU/dL per decade (range, 3.0-24.0). | ⨁◯◯◯ Very low |
| Frequency of normalization of VWF levels | ||||||||
| 4 | Observational | Serious* | Serious§ | Serious‡ | Not serious | None | 4 studies with 435 patients reported the normalization of VWF levels over a period of 1-10 y. The number of patients with normalized levels ranged from 25-60%, with a weighted average of 43%. | ⨁◯◯◯ Very low |
| Bleeding with normalization of levels | ||||||||
| 1 | Observational | Not serious | Not serious | Not serious | Not serious | None | Binary logistic regression analysis with bleeding in the year prior to inclusion in the WiN study as a dependent variable. After adjusting for age, sex, BMI, and the presence of any relevant comorbidities (hypertension, cancer, diabetes, and thyroid dysfunction), normalization of VWF levels > 0.50 was still not associated with the incidence of bleeding requiring treatment in the year prior to inclusion in the study (odds ratio, 1.26; 95% CI, 0.72-2.21; P = .414). We can conclude that, even after taking other important factors that influence VWF levels and bleeding into account, normalization of VWF levels is not associated with a lower incidence of bleeding episodes requiring hemostatic treatment. 27% of patients with normalized levels had bleeding symptoms at the time of the study, and 21% of patients with abnormal levels had bleeding symptoms. | ⨁⨁◯◯ Low |
| BS in patients with normalized levels | ||||||||
| 2 | Observational | Serious* | Not serious | Serious¶ | Not serious | None | Nummi et al15 showed that the mean BS in patients with a confirmed diagnosis ranged between 10 and 24. Mean BS in patients with a diagnosis of low VWF and those with normal VWF levels was 6. Including all patients with historical VWD, BS showed a weak and negative correlation with VWF:RCo (r = +0.43), VWF:Ag (r = +0.51), VWF:CB (r = +0.54), FVIII (r = +0.44), RIPA, 0.6 mg/mL (r = +0.34), and RIPA, 0.8 mg/ mL (r = +0.54) and a positive correlation with PFA C/EPI (r = +0.45) and C/ADP (r = +0.46) (P ≤ .001 for all). Sanders et al26 showed that BS did not differ between elderly and younger patients. | ⨁◯◯◯ Very low |
BMI, body mass index; BS, bleeding score; C/ADP,Cartridge with collagen and adenosine diphosphate; C/EPI, Cartridge with collagen and epinephrine; PFA, Platelet Function Analyser; RIPA, RIPA, ristocetin-induced platelet aggregation; VWF:CB, VWF collagen binding assay.
Serious study confounding occurred because the investigators did not adjust for comorbidities, with the exception of Sanders et al26 .. In their study, more elderly patients reported ≥1 comorbidity, including diabetes, cancer, cardiovascular disease, and depression, compared with younger patients. Atiq, 2018 showed that comorbidities are associated with higher levels of VWF and FVIII in type 1 VWD and may explain the age-related increase in VWF and FVIII levels.
The change in VWF levels varies between 3.0 and 24 IU/dL per decade, leading to serious inconsistency.
Although the change in VWF levels is presented, the bleeding symptoms of patients with normalized levels is not reported in the studies.
The normalization of VWF levels varies between 25% and 60%, leading to serious inconsistency.
The BS does not predict the bleeding symptoms in patients in normal VWF levels but informs on the bleeding history in those patients.
Discussion
VWF level cutoffs in the diagnosis of type 1 VWD
This review presents pooled and summary estimates of test accuracy and patient-important outcomes for different VWF levels for VWD diagnosis and the reconsideration of the diagnosis in patients with VWF levels that have normalized with age. Sequence variants within VWF were identified more frequently in cases with lower VWF levels. The benefit of using a higher cutoff for type 1 VWD is to not miss the diagnosis in an affected patient especially in those with a bleeding phenotype. The benefit of using a lower cutoff is to avoid mistreating (or providing unnecessary treatment to) a patient who does not have type 1 VWD. Consequently, it is reasonable to use a VWF level of < 0.30 IU/mL regardless of bleeding phenotype, and in patients with abnormal bleeding, a VWF level of < 0.50 IU/mL to confirm the diagnosis of type 1 VWD. However, recommendations on whether to use a 0.30 IU/mL or 0.50 IU/mL level in the clinical practice will depend on multiple factors, including the patients’ values in regards to their diagnosis. Also, VWF antigen and platelet-dependent activity are continuous variables with an increase in bleeding risk with decreasing levels. However, the clinical phenotype is determined by more than the levels only.
VWF activity/VWF:Ag ratio in the diagnosis of type 2 VWD
With regard to the platelet-dependent VWF activity/VWF:Ag ratio for the diagnosis of type 2 VWD, the pooled estimates for sensitivity and specificity for a ratio < 0.7 were higher than for the ratio < 0.5 and the ratio < 0.6. More false negatives are expected when using a diagnostic threshold < 0.50 IU/mL. Therefore, it would be appropriate to use a higher cutoff of < 0.7 to confirm type 2 VWD (2A, 2B, or 2M) in patients with an abnormal initial VWD screen. Quality of life and inaccurate counseling are concerns for patients when they are mislabeled. Some pregnant women are denied epidural anesthesia because they are labeled as having type 2 VWD, but this is less of a problem for type 1 VWD. Of note, when treatment is available it supports not denying epidural anesthesia; however, the decision is more complex and should be based on informed shared decision making with informed discussions about benefits and harms. It is very important for clinicians and patients to understand the differences in treatment for the different types of VWD.
Diagnosis in patients with VWD whose VWF levels normalize with age
For patients with VWF levels that normalize with age, this should trigger repeat evaluation of the bleeding phenotype and consideration of other bleeding disorders, particularly if other hemostatic testing (ie, platelet function testing) was not performed previously. The degree of normalization may influence the decision about how to manage minor procedures (ie, expectantly or pretreat). It is important to note that some treatments for VWD (ie, tranexamic acid) are also effective for other bleeding disorders. If the diagnosis is removed, there is a fear of undertreatment, particularly if the patient has had prior issues with major bleeding.
This review has several strengths. The comprehensive and systematic approach used to identify studies makes it unlikely that relevant ones were missed. Also, we assessed the certainty of evidence using the GRADE framework and identified sources of bias.
We note a few limitations of this comprehensive systematic review. The pooled sensitivity and specificity estimates of the tests from this review only apply when the test is performed alone; however, they can be used to model various diagnostic strategies to inform clinical decision making. Ultimately, the diagnostic tests will be used in a strategic approach based on clinical PTP and with consideration of availability, cost, and patient and provider values and preferences.
Conclusions
This comprehensive systematic review synthesizes and evaluates the accuracy of VWF levels in the diagnosis of VWD. Estimates of sensitivity and specificity from this review were used to inform evidence-based recommendations for a clinical practice guideline. For clinical decision making, the prevalence of PTP for VWD in a population, together with the sensitivity and specificity estimates, should influence how patients are managed.
Acknowledgments
The systematic review team acknowledges Jenny Castano; members of ASH, ISTH, the National Hemophilia Foundation, and the World Federation of Hemophilia; and the VWD disease diagnosis guidelines panel members for assistance and administrative support.
This systematic review was conducted to support the development of the ASH 2020 guidelines for diagnosis and management of VWD. The entire guideline development process was funded by ASH. Some researchers received salary or grant support and others participated to fulfill requirements of an academic degree or program or volunteered their time through the Outcomes and Implementation Research Unit at the University of Kansas Medical Center.
Authorship
Contribution: R.A.M., M.A.K., R.B.-P. and N.H. design the study, selected the included studies, extracted data, performed statistical analyses, and interpreted results; O.A., O.D., A.E.A., S.T., B.M., A.D., and A.Q. selected the included studies and extracted data; M.A.K. and R.A.M. wrote the manuscript; and N.G., C.M., B.A., J.E., S.M., R.R.M., J.S.O.D., N.S., R.S., R.B.-P., P.D.J., N.T.C., and V.F. interpreted the results and critically revised the manuscript; and all authors approved the final version of the manuscript.
Conflict-of-interest disclosure: The authors were members of the diagnosis guideline panel, the systematic review team, or both. R.A.M. has received research funding from CSL Behring, Bayer, and Takeda.
The current affiliation for A.D. is East and North Hertfordshire NHS Trust, Lister Hospital, Stevenage, United Kingdom.
Correspondence: Reem A. Mustafa, Division of Nephrology and Hypertension, Department of Medicine, University of Kansas Medical Center, 3901 Rainbow Blvd, MS3002, Kansas City, KS 66160; e-mail: rmustafa@kumc.edu.

