

Key Points
Hypoxia inhibits T-ALL cell growth by decreasing down cell cycle and mitochondria activity, making them less sensitive to chemotherapies.
mTOR inhibitor mimicked the hypoxia effects and increased drug resistance.

Abstract
Resistance to chemotherapy, a major therapeutic challenge in the treatment of T-cell acute lymphoblastic leukemia (T-ALL), can be driven by interactions between leukemic cells and the microenvironment that promote survival of leukemic cells. The bone marrow, an important leukemia niche, has low oxygen partial pressures that highly participate in the regulation of normal hematopoiesis. Here we show that hypoxia inhibits T-ALL cell growth by slowing down cell cycle progression, decreasing mitochondria activity, and increasing glycolysis, making them less sensitive to antileukemic drugs and preserving their ability to initiate leukemia after treatment. Activation of the mammalian target of rapamycin (mTOR) was diminished in hypoxic leukemic cells, and treatment of T-ALL with the mTOR inhibitor rapamycin in normoxia mimicked the hypoxia effects, namely decreased cell growth and increased quiescence and drug resistance. Knocking down (KD) hypoxia-induced factor 1α (HIF-1α), a key regulator of the cellular response to hypoxia, antagonized the effects observed in hypoxic T-ALL and restored chemosensitivity. HIF-1α KD also restored mTOR activation in low O2 concentrations, and inhibiting mTOR in HIF1α KD T-ALL protected leukemic cells from chemotherapy. Thus, hypoxic niches play a protective role of T-ALL during treatments. Inhibition of HIF-1α and activation of the mTORC1 pathway may help suppress the drug resistance of T-ALL in hypoxic niches.
Introduction
Cancer treatments have greatly improved because of the progress of genomics. However, chemoresistance remains a major problem in eradicating cancer cells. Drug resistance may involve many molecular mechanisms including intrinsic metabolic adaptation of tumors, selection of cancer cells bearing additional mutations, activation of compensatory signaling pathways,1 and extrinsic induced chemoprotection by the tumor microenvironment.2 In fact, this resistance may rely at least partly on less proliferating or even quiescent tumor cells escaping proliferating cell targeting drugs and preserving the ability to reinitiate cancers.3 Identifying and resolving resistance mechanisms are thus currently major challenges in cancer treatment.
The interactions of cancer cells with their surrounding microenvironment have gained increased attention because of the hypothesis that specific supportive cells can regulate the quiescence, survival, and self-renewal of cancer cells. This relationship may underlie critical mechanisms that facilitate both disease initiation and drug resistance.4
T cell acute lymphoblastic leukemia (T-ALL) is an aggressive hematologic malignancy characterized by bone marrow (BM) infiltration of immature lymphoblasts derived from transformed T-cell precursors.5 After chemotherapy, the 5-year T-ALL event-free survival rate is now less than 50% for adults6 and about 80% for children, both having a particularly unfavorable prognosis at relapse.5 Drug-resistant blasts that survived below the detection limit suggesting complete remission may subsequently be reactivated, proliferate, and trigger the relapse. The mechanisms underlying T-ALL chemoresistance are partially understood. Data from the literature have shown that the main cause of treatment failure in relapsed ALL is the resistance to glucocorticoids7 and that the enhancement of a glycolytic status in leukemic cells may induce drug resistance.8 Interestingly, transcriptional profiling reveals the association of chemoresistance in T-ALL is associated with the upregulation of glycolysis, oxidative phosphorylation, cholesterol biosynthesis and glutamate metabolism, increased growth rates, and activation of phosphatidylinositol 3-kinase (PI3K)/protein kinase B (AKT)/mammalian target of rapamycin (mTOR) and MYC signaling pathways.9 The PI3K/AKT/mTOR pathway is thus an attractive target to improve treatment responses in T-ALL because it is frequently activated in association with treatment resistance. Over the last decade, various targeted inhibitors of the PI3K/AKT/mTOR pathway have been developed unraveling promising tools for enhanced treatment efficacy.10
BM has been suggested to take part in a complex crosstalk in which leukemic cells can remodel the microenvironment.11-13 Hence, leukemia-supportive niches targeting treatments unveil a crucial aspect of T-ALL therapy.14 In T-ALL, Hawkins et al15 highlighted dynamic interactions of leukemic cells with the overall BM microenvironment but not with specific cell types. Therefore, future therapeutic interventions should target the migration/homing interactions of leukemic cells in the BM rather than cell–cell interactions to combat survival and invasion of drug-resistant T-ALL cells. Identifying how the BM microenvironment physical/biochemical properties impact T-ALL growth, in addition to the molecular mechanisms governing the quiescence of resistant cancer cell, may provide clues to efficiently target resistant cells.
Hypoxia is a key physical/biochemical microenvironmental status of BM that influences both the biology of hematopoietic stem cells and leukemic cells.16-21 In hypoxia, adaptive responses have been identified as downstream effects of hypoxia-inducible factors (HIFs).22 HIF-1 is a master transcription factor for oxygen sensing. It is composed of an oxygen-regulated α subunit (HIF-1α) and a constitutively expressed β subunit (HIF-1β).22 Under hypoxia, stabilized HIF-1α dimerizes with HIF-1β and is translocated into the nucleus to promote target gene transcription allowing the induction of an expression program that results in enhanced oxygen delivery to tissues.22 However, the determinants of HIF-1α regulation are incompletely understood.23 HIF-1α protein levels are elevated in most solid tumors because of hypoxic stress or aberrant mutations.24 Clinical investigations revealed that elevation of HIF-1α makes tumor cells more resistant to chemotherapy and increases the likelihood of metastasis and poor outcome.25 In this work, we investigated how low oxygen concentrations impact T-ALL proliferation, apoptosis leukemia-propagating activity, and chemoresistance. We identified an interesting HIF-1α/mTORC1 signaling loop that orchestrates quiescence of T-ALL cells and contributes to T-ALL drug resistance.
Materials and methods
Human T-ALL
Human T-ALL cell samples were obtained with the informed consent of patients in accordance with the Declaration of Helsinki and the ethics regulations. Blood and/or BM samples were collected at diagnosis at Hôpital R. Debré and Hôpital A. Trousseau (Paris, France) and processed as previously described.26 Culture conditions, in vivo protocols, and T-ALL cells used in this study are described in the supplemental Methods.
Quantification of mitochondrial mass and membrane potential
Mitochondrial mass was determined using 50 nM Mitotracker Green (MTG; M7514; Thermo Fisher Scientific), and mitochondrial membrane potential was measured using 100 nM tetramethylrhodamine methyl ester (TMRE; T669; Thermo Fisher Scientific), both following the manufacturer’s instructions. Briefly, leukemic cells were incubated with MTG and TMRE for 30 minutes at 37°C in their culture medium before analysis. Carbonyl cyanide 4-(trifluoromethoxy) phenylhydrazone (2920; Sigma-Aldrich) was added at 50 μM, 15 minutes before the end of the labeling and used as a negative control.
In vivo chemotherapy
For T-ALL 4-drug induction therapy, we used a 1-week schedule of vincristine (0.25 mg/kg, intravenously, Monday), dexamethasone (5 mg/kg, intraperitoneally, each day Monday-Friday), l-asparaginase (1000 U/kg, intraperitoneally, each day Monday-Friday), and cytarabine (Ara-C, 2.5 mg/kg, intravenously, Monday). At the end of treatment, the mice were euthanized, and the percentage of leukemia cells in the BM was evaluated.
Lentiviral vectors and transduction of T-ALL cells
Short hairpin RNA (shRNA) targeting 5′-GTGATGAAAGAATTACCGAAT-3′ of HIF1a (NM_181054.1, NM_001530.2; hypoxia-inducible factor 1a subunit; shHIF-1α) was cloned in the pTRIP/ΔU3-MND-GFP vector and vectors were produced as previously described.27 shHIF-1α.2 vector construct was provided by the F.M. laboratory.20 T-ALL cells were transduced as in Gerby et al.28 Control shRNA vector contained the 5′ GTGTTGGGTCGCGAAAGG of hepacivirus C strain SL8 polyprotein (MN628597.1).29 shRNA control was cloned in pTRIP/ΔU3-MND-GFP or in pTRIP/ΔU3-MND-Cherry vectors.
Statistical analyses
Statistical analyses were performed using GraphPad Prism software. Values are presented as the mean or median ± standard error of the mean (SEM). Statistical comparisons between conditions were determined using nonparametric (Wilcoxon or Friedman test) or parametric test (1-way analysis of variance). Survival of mice was compared using the log-rank (Mantel-Cox) test. Differences with P < .05, P < .01, P < .001, or P < .0001 are considered statistically significant.
Results
Hypoxia modulates apoptosis, cell cycle, and metabolism of T-ALL cells
Leukemic cells from 5 human T-ALL patient samples and 3 T-ALL mouse models (supplemental Table) were cocultured with MS5 or MS5-DL1 stromal cells30 for 4 days in 1%, 3.5%, and 21% O2 (hereafter called normoxia). At the end of the culture, T-ALL cells were counted by flow cytometry using CD45 and CD7 expression on cells, as, respectively, pan hematopoietic and T-cell markers. We observed that hypoxia strongly inhibits CD45+CD7+ T-ALL cell growth with twice less cells in 3.5% O2 than in normoxia and no growth in 1% O2 condition (Figure 1A; supplemental Figure 1A). A direct effect of hypoxia on leukemic cells (rather than a rebound effect on stromal cells) was tested with 3 human T-ALL samples that can grow without stromal support (T-ALL #1, #3, and #4) in contrast to most T-ALL samples.30 The results showed that hypoxia inhibits T-ALL growth although stromal cells were absent from the culture (supplemental Figure 1A), suggesting that hypoxia directly affects T-ALL cells through cellular cycle arrest or induced cell death. Interestingly, T-ALL cells long-term cultured in hypoxic conditions did not grow during this period but retained a proliferation potential. Indeed, at the end of the 3-week culture, T-ALL cells grew back when they were cultured in normoxia (supplemental Figure 1B). Annexin-V staining showed that after 4 days of hypoxia, T-ALL cells that persisted did not exhibit significant apoptosis (Figure 1B). Of note, higher apoptotic cells could be detected, especially at 1% O2 (median levels <6%), when a larger gating strategy was applied, indicating that low O2 may induce some cells to die (data not shown). Measuring lactate dehydrogenase levels in culture media, indicative of unspecific release of this intracytoplasmic enzyme caused by cell death, shows a very slight increase only at 1% O2, further supporting limited apoptosis induction in hypoxia (supplemental Figure 1C). Further analyzes showed that hypoxia rather impacted T-ALL growth by increasing quiescence and reducing cell cycle progression. Indeed, the percentage of leukemic cells in G0 was 33% and 40% in, respectively, 3.5% O2 and 1% O2 vs 20% in 21% O2, whereas 12% and 8% of cells in hypoxia vs 22% of cells in normoxia were in the S phase of cell cycle (Figure 1C; supplemental Figure 1D). As cell exposure to hypoxic conditions may also alter energetic metabolism through mitochondrial morphology, size, and mean velocity, we next incubated T-ALL cultured in various O2 concentrations with MTG and TMRE. Low MTG and TMRE detection was observed in hypoxic compared with normoxic T-ALL cells, indicating mitochondrial mass decrease and weaker activity or depolarization of the mitochondria membrane (Figure 1D). Increased anaerobic glycolysis was observed with elevation of lactate levels in T-ALL culture medium as O2 levels decreased, further indicative of metabolic switch in hypoxia (Figure 1E). Altogether these data suggest an increased quiescence and a significant mitochondrial rewiring in leukemic cells under hypoxia.
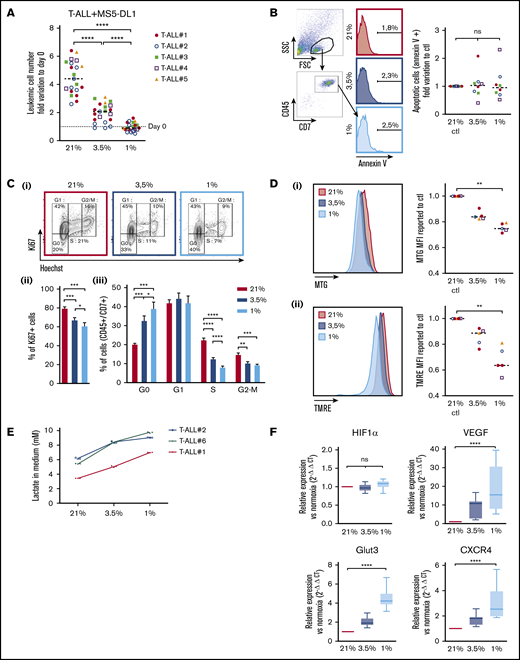
Hypoxia modulates apoptosis, cell cycle, and metabolism in T-ALL. (A) Growth of T-ALL in conditions of low and high O2 levels. Shown are the numbers of leukemic cells after 4 days of culture in normoxia and hypoxia expressed as fold variation compared with number of cells plated at day 0 in contact with MS5-DL1 cells. Every dot is the mean of technical triplicates for 1 experiment. T-ALL #1, n = 6exp; T-ALL #2, n = 6exp; T-ALL #3, n = 4exp; T-ALL #4, n = 3exp; and T-ALL #5, n = 2exp. (B) Apoptosis levels for T-ALL in culture at high and low O2 levels. Shown are fold variation of apoptotic cells relative to control, gated on lymphocyte cells. Every experiment was done in technical triplicate. T-ALL #1, T-ALL #2, T-ALL #3, and T-ALL #4, n = 2exp for each T-ALL. (C) Cell cycle analysis of T-ALL in high and low O2 levels. (i) Representative plots of Ki67/Hoechst staining of T-ALL #1. Proportion of Ki67+ leukemic cells (ii) and proportion of cells in G0, G1, S, and G2/M phases (iii). Shown are mean ± SEM of cultures with T-ALL #1 and T-ALL #3, n = 6exp. (D) Metabolic status of T-ALL in high and low O2 levels. MTG (i) and TMRE (ii) staining of a representative experiment (T-ALL #2) and MFI from T-ALL cultured in hypoxia reported to controls. Every experiment was done in triplicate. T-ALL #1, T-ALL #2, T-ALL #4, and T-ALL #5, n = 1exp for each T-ALL except for T-ALL #1, which was n = 2exp. (E) Lactate levels in T-ALL medium cultured in hypoxia. The blasts were cultured for 3 days in hypoxia or normoxia. The measure of lactate levels was performed on the culture medium according to the manufacturer protocol (lactate assay kit: 03183700; Roche). Shown are mean ± standard deviation of lactate triplicate values. One experiment was done with each leukemia sample. (F) Relative mRNA expression levels of HIF-1α, Glut3, VEGF, and CXCR4 genes. Tested on T-ALL #1, T-ALL #2, T-ALL #3, and T-ALL #4, n = 9exp. Statistics were done using the Friedman test: *P < .05, **P < .01, ***P < .001. exp, experiment.
Hypoxia modulates apoptosis, cell cycle, and metabolism in T-ALL. (A) Growth of T-ALL in conditions of low and high O2 levels. Shown are the numbers of leukemic cells after 4 days of culture in normoxia and hypoxia expressed as fold variation compared with number of cells plated at day 0 in contact with MS5-DL1 cells. Every dot is the mean of technical triplicates for 1 experiment. T-ALL #1, n = 6exp; T-ALL #2, n = 6exp; T-ALL #3, n = 4exp; T-ALL #4, n = 3exp; and T-ALL #5, n = 2exp. (B) Apoptosis levels for T-ALL in culture at high and low O2 levels. Shown are fold variation of apoptotic cells relative to control, gated on lymphocyte cells. Every experiment was done in technical triplicate. T-ALL #1, T-ALL #2, T-ALL #3, and T-ALL #4, n = 2exp for each T-ALL. (C) Cell cycle analysis of T-ALL in high and low O2 levels. (i) Representative plots of Ki67/Hoechst staining of T-ALL #1. Proportion of Ki67+ leukemic cells (ii) and proportion of cells in G0, G1, S, and G2/M phases (iii). Shown are mean ± SEM of cultures with T-ALL #1 and T-ALL #3, n = 6exp. (D) Metabolic status of T-ALL in high and low O2 levels. MTG (i) and TMRE (ii) staining of a representative experiment (T-ALL #2) and MFI from T-ALL cultured in hypoxia reported to controls. Every experiment was done in triplicate. T-ALL #1, T-ALL #2, T-ALL #4, and T-ALL #5, n = 1exp for each T-ALL except for T-ALL #1, which was n = 2exp. (E) Lactate levels in T-ALL medium cultured in hypoxia. The blasts were cultured for 3 days in hypoxia or normoxia. The measure of lactate levels was performed on the culture medium according to the manufacturer protocol (lactate assay kit: 03183700; Roche). Shown are mean ± standard deviation of lactate triplicate values. One experiment was done with each leukemia sample. (F) Relative mRNA expression levels of HIF-1α, Glut3, VEGF, and CXCR4 genes. Tested on T-ALL #1, T-ALL #2, T-ALL #3, and T-ALL #4, n = 9exp. Statistics were done using the Friedman test: *P < .05, **P < .01, ***P < .001. exp, experiment.
Hypoxia induces HIF target gene expression in T-ALL
Cell adaptation to hypoxia requires the activation of transcriptional programs that coordinate expression of genes involved in oxygen delivery (notably via angiogenesis) and metabolic adaptation (via glucose uptake) but also genes such as those implicated in cell trafficking in and out of hypoxic tissue microenvironments (via chemotactic responsiveness to SDF1/CXCR4).31 First, we validated the induction of the hypoxic state in our culture through the expression of HIF-1α. As expected, the transcriptional expression of HIF-1α remained equivalent in the leukemic cells regardless of the O2 levels (Figure 1F; supplemental Figure 1E), whereas HIF-1α protein was stabilized and translocated in the nucleus of T-ALL cells in hypoxic cultures (supplemental Figures 1F and 3Bi), triggering increased expression of target genes such as vascular and epithelial growth factor (VEGF), glucose transporter 3 (GLUT3 has both a higher affinity for glucose and at least a fivefold greater transport capacity than GLUT1, GLUT2, and GLUT432 ), and C-X-C chemokine receptor type 4 (CXCR4)33 . These expression levels were inversely correlated with O2 levels (Figure 1F). Of note, the level of EPAS1/HIF-2α transcript expression was very low in T-ALL cells, even in hypoxic conditions (supplemental Figure 1D).
Functional status of hypoxic T-ALL cells
Because T-ALL cells cultured in low O2 levels are metabolically distinct from their T-ALL counterparts cultured in normoxia, we tested their functional potentials (ie, growth and leukemia-propagating abilities) using in vitro and in vivo xenograft models. First, we observed that leukemic cells recovered from hypoxia cultures and retain their ability to proliferate in vitro when they are reincubated in normoxia for a long period, starting with same cell numbers. In fact, when leukemic cells were analyzed shortly after secondary culture initiation (eg, at 7 days), a difference in cell number was detected comparing the original cell culture O2 levels (Figure 2A), suggesting a significant hypoxia imprinting on T-ALL growth soon after hypoxia treatment. These differences were abolished when the culture was extended for 28 days regardless of the O2 levels applied to the precultures (Figure 2B), meaning that low O2 tensions maintain the leukemic cells in a slow/quiescent state but do not abolish in vitro growth recovery. Leukemic cells collected after 4 days of hypoxic/normoxic cultures were also injected into immune-deficient NSG mice, and leukemia propagation was measured by regular mouse BM samplings. As expected, leukemia gradually invaded the BM cavity over time (Figure 2C). Among the 3 tested samples, 2 T-ALL samples (#1 and #2) showed similar ability to propagate disease whether leukemic cells were precultured in hypoxia or normoxia, whereas hypoxic leukemic blasts of T-ALL#3 were more aggressive (Figure 2D). Altogether, these results show that T-ALL samples maintain their in vitro and in vivo growth potential despite hypoxia-induced quiescence and metabolic changes.
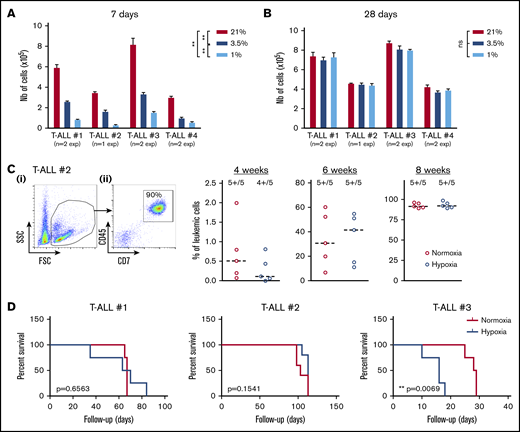
Hypoxia impacts T-ALL cell regrowth activity in vitro and in vivo. (A-B) Growth of T-ALL after hypoxia cultures have been stopped. (A) Leukemic cell numbers of T-ALL precultured in low and high O2 levels after replating 7 days at 21% of O2 with MS5-DL1 stromal cells. (B) Same except the secondary cultures were maintained for 28 days. Every experiment was done in triplicate. Shown are mean ± SEM of cultures with each T-ALL. (C) Engraftment levels of T-ALL after cultures in low and high O2 levels. (i) Representative flow cytometry analysis 8 weeks after transplantation of mouse #1 BM injected with T-ALL #2 precultured in normoxia. (ii) Kinetic of leukemia development in BM after transplantation of 500 cells of T-ALL #2 precultured in normoxia or hypoxia. Shown are percent of leukemic (human CD45+CD7+) cells. (D) Survival curves of mice transplanted with 500 leukemic cells isolated from cultures in normoxia or in hypoxia (4-5 mice per condition). Statistics were determined with the Friedman test and the log-rank (Mantel-Cox) test for mice survival: **P < .01, ***P < .001.
Hypoxia impacts T-ALL cell regrowth activity in vitro and in vivo. (A-B) Growth of T-ALL after hypoxia cultures have been stopped. (A) Leukemic cell numbers of T-ALL precultured in low and high O2 levels after replating 7 days at 21% of O2 with MS5-DL1 stromal cells. (B) Same except the secondary cultures were maintained for 28 days. Every experiment was done in triplicate. Shown are mean ± SEM of cultures with each T-ALL. (C) Engraftment levels of T-ALL after cultures in low and high O2 levels. (i) Representative flow cytometry analysis 8 weeks after transplantation of mouse #1 BM injected with T-ALL #2 precultured in normoxia. (ii) Kinetic of leukemia development in BM after transplantation of 500 cells of T-ALL #2 precultured in normoxia or hypoxia. Shown are percent of leukemic (human CD45+CD7+) cells. (D) Survival curves of mice transplanted with 500 leukemic cells isolated from cultures in normoxia or in hypoxia (4-5 mice per condition). Statistics were determined with the Friedman test and the log-rank (Mantel-Cox) test for mice survival: **P < .01, ***P < .001.
Hypoxia and T-ALL chemoresistance
We then assumed that the intrinsic T-ALL drugs sensitivity might differ whether the leukemic cells were cultured in hypoxia or normoxia. To challenge this hypothesis, leukemic cells were preincubated 24 hours in hypoxia or normoxia and then treated for an additional 72 hours in medium containing 10 nM vincristine sulfate, 500 nM cytarabine, or 100 nM dexamethasone while maintaining respective O2 tension. At the end of the chemotherapy treatments, a difference in the harvested leukemic cell number was detected between hypoxic and normoxic conditions, with more live cells after vincristine treatment in hypoxia than in normoxia (Figure 3A). By calculating the percentage of live cells after drug exposure, we further observed that hypoxic T-ALL cells displayed a lower sensitivity to cell cycle–related drugs (ie, vincristine and cytarabine) but also to dexamethasone compared with normoxic cells (Figure 3B; supplemental Figure 2A). Importantly, leukemic cells grew back in vitro in permissive conditions only when live T-ALL cells had been treated 72 hours with 10 nM vincristine in hypoxia and not in normoxia (Figure 3C). Similarly, cells treated with vincristine in hypoxia before transplant in immune-deficient NSG mice generated leukemia faster in the mouse BM. Mice receiving drug-treated hypoxic cells succumbed 2.5 to 10 weeks before the mice injected with leukemic cells treated with vincristine in normoxia (Figure 3D-E; supplemental Figure 2B-C). These results indicate that hypoxia lowers T-ALL sensitivity to chemotherapy and provides a resistance status.
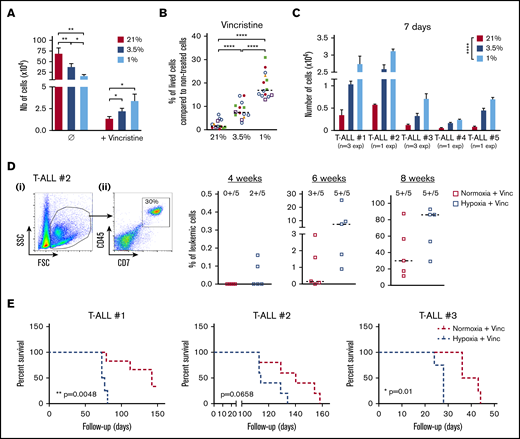
Hypoxia enhances T-ALL chemoresistance. (A-B) Effect of vincristine on T-ALL resistance in high and low O2. (A) Numbers of live cells recovered after treatment during 72 hours with 10 nM (+vincristine) or without (Ø) vincristine. Mean ± SEM of triplicate cultures are represented. Shown are mean ± SEM of cultures with T-ALL #1, T-ALL #, T-ALL #3, T-ALL #4, and T-ALL #5, n = 9 experiments. (B) Same result is presented in percentage of live cells after treatment (+vincristine in panel A) compared with nontreated (Ø in panel A) cells. Every experiment was done in triplicate. Every dot is the mean of those triplicates with T-ALL #1, n = 3exp; T-ALL #2, n = 5exp; T-ALL #3, n = 3exp; T-ALL #4, n = 2exp; and T-ALL #5, n = 1exp. (C) Leukemic cell production after 7 days in normoxia without treatment, following T-ALL treatment with vincristine in normoxia or hypoxia. Every experiment was done in triplicate. Shown are mean ± SEM of cultures with each T-ALL. (D) Propagating activity of T-ALL treated ex vivo with vincristine in high or low O2 levels. Shown is a kinetic analysis (4, 6, and 8 weeks) of leukemia development in BM after transplantation of 500 leukemic cells of T-ALL #2 recovered from normoxic or hypoxic culture with vincristine treatment, represented in percent of leukemic cells. (i) Representative mouse. (ii) Analysis of 5 mice/group from T-ALL #2. (E) Survival of mice transplanted with 500 cells precultured in normoxia or in hypoxia with vincristine (+Vinc). T-ALL #1, T-ALL #2, and T-ALL #3, 4-5 mice per condition. Statistics were determined using the Friedman test and the log-rank (Mantel-Cox) test for mice survival: *P < .05, **P < .01, ***P < .001. exp, experiment.
Hypoxia enhances T-ALL chemoresistance. (A-B) Effect of vincristine on T-ALL resistance in high and low O2. (A) Numbers of live cells recovered after treatment during 72 hours with 10 nM (+vincristine) or without (Ø) vincristine. Mean ± SEM of triplicate cultures are represented. Shown are mean ± SEM of cultures with T-ALL #1, T-ALL #, T-ALL #3, T-ALL #4, and T-ALL #5, n = 9 experiments. (B) Same result is presented in percentage of live cells after treatment (+vincristine in panel A) compared with nontreated (Ø in panel A) cells. Every experiment was done in triplicate. Every dot is the mean of those triplicates with T-ALL #1, n = 3exp; T-ALL #2, n = 5exp; T-ALL #3, n = 3exp; T-ALL #4, n = 2exp; and T-ALL #5, n = 1exp. (C) Leukemic cell production after 7 days in normoxia without treatment, following T-ALL treatment with vincristine in normoxia or hypoxia. Every experiment was done in triplicate. Shown are mean ± SEM of cultures with each T-ALL. (D) Propagating activity of T-ALL treated ex vivo with vincristine in high or low O2 levels. Shown is a kinetic analysis (4, 6, and 8 weeks) of leukemia development in BM after transplantation of 500 leukemic cells of T-ALL #2 recovered from normoxic or hypoxic culture with vincristine treatment, represented in percent of leukemic cells. (i) Representative mouse. (ii) Analysis of 5 mice/group from T-ALL #2. (E) Survival of mice transplanted with 500 cells precultured in normoxia or in hypoxia with vincristine (+Vinc). T-ALL #1, T-ALL #2, and T-ALL #3, 4-5 mice per condition. Statistics were determined using the Friedman test and the log-rank (Mantel-Cox) test for mice survival: *P < .05, **P < .01, ***P < .001. exp, experiment.
HIF-1α levels impact T-ALL chemoresistance in hypoxia
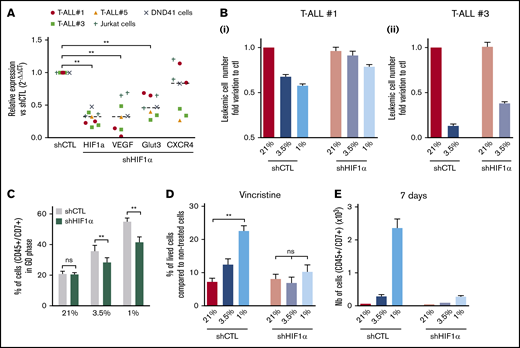
Hypoxia has been shown to promote cancer stemness through HIF factors.34 HIF-1α and HIF-2α are elevated in various cancer patients and associated with poor prognosis.35 HIF-2α transcripts are weakly expressed in T-ALL (supplemental Figure 1D); therefore, we focused our work on HIF-1α and knocked down (KD) its expression to evaluate its role in hypoxia-mediated chemoresistance. The efficiency of the HIF-1α shRNA (shHIF-1α.1) was measured in transduced and fluorescence-activated cell sorter–sorted T-ALL samples cultured in hypoxia or normoxia (supplemental Figure 3A). A significant reduction in mRNA and protein levels was observed using shHIF-1α.1 vector, with 55% to 85% lower mRNA expression relative to control (Figure 4A; supplemental Figure 3B). As a consequence of HIF-1α KD in T-ALL, a significant reduction of its target gene expression VEGF and GLUT3 was detected in all tested T-ALL samples cultured in hypoxia, whereas a decrease in CXCR4 was observed in some samples only (Figure 4A).
Implication of HIF-1α in hypoxia-related T-ALL chemoresistance. (A) Relative mRNA expression of HIF-1α, Glut3, VEGF, and CXCR4 genes in shHIF-1α/T-ALL reported to levels measured in shCTL/T-ALL controls. Every dot represents gene levels of 1 experiment compared with β2m reporter gene levels. Tested on T-ALL #1, T-ALL #3, T-ALL #5, Jurkat, and DND41 cell lines. Shown are results of a total of 8 experiments. (B) Number of shCTL/T-ALL and shHIF-1α/T-ALL cells after 4 days of coculture with MS5-DL1 stromal cells in normoxia or in hypoxia. Data are expressed as fold variation compared with control (shCTL 21%). Tested in triplicate in every experiment. T-ALL #1, n = 6exp (i); and T-ALL #3, n = 2exp (ii). (C) Decreased HIF-1α modifies T-ALL cycling in hypoxia. Shown is the proportion of shCTL/T-ALL and shHIF-1α/T-ALL cells in G0 phase in normoxia or in hypoxia. Shown are mean ± SEM of cultures with T-ALL #1 and T-ALL #3, n = 4exp. (D) Decreased HIF1α increases chemosensitivity of T-ALL in hypoxia. Shown are the percentages of lived shCTL/T-ALL and shHIF-1α/T-ALL cells recovered after treatment during 72 hours with vincristine compared with nontreated cells. Every experiment was done in triplicate. Shown are mean ± SEM of cultures with T-ALL #1 and T-ALL #3, n = 8exp. (E) Leukemic cell production after 7 days in normoxia without treatment, following shCTL/T-ALL and shHIF-1α/T-ALL cell treatment with vincristine in normoxia or hypoxia. Shown are mean ± SEM of technical triplicates of 1 experiment on T-ALL #1. (F) Survival of mice transplanted with 1000 shCTL/T-ALL or shHIF-1α/T-ALL cells isolated after cultures in normoxia or in hypoxia in presence of 10 nM vincristine. T-ALL #1, 5 mice per condition. Statistics were determined using the Wilcoxon test (A, C) or Friedman test (D-E) and the log-rank (Mantel-Cox) test for mice survival: **P < .01, ***P < .001. exp, experiment.
Implication of HIF-1α in hypoxia-related T-ALL chemoresistance. (A) Relative mRNA expression of HIF-1α, Glut3, VEGF, and CXCR4 genes in shHIF-1α/T-ALL reported to levels measured in shCTL/T-ALL controls. Every dot represents gene levels of 1 experiment compared with β2m reporter gene levels. Tested on T-ALL #1, T-ALL #3, T-ALL #5, Jurkat, and DND41 cell lines. Shown are results of a total of 8 experiments. (B) Number of shCTL/T-ALL and shHIF-1α/T-ALL cells after 4 days of coculture with MS5-DL1 stromal cells in normoxia or in hypoxia. Data are expressed as fold variation compared with control (shCTL 21%). Tested in triplicate in every experiment. T-ALL #1, n = 6exp (i); and T-ALL #3, n = 2exp (ii). (C) Decreased HIF-1α modifies T-ALL cycling in hypoxia. Shown is the proportion of shCTL/T-ALL and shHIF-1α/T-ALL cells in G0 phase in normoxia or in hypoxia. Shown are mean ± SEM of cultures with T-ALL #1 and T-ALL #3, n = 4exp. (D) Decreased HIF1α increases chemosensitivity of T-ALL in hypoxia. Shown are the percentages of lived shCTL/T-ALL and shHIF-1α/T-ALL cells recovered after treatment during 72 hours with vincristine compared with nontreated cells. Every experiment was done in triplicate. Shown are mean ± SEM of cultures with T-ALL #1 and T-ALL #3, n = 8exp. (E) Leukemic cell production after 7 days in normoxia without treatment, following shCTL/T-ALL and shHIF-1α/T-ALL cell treatment with vincristine in normoxia or hypoxia. Shown are mean ± SEM of technical triplicates of 1 experiment on T-ALL #1. (F) Survival of mice transplanted with 1000 shCTL/T-ALL or shHIF-1α/T-ALL cells isolated after cultures in normoxia or in hypoxia in presence of 10 nM vincristine. T-ALL #1, 5 mice per condition. Statistics were determined using the Wilcoxon test (A, C) or Friedman test (D-E) and the log-rank (Mantel-Cox) test for mice survival: **P < .01, ***P < .001. exp, experiment.
We next determined whether HIF-1α KD affected T-ALL cell growth in vitro. We first observed that the HIF-1α KD did not interfere with T-ALL cell growth in normoxia, indicating no obvious side effects of the 2 shHIF-1α constructs (Figure 4B; supplemental Figure 3C). Interestingly, the growth of T-ALL cells that is decreased in hypoxia was partially restored on HIF-1α KD (Figure 4B; supplemental Figure 3C). Furthermore, when transduced T-ALL cells were cultured in hypoxia, the proportion of quiescent leukemic cells was lower in HIF-1α KD compared with the control shRNA condition (Figure 4C; supplemental Figure 3D). This indicates that HIF-1α silencing decreases hypoxia-induced quiescence. In accordance with the in vitro data, we observed that HIF-1α KD enhanced leukemic cell propagation of hypoxic T-ALL cells when transplanted in immune-deficient NSG mice but with no major impact on mouse survival (supplemental Figure 3E).
Next, we used HIF-1α KD T-ALL blasts to assess whether HIF-1α inhibition could modify hypoxia-induced drug resistance. We observed that silencing HIF-1α in T-ALL blocked the hypoxia-mediated resistance to vincristine, reaching same levels of live cells as T-ALL cells treated with vincristine in normoxia (Figure 4D). Moreover, these HIF-1α KD T-ALL cells treated with vincristine in hypoxia, unlike control cells, became unable to grow in a drug-free medium for during 7 days in normoxic atmosphere (Figure 4E). These results indicate that HIF-1α is a major effector in the hypoxia-related drug resistance of T-ALL.
HIF-1α levels impact on T-ALL chemosensitivity in vivo
We next sought to determine whether HIF-1α levels also impacted T-ALL chemosensitivity in vivo as HIF1α is stabilized in T-ALL recovered from mouse BM (supplemental Figure 5A). Leukemia propagation was studied using a (1:1) competitive transplantation of shHIF-1α (GFP+) cells mixed with shCTL (Cherry+) cells from T-ALL#1 (Figure 5A-B). In agreement with supplemental Figure 3E, leukemia development was enhanced with shHIF-1α cells that overgrew shCTL cells within 9 weeks (Figure 5C; supplemental Figure 5B). Thereafter, the same mice were treated for a week with a combination of vincristine, l-asparaginase, dexamethasone, and cytarabine.36 As expected, leukemic cell levels dropped down by >75% as a consequence of the treatment (Figure 5C-D). Importantly we also observed a significant drop of shHIF-1α T-ALL cells and inversely an increase of shCTL cells in the treated mouse BM (Figure 5C, E-F). Of note, KD of HIF1α was still efficient in the human leukemic cells engrafted in mouse BM, indicating the shRNA strategy remains functional over time even after their in vivo injection (Figure 5G). These results indicate that HIF-1α silencing sensitizes T-ALL to treatment, further pointing out the importance of HIF-1α levels for T-ALL chemoresistance in vivo.
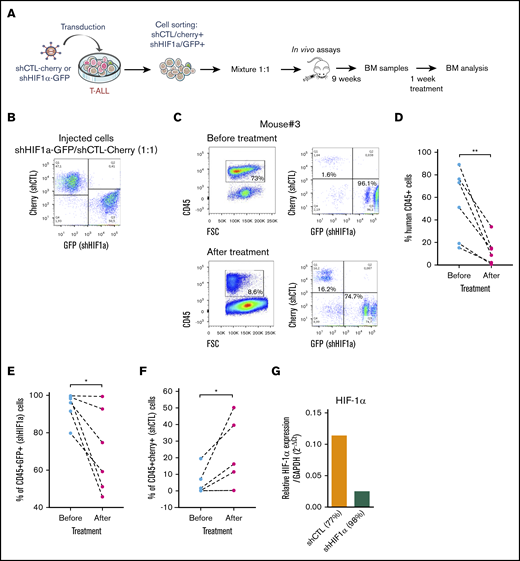
Role of HFI-1α in the development and sensitivity of T-ALL in vivo. (A) Protocol of the experimental settings. T-ALL#1 was transduced with shCTL (Cherry+) or shHIF-1α (GFP+) vectors. Sorted shHIF-1α (GFP+) cells were mixed at a 1:1 ratio with sorted shCTL (Cherry+) cells. A total of 10 000 mixed leukemic cells were transplanted into NSG recipients. (B) Plots of the flow cytometry analysis of the GFP+/Cherry+ cell mixture before mice injection. (C) The NSG mouse recipients were monitored for T-ALL development by BM cell samplings 9 weeks after transplantation. Shown are representative plots from mouse #3. GFP+/Cherry+ percentage are given relative to gated human CD45+ T-ALL cells before and after chemotherapeutic treatments. (D) Efficacy of chemotherapy in 6 mice measured before and after 1 week of drug treatment. The percentage of human CD45+ leukemic cells in the BM is shown for each mouse. (E) Percentage of shHIF-1α/GFP+ cells and (F) of shCTL/Cherry+ cells in human CD45+ leukemic cells before and after treatment of mice. (G) HIF1α expression in T-ALL#1 after transplantation in immune-deficient mice. Shown are results from the BM of 2 mice. BM cells were recovered after 1 week of chemotherapy treatment. Statistics were determined using the Wilcoxon test: *P < .05.
Role of HFI-1α in the development and sensitivity of T-ALL in vivo. (A) Protocol of the experimental settings. T-ALL#1 was transduced with shCTL (Cherry+) or shHIF-1α (GFP+) vectors. Sorted shHIF-1α (GFP+) cells were mixed at a 1:1 ratio with sorted shCTL (Cherry+) cells. A total of 10 000 mixed leukemic cells were transplanted into NSG recipients. (B) Plots of the flow cytometry analysis of the GFP+/Cherry+ cell mixture before mice injection. (C) The NSG mouse recipients were monitored for T-ALL development by BM cell samplings 9 weeks after transplantation. Shown are representative plots from mouse #3. GFP+/Cherry+ percentage are given relative to gated human CD45+ T-ALL cells before and after chemotherapeutic treatments. (D) Efficacy of chemotherapy in 6 mice measured before and after 1 week of drug treatment. The percentage of human CD45+ leukemic cells in the BM is shown for each mouse. (E) Percentage of shHIF-1α/GFP+ cells and (F) of shCTL/Cherry+ cells in human CD45+ leukemic cells before and after treatment of mice. (G) HIF1α expression in T-ALL#1 after transplantation in immune-deficient mice. Shown are results from the BM of 2 mice. BM cells were recovered after 1 week of chemotherapy treatment. Statistics were determined using the Wilcoxon test: *P < .05.
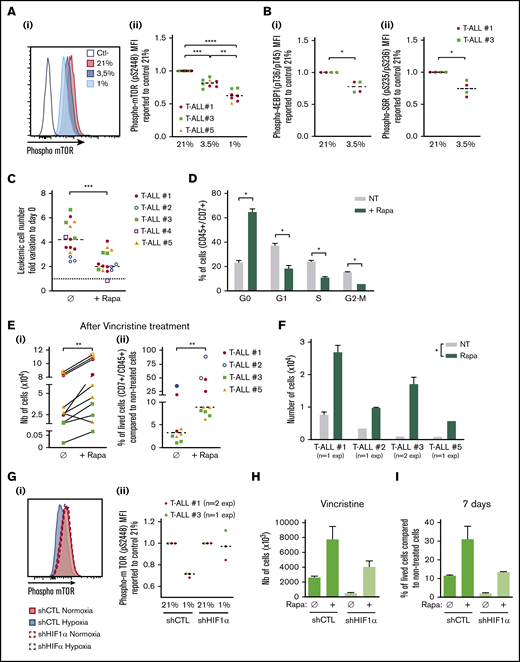
Hypoxia, mTORC1 activation, and chemoresistance
In response to hypoxia, cells rapidly activate a variety of adaptive mechanisms that limit energy expenditure through the inhibition of energy-intensive processes including protein translation.37 Hence, a major mechanism implicates that mTOR activity is inhibited on hypoxia exposure.22 In accordance, activation of the mTOR pathway was decreased in T-ALL cells in hypoxia, with a significantly lower phosphorylation of mTOR and of 2 targets of mTORC1: 4EBP1 and S6R (Figure 6A-B). Interestingly, treating T-ALL with rapamycin (Rapa), an inhibitor of the mTORC1 protein kinase, mimicked the effects of hypoxia. Indeed, Rapa inhibited in vitro leukemic cell growth in normoxia (Figure 6C) by blocking cells in G0 and decreasing G1/S/G2-M progression (Figure 6D). Also, T-ALL blasts pretreated for 45 minutes with Rapa before an additional 3 days of anticancer drug treatment displayed a lower sensitivity to vincristine, cytarabine, or dexamethasone in normoxia (Figure 6E; supplemental Figure 4). Furthermore, only cells pretreated with Rapa could grow back in culture after they had undergone drug treatment (Figure 6F), comparably to what was observed with hypoxic drug-treated cells (Figure 3C). These observations support a cytostatic yet tumor-protective role of Rapa, as previously discussed.38 Interestingly, the decrease of hypoxia-induced mTOR phosphorylation was abolished in HIF-1α KD T-ALL cells (Figure 6G), indicating that HIF-1α contributes to the inhibition of the mTORC1 pathway in hypoxia in T-ALL. In accordance, the expression levels of REDD1/RTP801, known as an inhibitor of mTORC1 that is induced by HIF1α in hypoxia,39 were upregulated in hypoxic T-ALL and downregulated in HIF-1α–silenced T-ALL (supplemental Figure 6A-B). We also observed increased cell recovery when Rapa was added to shHIF-1α T-ALL cells treated with vincristine in hypoxia compared with the same cells cultured in the absence of Rapa (Figure 6H; supplemental Figure 6C). Moreover, only Rapa-treated shHIF-1α leukemic cells in hypoxia recovered high growth rates when vincristine was washed away (Figure 6I). Altogether, these results reveal that mTOR and HIF-1α pathways interact and participate in hypoxia-mediated drug resistance in T-ALL.
Relationship between hypoxia, HIF-1α expression, mTOR activation, and chemoresistance in T-ALL. (A) Phosphorylation of mTOR (pS2448) and (B) 4EBP1 and S6R. Shown are representative histograms (i) and MFI ratio obtained with leukemic cells harvested from hypoxia compared with normoxia cultures (Aii,Bi,Bii). Every dot is the mean of technical triplicates. In panel A, T-ALL #1, n = 4exp; T-ALL #3, n = 4exp; and T-ALL #5, n = 1exp. In panel B, T-ALL#1, n = 2exp; T-ALL#3, n = 1exp. (C) Effect of rapamycin (Rapa) on T-ALL growth in normoxia. Absolute leukemic cell number recovered from every culture condition. The data are expressed as fold variation between the number of cells recovered after 4 days of coculture in presence or absence of rapamycin compared with cells plated at day 0. Every dot is the mean of technical triplicates. T-ALL #1, n = 5exp; T-ALL #2, n = 3exp; T-ALL #3, n = 3exp; T-ALL #4, n = 1exp; and T-ALL #5, n = 3exp. (D) Rapamycin decreases T-ALL cell cycle progression. Shown are proportions of leukemic cells in G0, G1, S, and G2/M phases, during culture at 21% of O2 in presence or absence of rapamycin. Shown are mean ± SEM of triplicate cultures performed with T-ALL #1, T-ALL #2, and T-ALL #4, n = 6exp. (Ei) Rapamycin protects T-ALL from vincristine in normoxia. Shown are the absolute numbers of cells recovered after vincristine treatment in normoxia in presence or absence of rapamycin. (Eii) Same results are presented as percentage of live cells after vincristine treatment in presence (+Rapa) or in absence (Ø) of rapamycin compared with nontreated cells. Every dot is the mean of technical triplicates from T-ALL #1, n = 2exp; T-ALL #2, n = 2exp; T-ALL #3, n = 3exp; and T-ALL #5, n = 3exp. (F) Leukemic cell number recovered 7 days after replating T-ALL pretreated with vincristine ± rapamycin. Shown are mean ± SEM of technical triplicate cultures. (G) HIF-1α impacts on mTOR phosphorylation in low and high O2 concentration. (i) Phosphorylation of mTOR (pS2448) in a representative experiment with T-ALL #1. (ii) Ratio of MFI from shCTL/T-ALL or shHIF-1α/T-ALL cells cultured in hypoxia compared with those cultured in normoxia. Every dot is the mean of technical triplicates obtained with T-ALL #1, n = 2exp; and T-ALL #3, n = 1exp. Statistics were determined using the Friedman test (A), Wilcoxon test (B-E,G), or Mann-Whitney test (F): *P < .05, **P < .01, or ***P < .001. (H) Percentages of live shCTL/T-ALL and shHIF-1α/T-ALL cells recovered after treatment during 72 hours in hypoxia with vincristine in presence (+Rapa) or in absence (Ø) of rapamycin compared with nontreated cells. (I) Leukemic cell production after 7 days in normoxia without treatment after T-ALL. exp, experiment.
Relationship between hypoxia, HIF-1α expression, mTOR activation, and chemoresistance in T-ALL. (A) Phosphorylation of mTOR (pS2448) and (B) 4EBP1 and S6R. Shown are representative histograms (i) and MFI ratio obtained with leukemic cells harvested from hypoxia compared with normoxia cultures (Aii,Bi,Bii). Every dot is the mean of technical triplicates. In panel A, T-ALL #1, n = 4exp; T-ALL #3, n = 4exp; and T-ALL #5, n = 1exp. In panel B, T-ALL#1, n = 2exp; T-ALL#3, n = 1exp. (C) Effect of rapamycin (Rapa) on T-ALL growth in normoxia. Absolute leukemic cell number recovered from every culture condition. The data are expressed as fold variation between the number of cells recovered after 4 days of coculture in presence or absence of rapamycin compared with cells plated at day 0. Every dot is the mean of technical triplicates. T-ALL #1, n = 5exp; T-ALL #2, n = 3exp; T-ALL #3, n = 3exp; T-ALL #4, n = 1exp; and T-ALL #5, n = 3exp. (D) Rapamycin decreases T-ALL cell cycle progression. Shown are proportions of leukemic cells in G0, G1, S, and G2/M phases, during culture at 21% of O2 in presence or absence of rapamycin. Shown are mean ± SEM of triplicate cultures performed with T-ALL #1, T-ALL #2, and T-ALL #4, n = 6exp. (Ei) Rapamycin protects T-ALL from vincristine in normoxia. Shown are the absolute numbers of cells recovered after vincristine treatment in normoxia in presence or absence of rapamycin. (Eii) Same results are presented as percentage of live cells after vincristine treatment in presence (+Rapa) or in absence (Ø) of rapamycin compared with nontreated cells. Every dot is the mean of technical triplicates from T-ALL #1, n = 2exp; T-ALL #2, n = 2exp; T-ALL #3, n = 3exp; and T-ALL #5, n = 3exp. (F) Leukemic cell number recovered 7 days after replating T-ALL pretreated with vincristine ± rapamycin. Shown are mean ± SEM of technical triplicate cultures. (G) HIF-1α impacts on mTOR phosphorylation in low and high O2 concentration. (i) Phosphorylation of mTOR (pS2448) in a representative experiment with T-ALL #1. (ii) Ratio of MFI from shCTL/T-ALL or shHIF-1α/T-ALL cells cultured in hypoxia compared with those cultured in normoxia. Every dot is the mean of technical triplicates obtained with T-ALL #1, n = 2exp; and T-ALL #3, n = 1exp. Statistics were determined using the Friedman test (A), Wilcoxon test (B-E,G), or Mann-Whitney test (F): *P < .05, **P < .01, or ***P < .001. (H) Percentages of live shCTL/T-ALL and shHIF-1α/T-ALL cells recovered after treatment during 72 hours in hypoxia with vincristine in presence (+Rapa) or in absence (Ø) of rapamycin compared with nontreated cells. (I) Leukemic cell production after 7 days in normoxia without treatment after T-ALL. exp, experiment.
Discussion
Resistance to chemotherapy plays a crucial role in relapse of childhood ALL40 but the molecular mechanisms responsible for this resistance are poorly understood. In this work, we showed that hypoxia participates in T-ALL chemoresistance. In solid cancers, it is well established that uncontrolled proliferation leads to profound local hypoxia, associated with tumor development, metabolic changes, metastatic spread, modulation of immune response, and increased mortality.41-43 As in solid tumors, decreased oxygen tensions have also been observed during leukemic progression in bone marrow.43 The aim of this work was to investigate to which extent hypoxia impacts T-ALL growth/propagation and what molecular cross talks are implicated.
We first demonstrated that short- (7 days) and long- (21 days) term hypoxia exposure induced limited growth and enhanced apoptosis and metabolic rewiring in T-ALL. In contrast with B-cell acute lymphoblastic leukemia,44 we did not observe differential response depending on the duration of hypoxia exposure with different human T-ALL samples. T-ALL exposure to short-term and long-term hypoxia led to cell growth arrest, but recovered leukemic cells retained the ability to proliferate when moved in higher O2 conditions. These effects were not mediated by an indirect effect of hypoxia on feeder stromal cells that was described in studies in which the stromal cells promoted the maintenance of hematopoietic stem cells.45 In our experiments, leukemia samples that are able to proliferate for several weeks without stromal cells were similarly impacted by hypoxia whether they had stromal support or not, indicating direct effect of hypoxia on leukemic cells growth. Of note, measuring interleukin-7 and CXCL12 transcript levels in MS5 cells in normoxia and hypoxia revealed enhanced (×1.8) expression of CXCL12 but not of interleukin-7 at 1% O2 (data not shown), indicating that low O2 may nevertheless impact stromal cell cytokine release with potential effects on leukemic cells. Future work is necessary to further study these aspects.
A previous study has shown that leukemia stem cells (LSCs) from T-ALL reside in hypoxic niches of the BM.46 Interestingly, such LSCs were shown to be dependent on a molecular loop implicating HIF-1α and WNT/β-catenin both being activated in hypoxia. In consequence, interfering with HIF-1α or β-catenin expression/activity reduced the T-ALL LSC frequency.46 In accordance with these results, when T-ALL were cultured in hypoxia (eg, in HIF-1α stabilization conditions before transplantation in NSG mice), we observed that leukemic samples had at least conserved LSC activity even when their ex vivo growth and metabolic activities were severely modified. Better preservation and increased chemoresistance of leukemia-initiating cells under hypoxia could partly explain the results of a recent study showing the increased capacity of T-ALL cell lines treated with dexamethasone in hypoxia to generate T-ALL with a resistant phenotype to glucocorticoids.47 Increased dormancy of T-ALL would allow a thinner selection of drug-resistant cells. We have previously observed a similar dormancy status of leukemic cells harvested from adipocyte-enriched BM compared with hematopoietic-enriched BM, indicating that such BM niches are chemoresistant niches.48 However we were unable to demonstrate increased hypoxia in adipocyte-enriched BM. Expression analyses did not reveal any enrichment of hypoxia signature in T-ALL cells from adipocyte-rich vs -poor BM.
Besides specific interactions in BM niches, T-ALL cells endure variably severe hypoxic levels regarding their precise location. We observed significant effects of hypoxia on chemoresistance from the concentration of 3.5% O2, which is in the upper range of the O2 concentration gradient in the BM.49 Thus, our observations agree with the findings of the Lo Celso team, who shows that T-ALL infiltrates the BM and survives chemotherapy independently of stable interactions with specific microenvironments.15 In fact the hypoxia found in the BM may favor the blast attraction, because HIFs orchestrate the expression of a panel of factors, such as CXCR4 and GLUT1, that participate in T-ALL spreading/growth/survival.50,51
In the present study, we brought to light the effect of hypoxia and its potential impact on T-ALL chemoresistance, especially regarding HIF-1α expression pattern, supporting the observation of increased number of LSCs in hypoxic niches.46 We indeed show that HIF-1α slows down T-ALL growth through increased quiescence of leukemic cells, inducing drug resistance. In fact, HIF-1α is overexpressed in many tumors, including some hematologic malignancies.52 HIF-1α can thus be overexpressed in some T-ALL as a consequence of disabling mutations of Von Hippel-Lindau,53 and HIF-1α inhibitors may improve therapeutics in many hemopathies without impacting the self-renewal and differentiation of normal HSCs.54,55 Similarly, in acute promyelocytic leukemia, HIF-1α antagonistic RNAs have antileukemic activity and extend survival of mice. HIF-1α antagonistic RNAs in association with all transretinoic acid (ATRA) eradicate leukemia, without affecting normal HSCs.56 In our study, HIF-1α silencing promoted T-ALL proliferation in hypoxia, enhancing their sensitivity to vincristine commonly used for T-ALL treatment. Furthermore, T-ALL cells with low HIF-1α expression outcompeted T-ALL cells with normal HIF-1α levels in vivo, indicating that HIF-1α is a brake for leukemia growth in mice. This might be particularly true in the first period of T-ALL infiltration, because their expansion is very slow, as elegantly previously shown in a very aggressive model of mixed-lineage leukemia–eleven-nineteen leukemia mouse B-cell acute lymphoblastic leukemia using intravital microscopy.57 On the other hand, silencing HIF-1α increased chemosensitivity, pointing to HIF-1α as an interesting therapeutic target.
Here, we also describe that the mTORC1 pathway participates in T-ALL chemoresistance in relation with HIF-1α. mTORC1 is a central regulator of cell metabolism because it promotes the synthesis of proteins, lipids, and nucleotides, as well as induces a glycolytic phenotype.58 Because glycolysis is the only reliable source of ATP under the fluctuating O2 pressures detected in the BM,59 mTORC1 was expected to interact with HIF-1α in T-ALL. Accordingly, we observed that activation of mTOR is diminished in T-ALL under hypoxia. Also, REDD1/RTP801, a target gene of HIF-1α that inhibits mTORC1 activation in hypoxia,39 was found to be sensitive to O2 pressures and to HIF-1α expression in T-ALL. However, we were not able to functionally implicate REDD1 in the hypoxia/mTOR-mediated chemoresistance loop as gain and loss of REDD1 function in T-ALL unexpectedly revealed a positive rather than negative action on leukemic growth (L.F. and B.U., unpublished data, 17 January 2017). REDD1 has paradoxical roles in carcinogenesis depending on the cellular context, acting as an oncogene or as a tumor suppressor gene.60-62 Addressing REDD1 function in T-ALL will thus require additional work.
Interestingly, Rapa, a well-known inhibitor of mTORC1, mimicked the effects of hypoxia in normoxic T-ALL, including slow cell cycle progression and chemoresistance (ie, enhanced cell recovery after the cessation of drug treatment). These results outline potential adverse effects of using mTORC1 inhibitors in T-ALL treatment,63 as also discussed previously.38 In the past years, several PI3K/Akt/mTOR signaling pathway targeting small molecules have been developed, showing potential therapeutic efficacy in hematologic malignancies, alone or in combination with chemotherapeutic drugs.64 However, the effects of mTOR inhibitors may vary depending on the pathology, and their use might worsen the development of certain leukemias. For instance, in mixed-lineage leukemia–driven leukemia, hyperactivation of mTOR pathway causes LSCs to enter the cell cycle, compromising their stability and reducing their capacity to generate leukemia.65 Following this idea, use of mTOR inhibitors may therefore promote cell quiescence and thereby favor chemoresistance and relapse. Although the therapeutic advantages of using inhibitors of the PI3K/mTOR pathway to overcome steroid resistance in T-ALL are important, these conclusions were drawn from results obtained with cell lines and remain to be confirmed with T-ALL primary cells.66-68 In fact, our experiments that were done with patient cells show that inhibition of mTOR in T-ALL slows down T-ALL propagation, which confers obvious interesting short-term antileukemic effects. However, Rapa mimics some biological effects of hypoxia, and it also induces a significant proportion of leukemic cells to escape drug treatment. Hence, the use of mTORC1 inhibitors for T-ALL patient treatment may have long-term adverse effects, with a potentially increased risk of relapse from quiescent chemoresistant leukemic cells.
For data sharing, please contact the corresponding author at benjamin.uzan@cea.fr.
The current affiliation for S.P. is INSERM U1053-BaRITOn-Equipe Oncogénèse des Lymphomes Cutanés, Université de Bordeaux, Bordeaux, France.
Acknowledgments
Mouse work was facilitated by Silvia Vincent-Naulleau, Julien Tilliet, and Caroline Devanand from the Institut National de la Santé et de la Recherche Médicale/Commissariat a l'Energie Atomique et aux Energies Alternatives (IRCM/CEA) animal facility. The authors thank Julien Rucci for technical help during experiments, and Camille Gobeaux from Service de Diagnostic Biologique Automatisé (Hôpital Cochin) for lactate measurement. The lentivectors were produced by Guillaume Piton and Didier Busso from the CiGex Platform, cell sorting was performed by Nathalie Deschamps at the Flow Cytometry platform, and immunofluorescence was done at the Microscopy platform with help from Lamya Ibrah (all from the Institute of Cellular and Molecular Radiobiology, Fontenay-aux-Roses, France). Raul Duran from Cabimer (Seville, Spain) and Paul-Henri Roméo, from IRCM (Fontenay-aux-Roses, France) provided a critical review of the manuscript.
This work was supported by INSERM, CEA, Université de Paris, Université Paris Saclay, the Association Laurette Fugain, and Fondation ARC (Équipe Labellisée). L.F. was funded by the Ligue Nationale Contre le Cancer (LNCC). The laboratory for this work received the LNCC label.
Authorship
Contribution: L.F. designed and performed experiments, analyzed data, and wrote the manuscript; L.F., J.C., S.C., L.R., C.L.M., and B.U. performed experiments; I.N. supervised the molecular experimental design; J.C., C.L.M., S.P., I.N., R.H., M.-L.A., and F.M. gave valuable advice during experiments and during the writing of the manuscript; T.L., A.P., A.B., and P.B. provided patient samples and clinical data; F.P. and B.U. coordinated and supervised the study and wrote the paper; and all authors reviewed the manuscript.
Conflict-of-interest disclosure: The authors declare no competing financial interests.
Correspondence: Benjamin Uzan, Laboratoire des Cellules Souches Hématopoïétiques et Leucémiques, UMR 1274, IRCM, CEA, 18 Route du Panorama, 92260 Fontenay-aux-Roses, France; e-mail: benjamin.uzan@cea.fr.

