

Key Points
Delayed early T-cell recovery, a higher Treg/Tcon ratio, and increased PD-1 expression on memory T cells were observed after haplo-HCT.
Expansion of functionally impaired immature CD56brightCD16− NK cells after haplo-HCT can be enhanced with in vitro interleukin-15 priming.

Abstract
Administration of posttransplant cyclophosphamide (PTCy) has significantly expanded the number of patients undergoing HLA-haploidentical hematopoietic cell transplantation (haplo-HCT). To examine immune reconstitution in these patients, we monitored T- and natural killer (NK)-cell recovery in 60 patients receiving bone marrow or peripheral blood stem cell (PBSC) grafts after haplo-HCT with PTCy and 35 patients receiving HLA-matched donor PBSC grafts with standard graft-versus-host disease (GVHD) prophylaxis. Compared with HLA-matched recipients, early T-cell recovery was delayed in haplo-HCT patients and skewed toward effector memory T cells with markedly reduced naive T cells. We found higher regulatory T (Treg)-cell/conventional T (Tcon)-cell ratios early after HCT and increased PD-1 expression on memory T cells. Within the haplo-HCT, patients who did not develop chronic GVHD (cGVHD) had higher PD-1 expression on central and effector memory CD4+ Treg cells at 1 month after transplant. These findings suggest an immunologic milieu that promotes immune tolerance in haplo-HCT patients. NK cells were decreased early after haplo-HCT with preferential expansion of immature CD56brightCD16− NK cells compared with matched donor transplants. One month after transplant, mass cytometry revealed enrichment of immature NK-cell metaclusters with high NKG2A, low CD57, and low killer-cell immunoglobulin-like receptor expression after haplo-HCT, which partially recovered 3 months post-HCT. At 2 months, immature NK cells from both groups were functionally impaired, but interleukin-15 priming corrected these defects in vitro. Increased immature/mature NK-cell ratios were associated with cytomegalovirus reactivation and increased incidence of cGVHD after haplo-HCT. These homeostatic imbalances in T- and NK-cell reconstitution after haplo-HCT reveal opportunities for early immune-based interventions to optimize clinical outcomes.
Introduction
HLA-haploidentical hematopoietic cell transplantation (haplo-HCT) has become a preferred transplant modality in patients who lack a readily available HLA-matched donor.1,2 This has been made possible by the development of novel strategies that markedly reduce the incidence of graft failure and severe graft-versus-host disease (GVHD), the major complications associated with HLA-mismatched transplants.3-6 Although different platforms for haplo-HCT have been developed, the administration of posttransplant cyclophosphamide (PTCy) on days +3 and +4 has become the most frequent approach since it is relatively easy to implement and does not require ex vivo graft manipulation.6 Multiple registry and single center studies have shown that outcomes after haplo-HCT with PTCy are comparable with HLA-matched related and unrelated donor HCT.7-11
Recovery of innate and adaptive immune systems is needed to provide effective graft versus leukemia (GVL) and prevent posttransplant infections.12-14 While the kinetics of immune reconstitution and its correlation with post-HCT outcomes are well established in the setting of HLA-matched transplants, there are relatively little data in patients receiving PTCy after haplo-HCT.15,16 This is particularly relevant in the context of recent reports showing an increased incidence of viral infections, including cytomegalovirus (CMV) reactivation, after haplo-HCT with PTCy, suggesting T- and natural killer (NK)-cell immune impairment.17-21 Killer-cell immunoglobulin-like receptor (KIR) ligand or KIR haplotype mismatch also do not appear to impact outcomes after haplo-HCT with PTCy, suggesting abrogation of the NK-cell-mediated GVL effect after PTCy.22,23
To examine the dynamics of immune reconstitution after haplo-HCT with PTCy, we prospectively monitored immune recovery in a cohort of 60 adult patients who underwent haplo-HCT with PTCy and a contemporaneous cohort of 35 adult patients receiving related or unrelated HLA-matched donor transplant (MD-HCT) with standard GVHD prophylaxis. Using flow and mass cytometry to monitor recovery of innate and adaptive immunity and NK-cell functional assays, we found significant impairment of both T- and NK-cell reconstitution early after haplo-HCT. These studies suggest that novel strategies to enhance early immune reconstitution in patients receiving PTCy-based haplo-HCT may further enhance transplant outcomes in these patients.
Methods
Patients and sample collection
This study included 95 patients who underwent allogeneic HCT at the Dana-Farber Cancer Institute and Brigham and Woman’s Hospital (Boston, MA) between November 2011 and November 2018. Sixty patients received stem cells from HLA-haploidentical donors (haplo-HCT group), and 35 had HLA-matched (8/8) related (11/35) or unrelated (24/35) donors (MD-HCT group). Both cohorts received reduced-intensity conditioning. GVHD prophylaxis consisted of PTCy (50 mg/kg) on days +3 and +4 and tacrolimus (TAC) plus mycophenolate mofetil for haplo-HCT patients and TAC plus methotrexate (MTX) for MD-HCT patients. Blood samples were obtained at 1, 2, 3, 6, 9, 12, 18, and 24 months after transplant for analysis of immune reconstitution (supplemental Table 1). Samples obtained after relapse were excluded from analysis. For mass cytometry and NK functional assays, samples were also collected from healthy donors (HDs; 6 females and 6 males) with a median age of 48.5 years (range, 23-68 years). Written informed consent was obtained from all patients prior to sample collection, in accordance with the Declaration of Helsinki. Protocol approval was obtained from the Human Subjects Protection Committee of the Dana-Farber/Harvard Cancer Center. Detailed descriptions of transplant procedures and sample processing are provided in supplemental Methods.
Monitoring immune reconstitution
A panel of directly conjugated monoclonal antibodies (supplemental Table 2) was used to define functionally distinct immune cell subsets and homeostatic characteristics of each subset. After staining, cells were acquired on a Fortessa LSR flow cytometer (BD) and analyzed using FACSDiva software (BD). The cell gating strategy and markers used for cell subset definition are described in supplemental Figures 1 and 2.
NK-cell characterization
To examine NK-cell phenotype early after transplant, cryopreserved samples obtained 1 month after HCT were analyzed using mass cytometry with a panel of 35 metal-tagged antibodies (supplemental Table 3).24 Samples were collected on a Helios-2 mass cytometer (Fluidigm) and data analyzed using Cytobank.25 The methods used to analyze high-dimensional single-cell mass cytometry data are described in supplemental Methods.
NK-cell function after coculture with or without 5 ng/mL interleukin-15 (IL-15) and target cells was evaluated by measuring CD107a as a marker of degranulation and by cytokine (interferon-γ [IFN-γ] and tumor necrosis factor α [TNF-α]) release. A detailed description of sample preparation is provided in supplemental Methods and supplemental Table 4, and an example of the gating strategy is shown in supplemental Figure 4.
Statistical analysis
A detailed description of statistical analyses performed to compare experimental data and patient outcome is provided in the supplemental Methods.
Results
Patient characteristics
Clinical characteristics of patients in the study are summarized in Table 1. Median patient age at the time of transplant was 56 years (range, 20-75 years) for haplo-HCT and 63 years (range, 19-73 years) for MD-HCT (P = .07). Both cohorts were similar in terms of patient/donor sex, CMV patient/donor serostatus, hematologic disease, and disease status at the time of transplant. Median follow-up was 32.8 months (range, 12-92.9 months) for haplo-HCT and 16.8 months (range, 3.6-70.4 months) for MD-HCT patients (P = .07). The 2 groups differed markedly in stem cell source (P < .0001).
Patient characteristics
| Patient characteristics | Haplo-HCT, n (%) | MD-HCT, n (%) | P |
|---|---|---|---|
| Total | 60 (100) | 35 (100) | |
| Age at HCT, median (range), y | 56 (20-75) | 63 (19-73) | .07 |
| Patient sex, male | 32 (53.3) | 25 (71.4) | .13 |
| Donor sex, male | 40 (66.7) | 25 (71.4) | .66 |
| Donor type | — | ||
| Matched related donor | — | 11 (31.4) | |
| Matched unrelated donor | — | 24 (68.6) | |
| Haploidentical related donor | 60 (100) | — | |
| Female donor for a male recipient | 5 (8.3) | 5 (14.3) | .49 |
| Patient or donor CMV serostatus, positive | 36 (60) | 20 (62.5) | 1 |
| Disease | .37 | ||
| ALL | 2 (3.3) | 3 (8.5) | |
| AML | 12 (20) | 10 (28.6) | |
| MDS | 14 (23.3) | 10 (28.6) | |
| NHL | 16 (26.7) | 8 (22.9) | |
| HL | 6 (10) | 1 (2.9) | |
| Other* | 10 (16.7) | 3 (8.5) | |
| Disease status | .09 | ||
| CR | 26 (43.3) | 19 (54.3) | |
| PR | 18 (30) | 4 (11.4) | |
| Rel/IF/untreated | 16 (26.7) | 12 (34.3) | |
| Cell source | <.0001 | ||
| BM | 47 (78.3) | 0 (0) | |
| PBSC | 13 (21.7) | 35 (100) | |
| Follow-up time, median (range), mo | 32.8 (12-92.9) | 16.8 (3.6-70.4) | .07 |
Statistically significant P value is shown in bold.
ALL, acute lymphoid leukemia; AML, acute myeloid leukemia; BM, bone marrow; CR, complete remission; HL, Hodgkin lymphoma; IF, induction failure; MDS, myelodysplastic syndrome; NHL, non-Hodgkin lymphoma; PR, partial remission; Rel, relapsed.
Chronic myeloid leukemia (n = 3), chronic lymphocytic leukemia (n = 3), chronic myelomonocytic leukemia (n = 1), myeloproliferative neoplasm (n = 2), mixed myelodysplastic/myeloproliferative neoplasm (n = 2), and red cell disorder (n = 2).
Clinical outcomes
Haplo-HCT was associated with delayed neutrophil and platelet engraftment compared with MD recipients, with a median time to neutrophil engraftment of 16 days (range, 13-31) after haplo-HCT compared with 14 days (range, 6-26 days) after MD-HCT (P < .01). Median time to platelet engraftment was 26 days (range, 15-63 days) in haplo-HCT vs 19 days (range, 11-24 days) in MD-HCT (P < .01) (supplemental Figure 5). Late graft failure occurred in 1 patient in the haplo-HCT cohort. There was no difference in overall survival (P = .71), progression-free survival (P = .95), cumulative incidence of relapse (P = .28), nonrelapse mortality (P = .7), and grade II to IV (acute GVHD) (P = .28) between the 2 cohorts (supplemental Figure 6). The incidence of chronic GVHD (cGVHD) was significantly lower after haplo-HCT (22% at 2 years) compared with MD-HCT (53% at 2 years, P = .019).
Delayed lymphocyte reconstitution after haplo-HCT
The absolute lymphocyte count was significantly lower in the haplo-HCT group at 1 month but was similar to MD recipients at subsequent time points (Figure 1A). At 1 month, there were also significant differences in the distribution of major lymphocyte subsets in the 2 groups. NK cells were the predominant lymphocyte subset in haplo-HCT patients (median, 35.1% [range, 17.4%-51.2%] vs 17.7% [range, 13.5%-28.6%] in the MD-HCT cohort; P = .015). All other lymphocyte subsets (T, B, and NKT) were significantly lower in the haplo-HCT group at this time point (Figure 1B). Although haplo-HCT patients had a higher proportion of NK cells at 1 month, the absolute number of NK cells was lower in these patients (P = .04; Figure 1C). Haplo-HCT recipients had lower T-cell numbers in the first 3 months and lower B-cell numbers for the first 2 months. In contrast, NKT cells remained lower for all time points up to 2 years in haplo-HCT recipients (Figure 1C).

Reconstitution of major lymphocyte populations after haplo-HCT and MD-HCT. (A) Recovery of absolute lymphocyte counts (ALC) after haplo-HCT and MD-HCT. (B) Distribution of major lymphocyte populations in peripheral blood 1 month after haplo-HCT and MD-HCT. (C) Reconstitution of CD3+ T cells, CD19+ B cells, CD3−CD56+ NK cells, and CD3+CD56+ NKT cells after haplo-HCT and MD-HCT. Haplo-HCT, n = 60; MD-HCT, n = 35. Median cell counts per microliter are represented at each time point. Statistically significant differences are noted in each figure (****P < .0001; ***P < .001; **P < .01; *P < .05; Wilcoxon rank-sum test). See supplemental Table 7 for the median absolute values along with the corresponding interquartile values and P values for panels A and C.
Reconstitution of major lymphocyte populations after haplo-HCT and MD-HCT. (A) Recovery of absolute lymphocyte counts (ALC) after haplo-HCT and MD-HCT. (B) Distribution of major lymphocyte populations in peripheral blood 1 month after haplo-HCT and MD-HCT. (C) Reconstitution of CD3+ T cells, CD19+ B cells, CD3−CD56+ NK cells, and CD3+CD56+ NKT cells after haplo-HCT and MD-HCT. Haplo-HCT, n = 60; MD-HCT, n = 35. Median cell counts per microliter are represented at each time point. Statistically significant differences are noted in each figure (****P < .0001; ***P < .001; **P < .01; *P < .05; Wilcoxon rank-sum test). See supplemental Table 7 for the median absolute values along with the corresponding interquartile values and P values for panels A and C.
Delayed CD4+ Tcon-cell reconstitution after haplo-HCT
Delayed T-cell recovery after haplo-HCT was primarily due to slower CD4+ conventional T (Tcon)-cell reconstitution (Figure 2). Compared with MD-HCT patients, the number of CD4+ Tcon cells was lower for the first 3 months, while the number of CD4+ Treg cells was lower only at 1 month in haplo-HCT patients. However, in both cohorts, CD4+ T cells did not reach normal levels for the entire course of this analysis (Figure 2A). Similarly, the number of CD8+ T cells was also lower in haplo-HCT patients at 1 and 3 months compared with MD-HCT patients, although differences were less marked compared with CD4+ Tcon cells. In both groups, CD8+ T cells reached normal levels by 6 months after transplant (Figure 2A). Delayed CD4+ T-cell recovery after haplo-HCT resulted in a lower CD4/CD8 ratio, especially at 1 month after transplant (P < .0001; Figure 2B). The regulatory T (Treg)-cell/Tcon-cell ratio was higher in the haplo-HCT group compared with MD-HCT group for the first 3 months after transplant, indicating slower recovery of CD4+ Tcon cells compared with CD4+ Treg cells early after haplo-HCT (Figure 2B).
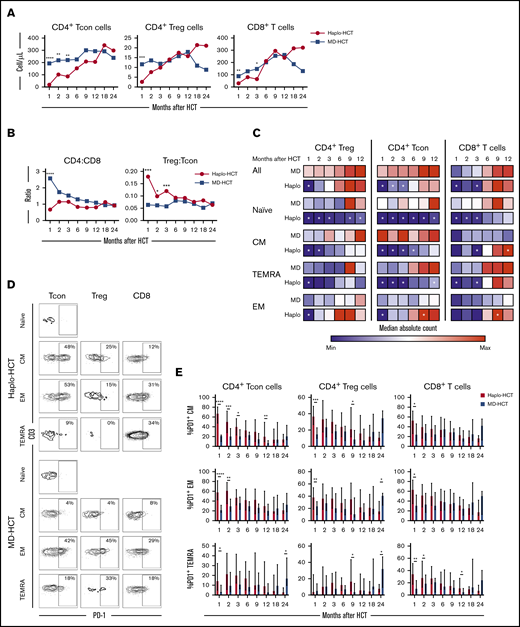
T-cell reconstitution after haplo-HCT and MD-HCT. (A) Peripheral blood reconstitution of CD4+ Tcon, CD4+ Treg, and CD8+ T cells after transplant; the median cell counts per microliter are represented at each time point. (B) Median CD4/CD8 and Treg/Tcon ratio after HCT. (C) Heat map summarizes T-cell reconstitution during the first year after HCT. Absolute median counts were scaled for the lowest and highest values in each group. Red denotes the highest value and blue denotes the smallest value in each group. (D) Flow cytometry plots from 2 representative patients (haplo-HCT and MD-HCT) showing PD-1 expression on T-cell subsets; CD4+ Tcon naive cells were used as internal negative control. (E) Expression of PD-1 on CD4+ Tcon, CD4+ Treg, and CD8+ T cells after haplo-HCT and MD-HCT. Values are expressed as median and range. Treg cells were defined as CD4+CD25+CD127− T cells and Tcon cells as CD4+ conventional (non-T regulatory) T cells. Naive T cells are CD45RO−CD62L+ lymphocytes; CM T cells are CD45RO+CD62L+ lymphocytes; TEMRA T cells are defined as CD45RO−CD62L− lymphocytes and EM T cells are CD45RO+CD62L− lymphocytes. Haplo-HCT, n = 60; MD-HCT, n = 35. Asterisks denote statistically significant differences comparing haplo-HCT and MD-HCT cohorts at specific time points (****P < .0001; ***P < .001; **P < .01; *P < .05). White stars within the heat map (C) denote P < .05 (Wilcoxon rank-sum test). See supplemental Table 8 for the median absolute values along with the corresponding interquartile values and P values for panels A-C.
T-cell reconstitution after haplo-HCT and MD-HCT. (A) Peripheral blood reconstitution of CD4+ Tcon, CD4+ Treg, and CD8+ T cells after transplant; the median cell counts per microliter are represented at each time point. (B) Median CD4/CD8 and Treg/Tcon ratio after HCT. (C) Heat map summarizes T-cell reconstitution during the first year after HCT. Absolute median counts were scaled for the lowest and highest values in each group. Red denotes the highest value and blue denotes the smallest value in each group. (D) Flow cytometry plots from 2 representative patients (haplo-HCT and MD-HCT) showing PD-1 expression on T-cell subsets; CD4+ Tcon naive cells were used as internal negative control. (E) Expression of PD-1 on CD4+ Tcon, CD4+ Treg, and CD8+ T cells after haplo-HCT and MD-HCT. Values are expressed as median and range. Treg cells were defined as CD4+CD25+CD127− T cells and Tcon cells as CD4+ conventional (non-T regulatory) T cells. Naive T cells are CD45RO−CD62L+ lymphocytes; CM T cells are CD45RO+CD62L+ lymphocytes; TEMRA T cells are defined as CD45RO−CD62L− lymphocytes and EM T cells are CD45RO+CD62L− lymphocytes. Haplo-HCT, n = 60; MD-HCT, n = 35. Asterisks denote statistically significant differences comparing haplo-HCT and MD-HCT cohorts at specific time points (****P < .0001; ***P < .001; **P < .01; *P < .05). White stars within the heat map (C) denote P < .05 (Wilcoxon rank-sum test). See supplemental Table 8 for the median absolute values along with the corresponding interquartile values and P values for panels A-C.
Unbalanced recovery of naive and memory T cells after haplo-HCT
To characterize T-cell maturation, we monitored reconstitution of naive, central memory (CM), effector memory (EM), and terminal EM (TEMRA) subsets within each major T-cell population (Figure 2C). There was a profound reduction of naive subsets in CD4+ Tcon, CD4+ Treg, and CD8+ T cells after haplo-HCT, lasting 12 months in the CD4+ compartment and 3 months in the CD8+ compartment. Reconstitution of CM cells was most delayed in CD4+ Tcon cells with reduced absolute counts for 6 months after haplo-HCT. The number of CM CD4+ Treg cells was reduced for 2 months after haplo-HCT. CM CD8+ T cells reconstituted similarly in both groups but reached higher numbers in the haplo-HCT cohort at the 1-year mark. TEMRA subsets were significantly reduced for 3 months within CD4+ Tcon and CD8+ T cells. Finally, EM T cells were only decreased at 1 month in the CD4+ group. After this time point EM T-cell reconstitution was similar or higher in the haplo-HCT group.
Increased PD-1 expression on T cells early after haplo-HCT
Programmed cell death 1 (PD-1) is a coinhibitory receptor and its expression in CD4+ Tcon and CD8+ T cells attenuates T-cell activation and plays an important role in peripheral tolerance.26 We observed increased expression of PD-1 on CD4+ Tcon-cell, Treg-cell, and CD8+ T-cell subsets after haplo-HCT (Figure 2D-E). These differences were evident in all memory subsets in the first 3 months after haplo-HCT with PTCy.
Delayed NK-cell reconstitution with a high CD56brightCD16−/CD56dimCD16+ NK-cell ratio early after haplo-HCT
To characterize NK-cell reconstitution, we divided NK cells into 4 subsets based on the expression of CD56 and CD1627 : CD56brightCD16−, CD56dimCD16+, CD56dimCD16−, and CD56brightCD16+ NK cells (Figure 3A). In HD, CD56brightCD16− NK cells account for 5% to 15% of circulating NK cells and are relatively immature cells with weak cytolytic activity.28 CD56dimCD16+ cells are the predominant NK-cell subset in peripheral blood of HD, with a mature phenotype and strong cytolytic activity.28 CD56dimCD16− NK cells exhibit an immature phenotype,27 while CD56brightCD16+ NK cells represent an intermediate stage of NK-cell maturation with cytotoxicity against tumor cells closer to that of CD56dimCD16+ NK cells but expressing a phenotype similar to CD56brightCD16− NK cells.29 After haplo-HCT, we observed an increase in CD56brightCD16− NK cells with fewer mature CD56dimCD16+ NK cells during the first 6 months compared with MD-HCT group (Figure 3B). Differences in the distribution of CD56dimCD16− NK cells and CD56brightCD16+ NK cells between haplo-HCT and MD-HCT cohorts were less marked. Consistent with these differences, haplo-HCT patients had higher absolute numbers of CD56brightCD16− NK cells and markedly lower numbers of CD56dimCD16+ NK cells during the first 3 months after transplant (Figure 3C). As a result, CD56brightCD16−/CD56dimCD16+ NK-cell ratio was higher in the haplo-HCT group for the first 6 months after transplant, highlighting the imbalanced reconstitution of the 2 major NK subsets in this transplant setting (Figure 3D).

Reconstitution of NK-cell populations after haplo-HCT and MD-HCT. (A) Representative gating strategy used to define NK-cell subsets based on expression of CD56 and CD16. (B) Reconstitution of NK-cell subsets after haplo-HCT and MD-HCT. Values are expressed as median and range. (C) Absolute number of NK-cell subsets in peripheral blood after haplo-HCT and MD-HCT. Median cell counts per microliter are represented at each time point. (D) Median CD56brightCD16−/CD56dimCD16+ NK-cell ratio after haplo-HCT and MD-HCT. Statistically significant differences are noted (****P < .0001; ***P < .001; **P < .01; *P < .05; Wilcoxon rank-sum test). See supplemental Table 9 for the median absolute values along with the corresponding interquartile values and P values for panels C and D.
Reconstitution of NK-cell populations after haplo-HCT and MD-HCT. (A) Representative gating strategy used to define NK-cell subsets based on expression of CD56 and CD16. (B) Reconstitution of NK-cell subsets after haplo-HCT and MD-HCT. Values are expressed as median and range. (C) Absolute number of NK-cell subsets in peripheral blood after haplo-HCT and MD-HCT. Median cell counts per microliter are represented at each time point. (D) Median CD56brightCD16−/CD56dimCD16+ NK-cell ratio after haplo-HCT and MD-HCT. Statistically significant differences are noted (****P < .0001; ***P < .001; **P < .01; *P < .05; Wilcoxon rank-sum test). See supplemental Table 9 for the median absolute values along with the corresponding interquartile values and P values for panels C and D.
NK cells reconstituting early after haplo-HCT have immature phenotypes
To further characterize the dynamics of NK-cell reconstitution, we analyzed samples from patients 1 month after transplant (6 patients after haplo-HCT and 3 patients after MD-HCT) and HDs (n = 3) using a 35-marker mass cytometry panel (see supplemental Table 5 for patient clinical characteristics). In this analysis, MD-HCT patients received sirolimus in addition to TAC and MTX for GVHD prophylaxis (MDs-HCT). At 1 month, the FlowSOM algorithm identified 20 different NK-cell metaclusters (Figure 4A) based on the levels of expression of different markers included in the panel (Figure 4B). These metaclusters naturally subdivided the 4 previously established NK-cell populations: CD56brightCD16−, CD56dimCD16+, CD56dimCD16−, and CD56brightCD16+ (Figure 4A-B).
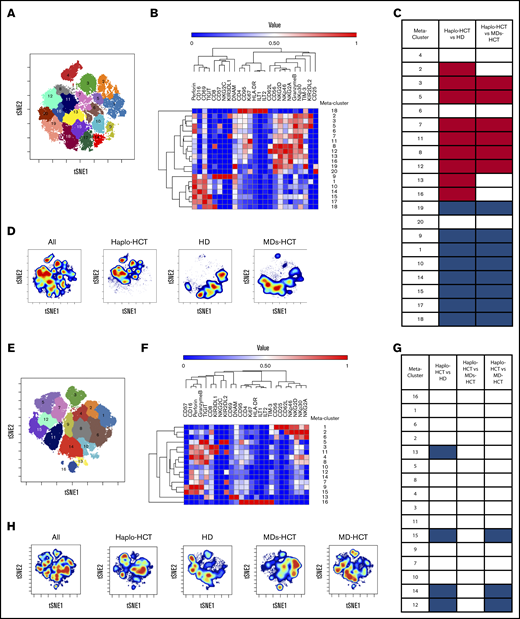
Mass cytometry analysis of NK-cell maturation after haplo-HCT. Mass cytometry analysis was performed using cryopreserved PBMCs obtained 1 and 3 months after transplant (haplo-HCT n = 10, MD-HCT n = 6, MDs-HCT n = 4) and from HDs (n = 7). (A) FlowSOM analysis of all 1-month samples overlaid on viSNE map identified 20 distinct NK-cell metaclusters. (B) Heat map summarizes the expression of different markers in each NK-cell metacluster 1 month after HCT. (C) Relative representation of each NK-cell metacluster in haplo-HCT, MDs-HCT, and HD samples 1 month after HCT. Indicated columns compare representation of each meta-cluster in haplo-HCT vs HD and haplo-HCT vs MD-HCT samples. (D) One-month density viSNE map representation of all NK-cell metaclusters depicting data for all samples (n = 12), haplo-HCT (n = 6), HD (n = 3), and MD-HCT (n = 3). The location of each NK-cell metacluster is the same as in panel A. (E) FlowSOM analysis of all 3-month samples overlaid on viSNE map identified 16 distinct NK-cell metaclusters. (F) Heat map summarizes the expression of different markers in each NK metacluster 3 months after HCT. (G) Relative representation of each NK metacluster in haplo-HCT, MDs-HCT, MD-HCT, and HD samples. Indicated columns compare representation of each metacluster in haplo-HCT vs HD, haplo-HCT vs MDs-HCT, and haplo-HCT vs MD-HCT samples. (H) Three-month density viSNE map representation of all NK-cell metaclusters depicting data for all samples (n = 21), haplo-HCT (n = 8), HD (n = 4), MDs-HCT (n = 3), and MD-HCT (n = 6). For the heat maps median intensity was normalized for the highest value for each marker; red indicates the highest value, and blue represents the lowest value. For the tables shown in panels C and G, blue squares indicate a relative decrease, red squares represent a relative increase, and white squares indicate no change. Only statistically significant changes (P < .05) are reported. For comparison, the Wilcoxon rank-sum test for unpaired group was used. viSNE allows visualization of high-dimensional single-cell data and is based on the t-Distributed Stochastic Neighbor Embedding (t-SNE) algorithm.
Mass cytometry analysis of NK-cell maturation after haplo-HCT. Mass cytometry analysis was performed using cryopreserved PBMCs obtained 1 and 3 months after transplant (haplo-HCT n = 10, MD-HCT n = 6, MDs-HCT n = 4) and from HDs (n = 7). (A) FlowSOM analysis of all 1-month samples overlaid on viSNE map identified 20 distinct NK-cell metaclusters. (B) Heat map summarizes the expression of different markers in each NK-cell metacluster 1 month after HCT. (C) Relative representation of each NK-cell metacluster in haplo-HCT, MDs-HCT, and HD samples 1 month after HCT. Indicated columns compare representation of each meta-cluster in haplo-HCT vs HD and haplo-HCT vs MD-HCT samples. (D) One-month density viSNE map representation of all NK-cell metaclusters depicting data for all samples (n = 12), haplo-HCT (n = 6), HD (n = 3), and MD-HCT (n = 3). The location of each NK-cell metacluster is the same as in panel A. (E) FlowSOM analysis of all 3-month samples overlaid on viSNE map identified 16 distinct NK-cell metaclusters. (F) Heat map summarizes the expression of different markers in each NK metacluster 3 months after HCT. (G) Relative representation of each NK metacluster in haplo-HCT, MDs-HCT, MD-HCT, and HD samples. Indicated columns compare representation of each metacluster in haplo-HCT vs HD, haplo-HCT vs MDs-HCT, and haplo-HCT vs MD-HCT samples. (H) Three-month density viSNE map representation of all NK-cell metaclusters depicting data for all samples (n = 21), haplo-HCT (n = 8), HD (n = 4), MDs-HCT (n = 3), and MD-HCT (n = 6). For the heat maps median intensity was normalized for the highest value for each marker; red indicates the highest value, and blue represents the lowest value. For the tables shown in panels C and G, blue squares indicate a relative decrease, red squares represent a relative increase, and white squares indicate no change. Only statistically significant changes (P < .05) are reported. For comparison, the Wilcoxon rank-sum test for unpaired group was used. viSNE allows visualization of high-dimensional single-cell data and is based on the t-Distributed Stochastic Neighbor Embedding (t-SNE) algorithm.
CD56brightCD16− NK-cell metaclusters (8, 11, 12, 16, 19, and 20) were characterized by a higher expression of inhibitory receptor NKG2A and activating receptors NKp30, NKp46, and NKG2D. Metaclusters 8 and 12 also expressed CD62L, reflecting a more immature phenotype, while metacluster 11 had the highest level of Ki67, a proliferation marker. Metaclusters 19 and 20 also represent the only subsets with CD25 expression and are the only CD56brightCD16− NK-cell metaclusters also present in HDs (Figure 4D).
CD56brightCD16+ NK-cell metaclusters (2, 3, 5, 6, 7, and 13) share similar phenotype with CD56brightCD16− NK-cell metaclusters for NKG2A, NKG2D, NKp30, and NKp46. However, several of these metaclusters showed high expression of KIR (metaclusters 2, 3, 5, and 7), CD57 (metacluster 5), granzyme B (metaclusters 2, 3, 5, 6, 7, and 13), and perforin (metacluster 2, 5, 6, and 13), suggesting an intermediate stage of NK-cell maturation.
CD56dimCD16+ NK-cell metaclusters (1, 9, 10, 14, 15, and 17) expressed higher levels of maturity markers (KIRs and CD57) and activation markers (CD69 and perforin) compared with CD56brightCD16− NK-cell metaclusters. The viSNE map identified a maturation gradient for CD56dimCD16+ NK-cell metaclusters, where metaclusters 15 and 17 represented more immature cells expressing CD16, CD69, perforin, and TIGIT; metaclusters 10 and 14 represented an intermediated maturation stage, expressing also CD57; and metacluster 1 recapitulates the mature CD56dimCD16+ NK cells expressing both CD57 and KIR. Finally, metacluster 9 mirrored memory-like NK cells, with coexpression of CD57 and NKG2C in addition to KIRs. We were also able to identify one metacluster that recapitulated the CD56dimCD16− NK cells (metacluster 18), which expressed low levels of NKp46 and NKG2A, intermediate levels of NKp30, NKG2D and DNAM, and high levels of perforin, TIGIT, CD69, and CD8. One month after haplo-HCT, this analysis showed an enrichment of immature CD56brightCD16− and CD56brightCD16+ NK-cell metaclusters with a reduction of more mature CD56dimCD16+ NK-cell metaclusters compared with HD and MDs-HCT (Figure 4C-D).
We also used the same mass cytometry panel to examine NK cells 3 months after HCT. This comparison included 17 patients (8 after haplo-HCT, 3 after MDs-HCT, and 6 after MD-HCT with TAC/MTX only) and 4 HDs. At this time point, the FlowSOM algorithm identified 16 different NK-cell metaclusters (Figure 4E,F), with fewer immature metaclusters representing CD56brightCD16− (metaclusters 1 and 6) and CD56brightCD16+ NK cells (metacluster 2) and most representing more mature CD56dimCD16+ NK cells (metaclusters 3, 4, 5, 7, 9, 11, 12, 14, and 15). Haplo-HCT samples continued to display a proportional reduction of CD56dimCD16+ NK-cell metaclusters (12, 14, and 15), compared with HD and MD-HCT (Figure 4G and H). However, no differences were observed when compared with the MDs-HCT group. Interestingly, haplo-HCT patients who had experienced CMV reactivation had higher representation of mature CD56dimCD16+KIR+ NK-cell metaclusters (3, 5, and 11) compared with haplo-HCT patients without CMV reactivation, where immature metaclusters were enriched (metaclusters 2, 4, and 6; see supplemental Figure 7).
IL-15 restores NK-cell function after haplo-HCT
To assess NK-cell function, we evaluated NK-cell degranulation and cytokine production after stimulation with K562 target cells. Experiments were carried out with peripheral blood mononuclear cells (PBMCs) obtained 2 months after transplant (haplo-HCT and MD-HCT) and from HD (Figure 5A; see supplemental Table 6 for patient clinical characteristics). After K562 stimulation, NK cells from haplo-HCT and MD-HCT patients exhibited degranulation levels (CD107a) similar to HD NK cells (Figure 5B). However, NK cells from both transplant cohorts had significant impairment of cytokine production, especially for IFN-γ (Figure 5B). IL-15 is critical for the generation and maintenance of NK cells in vivo, and incubation with IL-15 can enhance NK-cell function in vitro.30 To test if IL-15 can overcome defects in NK-cell function in the posttransplant setting, we incubated PBMCs from haplo-HCT, MD-HCT, and HDs for 12 to 15 hours in media containing recombinant human IL-15 (5 ng/mL) and subsequently assessed function after stimulation with K562. IL-15 priming effectively restored IFN-γ secretion from haplo-HCT NK cells to normal levels, with levels of CD107a degranulation and TNF-α secretion after haplo-HCT actually becoming higher than HDs and MD-HCT, respectively (Figure 5B). We also compared the NK-cell function in samples from relapsed vs nonrelapsed patients within the haplo-HCT and MD-HCT cohorts, and no statistical differences were observed (data not shown).

Functional analysis of NK cells after haplo-HCT. Assays were carried out using cryopreserved PBMCs collected 2 months after haplo-HCT (red boxes, n = 9), MD-HCT (black boxes, n = 9) and from HDs (blue boxes, n = 8). Thawed PBMCs were cultured overnight with media alone or media plus IL-15 (5 ng/mL) and then stimulated with K562 target cells (effector to target ratio = 5:1). (A) Flow cytometry plots from a representative haplo-HCT patient showing surface staining of CD107a and intracellular staining for IFN-γ and TNF-α at baseline (PBMC alone), with target cells (PBMC + K562), and with target cells after priming with IL-15 (IL-15-primed PBMC + K562). (B) Summary data for all samples showing percentage of CD107a+, IFN-γ+, and TNF-α+ NK cells upon coculture with K562 cells in the absence or presence of IL-15 priming. The background staining for CD107a, IFN-γ, and TNF-α present at baseline was subtracted. Box and whisker plots show medians, along with minimum and maximum values. Data were compared using the Wilcoxon signed-rank test for paired comparison (**P < .01; *P < .05).
Functional analysis of NK cells after haplo-HCT. Assays were carried out using cryopreserved PBMCs collected 2 months after haplo-HCT (red boxes, n = 9), MD-HCT (black boxes, n = 9) and from HDs (blue boxes, n = 8). Thawed PBMCs were cultured overnight with media alone or media plus IL-15 (5 ng/mL) and then stimulated with K562 target cells (effector to target ratio = 5:1). (A) Flow cytometry plots from a representative haplo-HCT patient showing surface staining of CD107a and intracellular staining for IFN-γ and TNF-α at baseline (PBMC alone), with target cells (PBMC + K562), and with target cells after priming with IL-15 (IL-15-primed PBMC + K562). (B) Summary data for all samples showing percentage of CD107a+, IFN-γ+, and TNF-α+ NK cells upon coculture with K562 cells in the absence or presence of IL-15 priming. The background staining for CD107a, IFN-γ, and TNF-α present at baseline was subtracted. Box and whisker plots show medians, along with minimum and maximum values. Data were compared using the Wilcoxon signed-rank test for paired comparison (**P < .01; *P < .05).
Delayed NK-cell reconstitution correlates with CMV reactivation after haplo-HCT
To assess the potential clinical impact of impaired NK-cell reconstitution, we compared CMV reactivation in both cohorts. Only 3 of 35 MD-HCT patients (8.6%) developed CMV reactivation, with a median of 110 days (range, 27-205 days) to CMV reactivation. In contrast, 18 of 60 haplo-HCT patients (30%) developed CMV reactivation at a median of 36 days (range, 11-100 days; P = .015; Figure 6A). Despite letermovir prophylaxis given to 7 patients after haplo-HCT, this group still experienced more CMV reactivation. Since expression of CD16 distinguishes immature from mature NK cells, we correlated the ratio of CD16−/CD16+ NK cells with the occurrence of CMV reactivation. Patients who developed CMV reactivation had an increased CD16−/CD16+ NK-cell ratio at 1 and 2 months compared with haplo-HCT patients who did not develop CMV reactivation (Figure 6B), suggesting a correlation between delayed NK-cell maturation and CMV reactivation. Analysis of absolute counts of CD16+ and CD16− NK-cell and NK-cell subsets (56brightCD16−, 56dimCD16+, 56brightCD16+, and 56dimCD16−) 1 and 2 months after haplo-HCT showed similar results (supplemental Figure 8). In this analysis, increased numbers of CD16+ NK cells 1 and 2 months after haplo-HCT were significantly associated with a lower incidence of CMV reactivation.
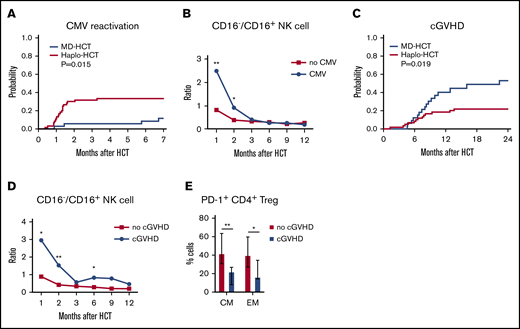
Correlation of immune reconstitution and clinical outcomes after haplo-HCT. (A) Probability of CMV reactivation after haplo-HCT and MD-HCT. (B) Comparison of CD16−/CD16+ NK-cell ratio in patients after haplo-HCT with and without CMV reactivation after transplant. The median values per microliter are represented at each time point (**P < .01; *P < .05). (C) Probability of cGVHD after haplo-HCT and MD-HCT. (D) Comparison of CD16−/CD16+ NK-cell ratio in patients after haplo-HCT with and without cGVHD after transplant; the median values per microliter are represented at each time point. (E) Distribution of PD-1+ CM and EM CD4+ Treg cells at 1 month after haplo-HCT according to cGVHD onset. Values are expressed as median and range. Statistically significant differences are noted (**P < .01; *P < .05; Wilcoxon rank-sum test). CM T cells are defined as CD45RO+CD62L and EM as CD45RO+CD62L− T lymphocytes. See supplemental Tables 10 and 11 for the median absolute values along with the corresponding interquartile values and P values for panels B and D.
Correlation of immune reconstitution and clinical outcomes after haplo-HCT. (A) Probability of CMV reactivation after haplo-HCT and MD-HCT. (B) Comparison of CD16−/CD16+ NK-cell ratio in patients after haplo-HCT with and without CMV reactivation after transplant. The median values per microliter are represented at each time point (**P < .01; *P < .05). (C) Probability of cGVHD after haplo-HCT and MD-HCT. (D) Comparison of CD16−/CD16+ NK-cell ratio in patients after haplo-HCT with and without cGVHD after transplant; the median values per microliter are represented at each time point. (E) Distribution of PD-1+ CM and EM CD4+ Treg cells at 1 month after haplo-HCT according to cGVHD onset. Values are expressed as median and range. Statistically significant differences are noted (**P < .01; *P < .05; Wilcoxon rank-sum test). CM T cells are defined as CD45RO+CD62L and EM as CD45RO+CD62L− T lymphocytes. See supplemental Tables 10 and 11 for the median absolute values along with the corresponding interquartile values and P values for panels B and D.
NK- and T-cell reconstitution associated with cGVHD after haplo-HCT
Consistent with previous reports, haplo-HCT patients had a lower incidence of cGVHD than MD-HCT patients (Figure 6C). To examine whether NK-cell reconstitution influenced the development of cGVHD, we compared the ratio of CD16−/CD16+ NK cells in haplo-HCT patients with and without cGVHD. For this analysis, only cGVHD that occurred within 1 year after transplant was considered. We observed a higher CD16−/CD16+ NK-cell ratio at 1, 2, and 6 months after transplant (P = .04, P = .001, and P = .04, respectively) in patients who developed cGVHD after haplo-HCT (Figure 6D). Analysis of absolute NK-cell counts confirmed that increased numbers of CD16+ NK cells 2 months after haplo-HCT were associated with a lower incidence of subsequent cGVHD (supplemental Figure 8). To determine whether early PD-1 expression influenced subsequent development of cGVHD, we examined the percentage of PD-1+ cells in different T-cell subsets. Within the haplo-HCT cohort, PD-1 expression was higher in CM CD4+ Treg cells and EM CD4+ Treg cells at 1 month in patients who did not develop cGVHD (P = .0023 and P = .0418, respectively; Figure 6E). No differences in PD-1 expression were observed in the CD4+ Tcon-cell compartment regarding the subsequent development of cGVHD.
Discussion
Prompt and successful reconstitution of both T- and NK-cell immunity after HCT is critical for the prevention of GVHD, infection, and relapse, which remain the leading causes of mortality in patients after allogeneic HCT.31 The use of PTCy has revolutionized haplo-HCT by decreasing GVHD and graft failure, but recent studies have reported increased rates of infections, including CMV and community respiratory viruses, highlighting potential immune defects in these patients. Using detailed immunophenotypic and functional assays, our study reveals significant delays in T- and NK-cell recovery in the first 3 months after haplo-HCT with PTCy compared with MD-HCT with conventional GVHD prophylaxis. Delayed recovery of naive T cells along with a significantly higher Treg-cell/Tcon-cell ratio and PD-1 expression on memory CD4+ T cells likely contribute to the low incidence of cGVHD. Delayed NK-cell reconstitution, with the preferential expansion of immature CD56brightCD16−NKG2A+ NK cells, may contribute to the higher rate of CMV reactivation after haplo-HCT.
Delayed T-cell reconstitution after haplo-HCT was primarily driven by a reduced number of CD4+ Tcon cells, with a relative sparing of CD4+ Treg cells, resulting in a higher Treg-cell/Tcon-cell ratio early after transplant. Relative sparing of CD4+ Treg cells after PTCy has been found in previous studies and may be due to higher levels of aldehyde dehydrogenase expression in these cells.15,32-35 We also observed a profound reduction of naive T cells and a predominance of EM cells in all major T-cell populations that persisted for 1 year after haplo-HCT. Increased sensitivity of naive T cells to cyclophosphamide or rapid differentiation of naive into memory/effector T cells after transplant could potentially explain preferential recovery of memory T cells in patients receiving PTCy.33,36 T-cell recovery early after transplant is primarily driven by homeostatic proliferation in response to persistent lymphopenia rather than through generation of new T cells from hematopoietic precursors. However, the prolonged delay of naive T-cell recovery lasting 1 year after haplo-HCT suggests that de novo T-cell generation may also be impaired in this transplant setting.
Regulation of cell survival can also affect T-cell reconstitution after transplant. In CD4+ Tcon cells and CD8+ T cells, activation of PD-1 delivers inhibitory signals that regulate the balance between T-cell activation, tolerance, and terminal differentiation.26,37 Both murine models38,39 and clinical studies40-42 support the importance of PD-1 in maintaining immune tolerance and preventing GVHD. In our analysis, we observed increased expression of PD-1 in all T-cell subsets at early time points after haplo-HCT. The common γ-chain cytokines IL-2, IL-17, IL-15, and IL-21 induce expression of PD-1, especially on memory T-cell subsets,43 and increased levels of these cytokines after transplant may explain the increased expression of PD-1 observed in our haplo-HCT cohort.23 In the haplo-HCT cohort, we also found that patients who did not develop cGVHD had higher PD-1 expression on CM and EM CD4+ Treg cells at 1 month after transplant. We previously demonstrated that PD-1 promotes IL-2–induced CD4+ Treg-cell proliferation and prolongs CD4+ Treg-cell survival in a murine model and in patients receiving low-dose IL-2 therapy for cGVHD.37 These findings are also consistent with previous studies in murine models where PTCy was found to efficiently ameliorate GVHD by preventing CD4+ Treg-cell apoptosis and reducing CD4+ Tcon-cell expansion.44
We observed a profound and persistent reduction of NKT cells in haplo-HCT compared with MD-HCT recipients. In a previous report, NKT cells remained low for 1 to 3 months after haplo-HCT compared with conventional transplant. However, in this study, NKT cells were defined as CD3+CD161+ cells, and haplo-HCT patients received a different conditioning regimen and GVHD prophylaxis that included anti-thymocyte globulin.45
NK cells contribute to GVL and also provide antiviral immunity after transplant.46,47 Consistent with previous studies,23,27 we found a significant delay in NK-cell reconstitution, with immature CD56brightNKG2A+CD16−KIR−CD57− NK cells predominating the early posttransplant period in haplo-HCT patients. We also found a higher CD16−/CD16+ NK-cell ratio in patients who developed CMV reactivation after haplo-HCT, suggesting a link between predominance of immature NK cells and viral reactivation. Although absolute count and subset distribution of immune cells represent an imperfect surrogate marker for protection against infection, we observed a significantly higher risk of CMV reactivation after haplo-HCT where both T- and NK-cell reconstitution was delayed compared with MD-HCT. Interestingly, patients who experienced CMV reactivation showed a more mature NK-cell profile at mass cytometry analysis performed at 3 months, suggesting that CMV reactivation may promote NK-cell maturation.48-50 We also observed a higher CD16−/CD16+ NK-cell ratio in patients who subsequently developed cGVHD. The mechanism whereby delayed recovery of CD16+ NK cells may contribute to the development of cGVHD is not known, but this may be related to reduced NK-cell-mediated killing of antigen presenting cells and T cells, which has been reported to prevent GVHD in murine models.51
IL-15 is important for normal NK-cell homeostasis52 and has been used to enhance antitumor and antiviral immunity.53-57 We hypothesized that the NK-cell functional defects in our haplo-HCT patients were primarily due to the predominance of immature subsets and demonstrated that this impairment can be rescued by IL-15 priming. Although functional studies and mass cytometry studies were done with a small number of representative samples, these results suggest that haplo-HCT with PTCy represents a suitable setting to test the ability of IL-15 or IL-15 analogs to boost NK-cell function and improve clinical outcomes. Adoptive transfer of NK cells early after transplant is another potential strategy.58,59 Our group recently described cytokine-induced memory-like NK cells with enhanced antitumor activity and increased proliferation capacity.60,61 Adoptive transfer of cytokine-induced memory-like NK cells after haplo-HCT with PTCy may be another approach to overcome delayed NK-cell reconstitution without increasing GVHD.
It is also important to acknowledge key limitations in our comparison of haplo-HCT with MD-HCT. First, GVHD prophylaxis differed between the 2 transplant cohorts and might contribute to differences in immune recovery after HCT. In addition to PTCy, haplo-HCT patients received mycophenolate mofetil and TAC after transplant, while MD-HCT patients received MTX and TAC. However, the preferential recovery of EM and TEMRA T cells observed in our haplo-HCT cohort was also reported after MD-HCT treated with PTCy as a single agent for GVHD prophylaxis,62 suggesting that this effect could be driven specifically by PTCy. Second, stem cell sources differed, with haplo-HCT patients receiving primarily bone marrow compared with MD-HCT patients who received peripheral blood stem cells (PBSCs). PBSC grafts contain higher numbers of donor T cells, and this may contribute to faster T-cell recovery in this cohort. Previous studies have not suggested that NK-cell reconstitution is affected by graft source.14,23 However, a recent study reported a positive correlation between graft NK-cell dose and early NK-cell reconstitution, suggesting that graft composition may have contributed to the different patterns of NK-cell recovery observed in our study.63 Third, profound HLA mismatch in haplo-HCT patients may also affect recovery of thymic function and delay the generation of naive T cells. Thus, all of the differences we observed in our comparison may not be entirely attributed to the administration of high-dose cyclophosphamide in the early posttransplant period. We cannot exclude the possibility that additional variables, including the initiation of TAC (day −3 vs day +5), the start of granulocyte colony-stimulating factor (day +11 vs day +5), or the intensity and type of conditioning might have played a role in the different patterns of immune reconstitution we observed.
In conclusion, our comparison of haplo-HCT with conventional MD-HCT revealed several significant differences in T- and NK-cell reconstitution. These findings are consistent with an immune milieu promoting tolerance, leading to a lower rate of cGVHD. Interventions that selectively promote the generation, expansion, and persistence of functional NK cells to reduce viral reactivation and enhance GVL, without increasing the risk of GVHD, may further improve outcomes in patients undergoing haplo-HCT with PTCy.
The antibody panels used for flow cytometry and mass cytometry and relative staining protocols can be found in supplemental material available with this article. For additional information, please contact jerome_ritz@dfci.harvard.edu.
Acknowledgments
The authors are grateful to all patients and HDs who kindly volunteered to participate in this study. The authors thank the Pasquarello Hematologic Malignancies Tissue Bank and Doreen Hearsey for prospective collection and processing of serial blood samples. The authors thank Susan Lazo for excellent assistance with flow cytometry analysis and Eric R. Haas for excellent technical support for mass cytometry analysis.
This work was supported by the National Cancer Institute, National Institutes of Health (P01CA229092).
Authorship
Contribution: B.R. designed research studies, conducted experiments, acquired and analyzed data, and wrote the manuscript; H.T.K. analyzed data, performed statistical analysis, and wrote the manuscript; C.R., S.C.R., and Y.A. acquired and analyzed data; T.K. designed the mass cytometry panel; L.B. provided informatic support; M.G., J.K., C.C., S.N., V.T.H., E.P.A., J.H.A., C.J.W., and R.J.S. analyzed data and edited the manuscript; and J.R. and R.R. designed research studies, analyzed data, and wrote the manuscript.
Conflict-of-interest disclosure: J.K. reports research support from Amgen, Equillium, BMS, Miltenyi Biotec, Regeneron, and Clinigen and consulting income from Amgen, Equillium, and Moderna Therapeutics, and is a scientific advisory board member for Cugene and Therakos. S.N. reports ad hoc advisory boards for Novartis, Kite/Gilead and Nkarta. C.J.W. is a founder of Neon Therapeutics and a member of its scientific advisory board and receives research funding from Pharmacyclics. R.J.S. serves on the board of directors for Kiadis and Be The Match/National Marrow Donor Program; provided consulting for Gilead, Rheos Therapeutics, Cugene, Jazz, Mana Therapeutics, VOR Biopharma, and Novartis; and is on the data safety monitoring board for Juno/Celgene. J.R. reports research funding from Amgen, Equillium, and Kite Pharma and consulting income from Avrobio, Falcon Therapeutics, Infinity Pharmaceuticals, LifeVault Bio, Rheos Medicines, Talaris Therapeutics, and TScan Therapeutics. The remaining authors declare no competing financial interests.
The current affiliation for T.K. is Department of Medical Oncology and Hematology, Sapporo Medical University School of Medicine, Sapporo, Japan.
The current affiliation for E.P.A. is Duke Cancer Institute, Department of Medicine, Duke University, Durham, NC.
Correspondence: Jerome Ritz, Department of Medical Oncology, Dana-Farber Cancer Institute and Harvard Medical School, 450 Brookline Ave, Boston, MA 02215; e-mail: jerome_ritz@dfci.harvard.edu; and Rizwan Romee, Department of Medical Oncology, Dana-Farber Cancer Institute and Harvard Medical School, 450 Brookline Ave, Boston, MA 02215; e-mail: rizwan_romee@dfci.harvard.edu.

