

Key Points
Abnormal FDG PET/CT scan findings near day 100 posttransplant predict inferior clinical outcomes.
Comprehensive evaluation of bone marrow activity has added value in myeloma disease prognostication.

Abstract
Multiple myeloma (MM) is a heterogeneous disease that may be evaluated by a broad array of imaging and laboratory techniques to measure disease activity and predict prognosis. Fluorodeoxyglucose (FDG) positron emission tomography/computed tomography (PET/CT) scanning has been shown to be predictive of patient outcomes throughout the disease course. We sought to corroborate these findings by examining the prognostic impact of PET/CT scanning in the posttransplant setting. We retrospectively analyzed PET/CT scans in 229 MM patients receiving an autologous stem cell transplant (ASCT) near day 100, and correlated these findings with time to progression(TTP) and overall survival (OS) to assess the impact of day 100 PET/CT scan findings as an independent prognostic factor. The median OS for the entire cohort was 61.5 months (95% confidence interval [CI], 49-75) and the median TTP was 18.5 months (95% CI, 15.4-21.8). Among patients with abnormal day 100 PET findings (PET+), median TTP was 12.4 months vs 24 months among those with normal PET findings (PET−) (P < .0001). The median OS in the PET+ group was 46 months compared with 99 months in the PET− group (P < .0001). We conclude that an abnormal PET/CT scan near day 100 post-ASCT is predictive of shorter TTP and OS, with prognostic significance retained after adjusting for disease response and other prognostic variables in MM.
Introduction
Multiple myeloma (MM) is a biologically heterogeneous disease, as exemplified by its variable genomics, secretory behavior, spatial heterogeneity, and extramedullary involvement.1-4 Given the significant variation in disease phenotype, monitoring of MM during surveillance and assessment of response to therapy has demanded incorporation of diverse clinical parameters to optimize accuracy in capturing disease activity. Among these parameters are serum and urine biomarkers such as serum monoclonal protein (M protein) and free light-chain levels, bone marrow clonal plasma cell quantification, and skeletal imaging with magnetic resonance imaging (MRI) and computed tomography (CT) scans to identify bone marrow infiltration, osteolytic lesions, and soft tissue plasmacytomas.5-8 Use of these studies has improved sensitivity in assessment of disease activity, and led to their incorporation in the International Myeloma Working Group (IMWG) response criteria.5 Despite the broad array of tools at our disposal, there are limitations in accurately capturing systemic bone marrow disease activity, due to myeloma’s patchy marrow involvement.9 The same challenge is true with detection of extramedullary disease (EMD), which is a known inferior prognostic variable in clinical outcomes among MM patients.10 However, accurate assessment of both medullary and extramedullary disease in myeloma is essential for precise monitoring and prognostication and may be the only avenue in recognizing active disease, especially in nonsecretory states and among patients achieving a conventional complete response (CR).
The value of positron emission/computed tomography (PET/CT) in myeloma has been studied under varying clinical conditions and has shown promise in disease prognostication through the depiction of systemic bone marrow activity and detection of EMD where current, conventional disease parameters fall short.11 The detection of EMD along with its degree of metabolic activity in newly diagnosed MM (NDMM) patients has been shown to produce a negative impact on clinical outcomes.12 Alongside this observation, abnormal bone marrow activity detected with PET/CT scanning in the setting of CR as well as before and after hematopoietic stem cell transplantation has also correlated with inferior clinical outcomes, even after adjusting for known prognostic variables.13-16 Normalization of PET/CT imaging after induction therapy has also been shown to be prognostic for survival.17 These findings highlight the clinical applicability of PET/CT scan findings in myeloma and its potential role and value in refining disease prognostication. We sought to corroborate these findings among myeloma patients receiving a hematopoietic stem cell transplant and correlate PET/CT scan findings available at or near day 100 posttransplant with clinical outcomes. This is the largest study to date retrospectively examining the prognostic impact of posttransplant, day 100 PET/CT scan findings among transplant-eligible myeloma patients.
Patients and methods
This is a retrospective cohort study that included all MM patients who underwent an autologous stem cell transplant (ASCT) at Mayo Clinic between September 2003 and November 2016 and had a fluorodeoxyglucose PET/CT scan available with internal radiology interpretation within 200 days posttransplant. Approval for this study was obtained from the Mayo Clinic Institutional Review Board and informed consent was obtained from all patients for review of their medical records.
First, PET/CT scan findings and interpretation done as part of clinical evaluation were reviewed for the entire cohort and recorded. Because this study represents a real-world (ie, nonclinical trial) experience, there were no formal or strict guidelines regarding radiologic interpretation, read discrepancies, or interobserver variability. Scans without evidence of active or residual disease (PET−) were defined per IMWG guidelines as the disappearance of every area of increased tracer uptake found on a preceding PET/CT scan (where available), or uptake<mediastinal blood pool, or decrease<surrounding normal tissue.5 Conversely, PET/CT scans indicative of active or residual disease (PET+) were defined as any abnormal uptake or incompletely resolved uptake from the previous examination, where available.5 Additionally, the presence or absence of EMD from PET/CT scans was also recorded. We then determined the number of patients among the entire cohort who had an available PET/CT scan prior to transplant along with their findings.
A multivariate analysis was performed using the Cox proportional hazards model to assess for retention of prognostic relevance after adjusting for verified clinical prognostic variables in MM including depth of response achieved at day 100 (CR vs non-CR), International Staging System (ISS) score (1-3), and fluorescence in situ hybridization (FISH) and cytogenetic risk stratification (high vs standard risk). Baseline and day 100 demographic data including age, sex, ISS score, FISH/cytogenetics risk category, and CR rates were collected.
The end points for the study included median time to progression (TTP), measured from the date of ASCT to date of confirmed disease progression (PD) and overall survival (OS) measured from the date of ASCT to death from any cause, with censoring performed at the date of last contact. A Kaplan-Meier model was used to estimate median OS and TTP and for image generation. Statistical significance between all groups when comparing OS and TTP was performed using the 2-sided log-rank test. In assessing for a possible selection bias among the patients who received a posttransplant PET/CT scan, outcomes of interest were compared among patients with an available PET/CT scan to matched controls who did not have a PET/CT scan posttransplant. All statistical analyses and storage of data were performed using the JMP 14.1.0 statistical package (SAS Institute Inc, Cary, NC).
Results
We identified 229 myeloma patients who underwent ASCT at our institution and had a PET/CT scan within 200 days posttransplant available for analysis. The median follow-up for the entire cohort from date of transplant was 49 months (range, 43-58 months). Among all patients (n = 229), the median age at time of transplant was 60 years, 63% were male, median TTP was 18.5 months (95% CI, 15.4-21.8), and median OS was 61.5 months (95% CI, 49-75). The median time from date of transplant to PET/CT scan was 101 days (range, 51-189 days); 149 patients (65%) had findings consistent with active/residual myeloma (PET+) whereas the remaining 80 patients (35%) had no evidence of disease on their PET/CT scan (PET−), and 27 patients (11.7%) had detection of EMD. Among patients who were PET+ post-ASCT, the breakdown of the timing of the PET/CT scan from the date of ASCT is as follows: 5 (3.3%) between days 30 and 60, 69 (46%) between days 61 and 100, 75 (50%) between days 101 and 200. The pattern of uptake among the PET+ cohort is as follows: 82 (55%) had a diffuse uptake pattern on their scan, 51 (34%) and 16 (11%) had focal and mixed patterns, respectively. Baseline and day 100 patient characteristics among the entire cohort and between the 2 groups (PET+ vs PET−) are shown in Table 1. Briefly, there were no significant differences in distribution of variables among the 2 groups. The median line of application of ASCT among the entire cohort and among PET+ and PET− groups was 1 (range, 1-6). The most common induction regimen used among all patients was lenalidomide and dexamethasone (31%), followed by cyclophosphamide (Cytoxan), bortezomib, and dexamethasone (15.4%), and bortezomib and dexamethasone (14%). When considering all prior therapies received, 40% of all patients were exposed to an immunomodulator and proteosome inhibitor, among whom 25.5% were PET+ and 14.9% were PET− near day 100.
Patient characteristics at baseline (ISS stage and FISH studies) and near day 100 post-ASCT (serum M spike, sFLC ratio, CR status, maintenance therapy)
| Entire cohort, n = 229 | Day 100 PET+, n = 149 | Day 100 PET−, n = 80 | P | |
|---|---|---|---|---|
| Serum M spike at day 100, median (range), g/dL | 0.2 (0-2.7) | 0 (0-2.7) | 0.4 (0-2.6) | |
| sFLC ratio at day 100, median (range) | 1.4 (0-1444) | 1.36 (0-1445) | 1.66 (0.02-497) | |
| ISS stage III* | 43/156 (28) | 28/156 (18) | 15/156 (9.6) | .81 |
| High-risk FISH* | 42/170 (24.7) | 29/170 (17) | 13/170 (7.6) | .5 |
| CR at day 100* | 51/221 (23) | 30/221 (13.6) | 21/221 (9.5) | .37 |
| Maintenance therapy* | 62/220 (28) | 37/220 (17) | 25/220 (11) | .39 |
FISH, fluorescence in situ hybridization; ISS, International Staging System; sFLC, serum free light chain.
Reported as number of patients among the entire cohort with available prognostic data per variable (percentage).
The median TTP among patients with posttransplant PET+ scans was 12.4 months compared with 24 months among patients who were considered PET− (P < .0001; Figure 1A). When evaluating differences in OS among patients, the PET+ group had a shortened median OS of 47.2 months compared with 100 months in the PET− group (P < .0001; Figure 1B). A multivariate analysis demonstrated retained statistical significance for the impact of the PET/CT scan on TTP and OS after adjusting for ISS stage, FISH and cytogenetics risk stratification, and depth of response achieved (Table 2). Upon assessment for the prognostic impact of marrow involvement pattern among post-ASCT PET+ patients, the mixed pattern had a statistically significant inferior outcome when compared with focal pattern with TTP (hazard ratio [HR], 2.0 [1.1-3.6; P = .02]) and OS (HR, 2.0 [1.1-3.9; P = .03]). A focused analysis including only patients with documented CR near day 100 (n = 51) again demonstrated differences in TTP (24.6 vs 50.8 months; P = .02) and OS (62.2 months vs not reached; P = .02) among PET+ vs PET− groups, respectively (Figure 2).
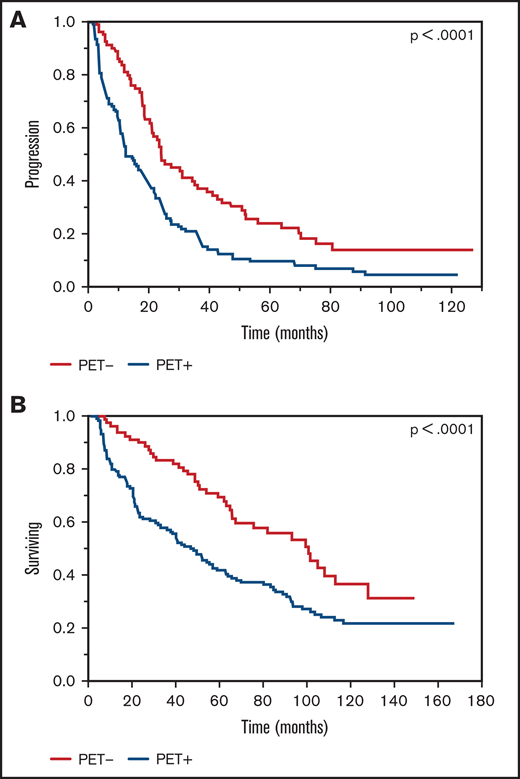
Kaplan-Meier plot TTP and OS comparisons based on PET/CT scan findings near day 100, post-ASCT (PET+ vs PET−). (A) TTP. PET+: median TTP, 12.4 months; PET−: median TTP, 24 months. (B) OS. PET+: median OS, 47.2 months; PET−: median OS, 100 months.
Kaplan-Meier plot TTP and OS comparisons based on PET/CT scan findings near day 100, post-ASCT (PET+ vs PET−). (A) TTP. PET+: median TTP, 12.4 months; PET−: median TTP, 24 months. (B) OS. PET+: median OS, 47.2 months; PET−: median OS, 100 months.
Multivariable analysis using cox proportional hazards model, adjusting for ISS and FISH risk and depth of response achieved posttransplant
| Variable | TTP | OS | ||
|---|---|---|---|---|
| Hazard ratio | P | Hazard ratio | P | |
| Day 100 PET+ | 1.84 (1.2-2.8) | 0.006 | 1.9 (1.1-3.2) | 0.016 |
| ISS stage 3 | 1.77 (1.2-2.7) | 0.009 | 1.24 (0.76-2.0) | 0.38 |
| High risk FISH | 1.34 (0.81-2.24) | 0.25 | 1.74 (1.0-3.0) | 0.049 |
| Depth of response (CR) | 2.24 (1.2-4.1) | 0.009 | 1.31 (0.69-2.5) | 0.41 |
ISS, International Staging System; FISH, fluorescence in situ hybridization; CR, complete response.
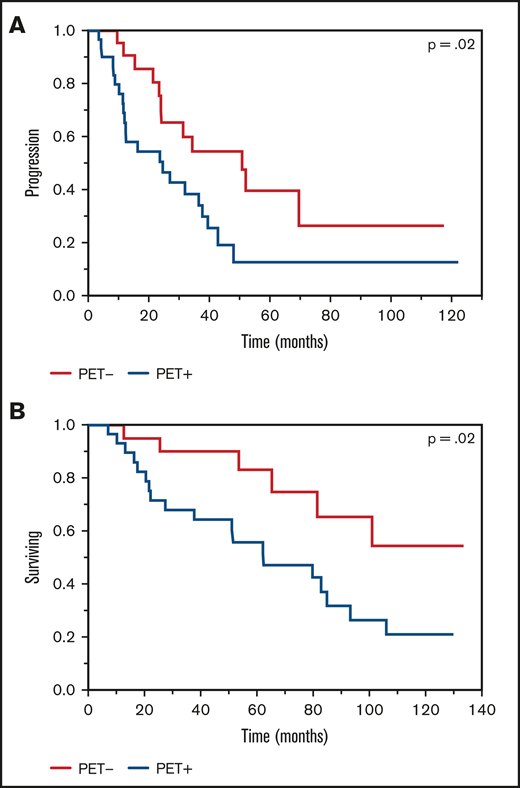
Kaplan-Meier plot TTP and OS comparisons based on PET/CT scan findings near day 100, post-ASCT (PET+ vs PET−) among patients achieving a CR. (A) TTP. PET+: median TTP, 24.5 months; PET−: median TTP, 50 months. (B) OS. PET+: median OS, 62.2 months; PET−: median OS, not reached.
Kaplan-Meier plot TTP and OS comparisons based on PET/CT scan findings near day 100, post-ASCT (PET+ vs PET−) among patients achieving a CR. (A) TTP. PET+: median TTP, 24.5 months; PET−: median TTP, 50 months. (B) OS. PET+: median OS, 62.2 months; PET−: median OS, not reached.
Among the entire cohort (n = 229), there were 189 patients (84%) with a PET/CT scan available within 12 months prior to the posttransplant scan, among whom 158 (85%) were PET+ and 27 (15%) were PET− with a median time between scans of 4 months (range, 1.4-12.1 months). Among the pretransplant PET+ patients (n = 158), 16 (10%) had evidence of EMD. A focused analysis comparing pretransplant and posttransplant PET/CT examination findings on outcomes of interest demonstrated that patients in whom both PET/CT scans were negative (PET−/PET−) had the longest TTP of 42.6 months followed by the following in descending order: pre-ASCT PET+ to post-ASCT PET−, TTP 21.1 months; pre-ASCT PET+ to post-ASCT PET+, TTP 12.3 months; and pre-ASCT PET− to post-ASCT PET+, TTP 4.5 months (P < .0001; Figure 3A). A similar pattern was observed upon comparison of median OS data with the following results: pre-ASCT PET− to post-ASCT PET− OS, 107.6 months; pre-ASCT PET+ to post-ASCT PET− OS, 66.8 months; pre-ASCT PET+ to post-ASCT PET+ OS, 40.3 months; and pre-ASCT PET− to post-ASCT PET+ OS, 13.1 months (P = .0006; Figure 3B). A paired comparison among the groups through univariate analyses demonstrated several groups with statistically significant impact on clinical outcomes, most prominent among PET−/PET+ vs PET−/PET− groups (Table 3).
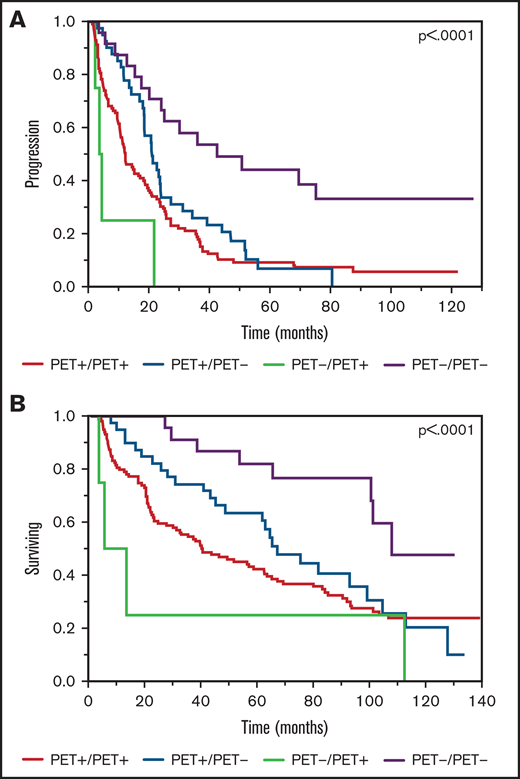
Kaplan-Meier plot TTP and OS comparisons based on PET/CT scan findings prior to transplant and near day 100, post-ASCT (PET+ vs PET−). (A) TTP. PET−/PET−: median TTP, 42.6 months; PET+/PET−: median TTP, 21.1 months; PET+/PET+: median TTP, 12.3 months; PET−/PET+: median TTP, 4.5 months. (B) OS. PET−/PET−: median OS, 107.6 months; PET+/PET−: median OS, 66.8 months; PET+/PET+: median OS, 40.3 months; PET−/PET+: median OS, 13.1 months.
Kaplan-Meier plot TTP and OS comparisons based on PET/CT scan findings prior to transplant and near day 100, post-ASCT (PET+ vs PET−). (A) TTP. PET−/PET−: median TTP, 42.6 months; PET+/PET−: median TTP, 21.1 months; PET+/PET+: median TTP, 12.3 months; PET−/PET+: median TTP, 4.5 months. (B) OS. PET−/PET−: median OS, 107.6 months; PET+/PET−: median OS, 66.8 months; PET+/PET+: median OS, 40.3 months; PET−/PET+: median OS, 13.1 months.
Paired analysis of pre and posttransplant PET scan findings among different groups
| Pre and post ASCT PET groups | TTP | OS | ||
|---|---|---|---|---|
| Hazard ratio | P | Hazard ratio | P | |
| PET-/PET- vs. PET+/PET- | 0.44 (0.23-0.80) | 0.008 | 0.39 (0.17-0.85) | 0.019 |
| PET-/PET- vs. PET+/PET+ | 0.34 (0.2-0.59) | <.0001 | 0.32 (0.15-0.66) | 0.002 |
| PET-/PET- vs. PET-/PET+ | 0.13 (0.04-0.40) | 0.0004 | 0.14 (0.04-0.48) | 0.0015 |
| PET+/PET- vs. PET-/PET- | 2.3 (1.2-4.2) | 0.008 | 2.6 (1.17-5.72) | 0.019 |
| PET+/PET- vs. PET+/PET+ | 0.78 (0.53-1.13) | 0.2 | 0.82 (0.53-1.28) | 0.39 |
| PET+/PET- vs. PET-/PET+ | 0.30 (0.10-0.84) | 0.023 | 0.37 (0.13-1.07) | 0.065 |
| PET+/PET+ vs. PET-/PET- | 2.9 (1.7-5.1) | <.0001 | 3.14 (1.52-6.50) | 0.002 |
| PET+/PET+ vs. PET+/PET- | 1.3 (0.88-1.9) | 0.2 | 1.21 (0.78-1.89) | 0.39 |
| PET+/PET+ vs. PET-/PET+ | 0.38 (0.14-1.0) | 0.061 | 0.45 (0.16-1.23) | 0.12 |
| PET-/PET+ vs. PET-/PET- | 7.7 (2.5-23.5) | 0.0004 | 7.0 (2.10-23.3) | 0.0015 |
| PET-/PET+ vs. PET+/PET- | 3.4 (1.2-9.5) | 0.02 | 2.7 (0.94-7.79) | 0.065 |
| PET-/PET+ vs. PET+/PET+ | 2.6 (0.95-7.1) | 0.06 | 2.22 (0.81-6.09) | 0.12 |
Results reported as hazard ratios using a univariate analysis and cox proportional hazards model.
Assessment for the impact of EMD near day 100 posttransplant (n = 27) on clinical outcomes revealed a significantly shorter median TTP of 3.5 months among patients with detectable EMD vs 20.7 months in patients for whom EMD was absent (P < .0001). A consistent pattern was observed upon analysis of OS, with the presence of EMD resulting in a median OS of 12.8 months compared with 68.9 months in patients without EMD (P < .0001). Among patients with an available pretransplant PET/CT scan, 16 (8%) had EMD; of those, 6 patients had disappearance of EMD on the posttransplant scan whereas the remainder (n = 10) had persistence of EMD. The prognostic significance showed statistically significant inferior outcomes on TTP with an HR of 5.7 (1.2-27; P = .02).
Finally, we compared median TTP and OS between patients who had a PET/CT scan available near day 100 post-ASCT (11% of patients) vs matched controls who underwent transplant and did not have a post-ASCT PET/CT scan performed (n = 1764). Among those with an available post-ASCT PET/CT scan, there was a slightly shorter median TTP of 18.5 months compared with 26.5 months (P < .0001) in the group that did not have a PET/CT scan with a similar finding carried into OS data of 62.2 months vs 76.3 months (P = .001), respectively.
Discussion
The complexity of MM lies in its diverse biological repertoire, translating into heterogeneous clinical phenotypes with variability in disease presentation, monitoring, and treatment.1,3,18 As our knowledge of myeloma’s clinical characteristics advances, our dependence on additional disease monitoring parameters and prognostic variables increases in an effort to optimize clinical outcomes in a disease that remains incurable. Although this challenge has been received with tremendous advancement in enhanced availability of multimodal studies including biomarkers, bone marrow assessment, skeletal imaging, and molecular profiling, there remains a void in our ability to capture systemic bone marrow activity, the applicability of which has shown promise in disease prognostication.11 This finding is not entirely surprising as MM is known to exhibit an irregular and patchy presence in the bone marrow, which is not always reflected in the very limited scope provided with a biopsy.9 Hence, expansion of currently available assessment tools to include evaluation for systemic marrow activity, especially in the posttherapeutic setting where conventional disease parameters may be falsely quiescent, holds value in heightening the sensitivity of detecting active disease.
Our study, aimed at assessing the prognostic impact of PET/CT scan findings in the posttransplant setting, supports the added value and relevance in evaluating systemic bone marrow activity. Herein, we demonstrate that among myeloma patients who have abnormal PET/CT scan findings near day 100 post-ASCT, time to progression is reduced by nearly one-half (12.4 vs 24 months) compared with patients with normal PET/CT scans. The impact on survival was observed to the same degree, with PET+ patients experiencing significantly shorter median survival (47 months) compared with their PET− counterparts (100 months). The prognostic relevance of both findings persisted after adjusting for prevalidated prognostic variables in myeloma, emphasizing the added value of posttransplant PET/CT scan findings on clinical outcomes. Furthermore, as the large majority of PET+ patients had their PET/CT scans well after day 60, these abnormal findings are more likely representative of true residual disease as opposed to transient uptake that may have disappeared on subsequent scans. The significance in this aspect is in part due to the much more comprehensive examination of bone marrow activity provided with PET/CT imaging, which is not always reflected with marrow sampling. The discrepancy in findings among a biopsy and PET/CT scan is explained by myeloma’s inconsistent presence within the bone marrow, occasionally resulting in falsely normal and reassuring biopsy findings.9 Although one could argue that the additional response criteria variables including M-protein and free-light-chain levels shield us from this lapse in marrow sensitivity, our results alongside those previously reported show otherwise in demonstrating dichotomous TTP and OS durations among patients in CR with differing PET/CT scan findings.15 The limitation in peripheral disease-monitoring parameters is inherent in myeloma’s varying secretory behavior, which could be impacted to a greater degree in the immediate posttransplant setting than metabolic activity among residual bone marrow plasma cells. With the continuing rise in CR rates in myeloma as a consequence of novel drug regimens and in the posttransplant setting, the benefit from bone marrow activity assessment to assist in prognostication is ever more apparent as we await validation and availability of a liquid biopsy.
Like PET/CT scanning, MRI with diffusion weighted imaging (DWI) provides noninvasive assessment of systemic bone marrow involvement in MM, with several studies showing greater sensitivity compared with PET/CT scanning, especially for evaluating the diffuse pattern of bone marrow involvement.19,20 MRI has also been shown to be equivalent to PET/CT scanning in detecting extramedullary disease.21 Early studies comparing PET/CT scanning and conventional MRI for evaluating treatment response failed to show prognostic significance of MRI normalization, in contrast to PET/CT scan normalization, which was associated with improved progression-free survival.17 However, with incorporation of functional techniques such as DWI, MRI has taken on a progressively important role in evaluating treatment response. Several studies have demonstrated high accuracy of increased apparent diffusion coefficient values to indicate positive treatment response and strong correlation of posttherapy MRI with DWI and fluorodeoxyglucose PET/CT scanning.22,23 However, apparent diffusion coefficient values may be influenced by the choice of b-values and method of fat suppression, patient-related factors such as susceptibility artifact and motion, and hardware-specific factors such magnet strength, coil selection, and gradients.24,25 Therefore, there is an ongoing effort to standardize acquisition, reporting, and interpretation of whole-body MRI with DWI, which should help to further delineate the role of MRI in evaluating treatment response and prognostication, including in the posttransplant setting.26
There are some unique aspects within our results that warrant attention. Our study identified a higher proportion of patients who had an abnormal PET/CT scan (65%) and EMD (11.8%) near day 100 compared with those previously reported in the literature. Because standardized uptake values were not routinely available in the radiologic reports, we were unable to apply the recently validated Deauville complete metabolic response criteria by Zamagni et al,13 and instead used those criteria previously provided by the IMWG guidelines that use a more inclusive approach to defining PET disease positivity. In comparing baseline and posttransplant PET/CT activity, there was a significant difference in survival among patients with an abnormal baseline and posttransplant PET/CT scan vs those with a normal baseline PET scan who became PET+ near day 100, the latter group having a much shorter OS as reflected in Figure 3B. This transition from PET− to PET+ indicates development of new disease activity in spite of aggressive therapy exposure, and likely represents the formation of a new clonal population signifying a high-risk subgroup of patients worth identifying. Two of these patients were considered as having PD (1 secretory, 1 biopsy-proven plasmacytoma) with the recommendation of salvage chemotherapy whereas the remaining patient was not considered to have PD and entered observation. Further comparison among these groups shows a nearly overlapping trend in TTP after ∼22 months of follow-up among patients with baseline PET/CT positivity and confounding posttransplant scans (Figure 3A), emphasizing the relevance of baseline marrow activity in predicting progression, independent of eventual PET normalization. Further support for this notion lies in the previously demonstrated superior prognostic impact of PET normalization at baseline and pretransplant among myeloma patients.12,14
There are several limitations to our study. First, the retrospective nature of this study lends itself to inherent biases. As previously stated, we do not comment regarding specifics of standardized uptake values and Deauville score, as these were not consistently available in the scan reports and, as a consequence, we are unable to apply our findings with the recently defined PET complete metabolic response criteria (Deauville score <4) provided by Zamagni et al. This recent addition to the IMWG PET response criteria has allowed for the standardized interpretation and clinical applicability of PET/CT scans in the posttherapeutic setting.13 We are unable to provide data on minimal residual disease status post-ASCT as this was not yet routinely implemented in clinical practice among the patient cohort in this study. The patients included in this study cover a considerable time range (2003-2016), introducing further heterogeneity in our population given differences in the myeloma treatment paradigm throughout this duration. Finally, we acknowledge the possibility of selection bias in preferentially selecting patients with features of higher-risk disease to receive a PET scan in the posttransplant setting. In an attempt to account for these biases, our multivariate analysis continued to demonstrate independent prognostic relevance of PET/CT scan findings despite adjusting for common prognostic variables.
The role of PET/CT scanning in myeloma carries independent prognostic significance in varying states of disease including baseline, at CR, and in the peritransplant setting.12,14-16,27 Our study confirms these findings by highlighting the independent, negative prognostic impact of abnormal PET/CT scans near day 100 posttransplant with inferior TTP and OS. Taken together, these results demonstrate a role for incorporating a PET/CT scan in the posttransplant setting, especially among patients achieving a CR as an independent prognostic variable in myeloma disease stratification, and support its inclusion in the minimal residual disease definition in the IMWG response criteria.
Acknowledgment
The authors acknowledge the Mayo Clinic Hematological MalignanciesProgram.
Authorship
Contribution: S.K. and M.K. designed the study, collected and analyzed the data, and wrote the manuscript; and S.V.R., A.D., M.Q.L., M.A.G., F.K.B., D.D., L.H., A.F., M.H., S.H., J.L., N.L., P.K., R.S.G., Y.L., W.G., T.K., R.W., S.M.B., and R.A.K. were involved in patient management, revised the manuscript, and approved the final version of the manuscript.
Conflict-of-interest disclosure: The authors declare no competing financial interests.
Correspondence: Shaji Kumar, Division of Hematology, Mayo Clinic, 200 First St SW, Rochester, MN 55906; e-mail: kumar.shaji@mayo.edu.

