

Key Points
Dexamethasone-mediated inhibition of the mammalian target of rapamycin complex 1–P70S6K axis underlies synergy with MCL-1 inhibitor S63845.
P70S6K1 inhibitor PF-4708671 can replace dexamethasone in the synergistic combination with S63845 to induce apoptosis of primary MM cells.

Abstract
Novel combination therapies have markedly improved the lifespan of patients with multiple myeloma (MM), but drug resistance and disease relapse remain major clinical problems. Dexamethasone and other glucocorticoids are a cornerstone of conventional and new combination therapies for MM, although their use is accompanied by serious side effects. We aimed to uncover drug combinations that act in synergy and, as such, allow reduced dosing while remaining effective. Dexamethasone and the myeloid cell leukemia 1 (MCL-1) inhibitor S63845 (MCL-1i) proved the most potent combination in our lethality screen and induced apoptosis of human myeloma cell lines (HMCLs) that was 50% higher compared with an additive drug effect. Kinome analysis of dexamethasone-treated HMCLs revealed a reduction in serine/threonine peptide phosphorylation, which was predicted to result from reduced Akt activity. Biochemical techniques showed no dexamethasone-induced effects on FOXO protein or GSK3 but did show a 50% reduction in P70S6K phosphorylation, downstream of the Akt-mTORC1 axis. Replacing dexamethasone by the P70S6K1 isoform-specific inhibitor PF-4708671 (S6K1i) revealed similar and statistically significant synergistic apoptosis of HMCLs in combination with MCL-1i. Interestingly, apoptosis induced by the P70S6K1i and MCL-1i combination was more-than-additive in all 9 primary MM samples tested; this effect was observed for 6 of 9 samples with the dexamethasone and MCL-1i combination. Toxicity on stem and progenitor cell subsets remained minimal. Combined, our results show a strong rationale for combination treatments using the P70S6K inhibitor in MM. Direct and specific inhibition of P70S6K may also provide a solution for patients ineligible or insensitive to dexamethasone or other glucocorticoids.
Introduction
Despite the development of increasingly effective therapies in the last decades, multiple myeloma (MM) is still considered to be incurable, characterized by acquired drug resistance and relapse of disease.1 One mechanism by which MM cells circumvent cell death is resistance against the intrinsic apoptosis pathway, in which the B-cell lymphoma 2 (BCL-2) family of pro-survival proteins, including BCL-2, myeloid cell leukemia 1 (MCL-1), and B-cell lymphoma–extra large (BCL-XL), play an important role.2 By binding and sequestering pro-apoptotic BH3-only proteins (eg, BIM) or apoptotic effectors BAX/BAK, the BCL-2 proteins regulate the balance between apoptosis and cell survival.3 Overexpression of pro-survival proteins, in particular MCL-1, is common in MM and associated with disease relapse and impaired patient survival.4 This resulted in development of BCL-2 homology domain 3 (BH3) mimetics that inhibit BCL-2 family proteins and thereby overcome intrinsic apoptosis resistance.5 Multiple BH3 mimetics, including the specific MCL-1 inhibitor S63845, are currently being tested in clinical trials for MM.6 Even though MCL-1 inhibitors exhibit potent single-agent activity, recent in vitro studies reported that combinations with dexamethasone resulted in synergistic apoptosis of MM cells.7,8
Dexamethasone is a synthetic glucocorticoid (GC) that forms an integral component of conventional and new combination therapies for both newly diagnosed and relapsed-refractory MM patients.5,9 Binding of GCs to the glucocorticoid receptor (GR) alters the cell’s transcriptional program either directly by binding to GC-responsive elements in the DNA, or indirectly by interacting with other transcription factors such as NF-κB.10 Synthetic GCs are widely recognized for their significant anti-inflammatory, immune-suppressive, and cytotoxic effects.11 Although the precise molecular mechanisms remain unclear, treatment of MM cells with single-agent dexamethasone results in intrinsic apoptosis activation.12 Its effectiveness, however, is accompanied by serious side effects, including muscle weakness, increased infection rate, cardiovascular problems, hyperglycemia, mental health problems, osteoporosis, respiratory problems, and fatigue.13 This makes administration of dexamethasone challenging; dose reduction is required in many patients, especially the elderly and more fragile patients, thereby limiting its potential.14 As an alternative, dexamethasone might be replaced by the synthetic GC prednisone, which is often better tolerated.15,16
The phosphoinositide 3-kinase (PI3K)-protein kinase B (PKB/Akt) pathway is the most frequently activated signal transduction pathway in human cancers, and it also plays a crucial role in MM.17,18 Akt is the central signaling node in this pathway and mainly acts through regulation of 3 key downstream mediators: forkhead box O protein (FOXO), glycogen synthase kinase 3 (GSK3), and mammalian target of rapamycin complex 1 (mTORC1).19 By doing so, it regulates multiple cellular processes, including cell growth, survival, and apoptosis.20 The family of FOXO transcription factors controls a diverse set of target genes, including (pro-)apoptotic mediators such as BIM.21 The kinase GSK3 phosphorylates a plethora of proliferation mediators and pro-survival substrates, including MCL-1, thereby marking them for inactivation and/or proteasomal degradation.22 Upon phosphorylation, Akt can inhibit FOXO and GSK3 activity but also activates mTORC1, resulting in activation of the 2 mTORC1 targets eukaryotic translation initiation factor 4E-binding protein 1 (4E-BP1) and ribosomal protein p 70 S6 kinase (P70S6K).23 Although primarily known for its role in metabolism and cell growth, the mTORC1–P70S6K axis has a pleiotropic function in regulation of cell survival and apoptosis.24
The continued efforts to improve MM treatment has resulted in the development of many new agents, including the BH3 mimetics.25 However, there is an unmet need for a strategy to rationally combine these new agents with current standard-of-care therapies to reach synergistic effects that allow for reduced dosing and toxicity. In the current study, we performed a small-scale lethality screen to test for synergistic effects between novel and conventional MM drugs. We report the highest synergy for the combination of dexamethasone and MCL-1 inhibitor S63845 (MCL-1i) and reveal the molecular mechanism underlying this synergistic combination. These results provide a strong rationale to replace dexamethasone by the P70S6K1 isoform inhibitor PF-4708671 (S6K1i) to induce synergistic apoptosis of MM, with the advantage of reducing the vast amount of side effects experienced with GCs.
Methods
Cell culture and chemicals
The human multiple myeloma cell lines (HMCLs) MM1.s, OPM-2, and L363 were cultured in RPMI 1640 GlutaMAX HEPES (Life Technologies), supplemented with 10% fetal bovine serum (FBS; Biowest) and 100 µg/mL penicillin-streptomycin (Life Technologies). MS-5 feeder cells (DSMZ) were cultured in MEM-α (Life Technologies), supplemented with 10% FBS, 2 mM l-glutamine (Life Technologies), and 100 µg/mL penicillin-streptomycin. All cells were maintained at 37°C and 5% carbon dioxide. An overview of all drugs incorporated in this study, including titrations, is provided in supplemental Table 1 and supplemental Figure 1, respectively.
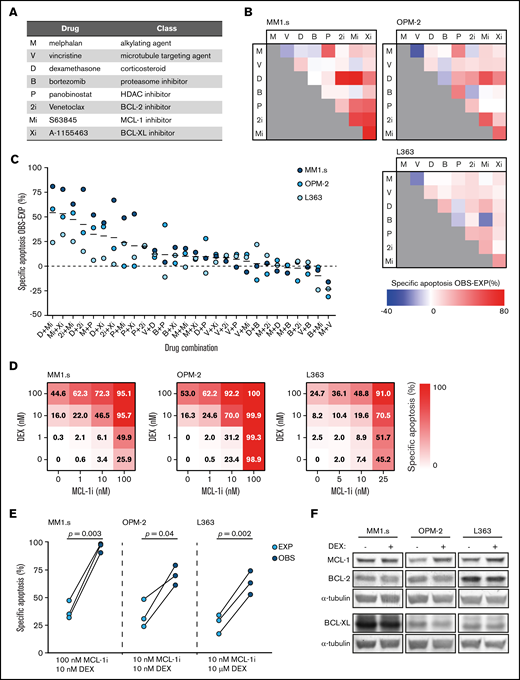
Dexamethasone synergizes with MCL-1 inhibition to induce apoptosis of HMCLs. (A) Overview of the drugs that were implemented in the in vitro lethality screen, including their abbreviations and representing drug class. (B) Matrices showing the combined effect of 2 drugs in inducing specific apoptosis of the HMCLs MM1.s, OPM-2, and L363. Observed (OBS) specific apoptosis is compared with expected (EXP) specific apoptosis and represented by a color scale in which blue indicates an antagonistic effect, white an exact additive response, and red a synergistic effect. Drug abbreviations as represented in panel A. Drug concentrations are described in supplemental Table 1. Viability is analyzed after 48 hours of drug exposure. (C) Data as shown in panel B, ranked by the average effect of the drug combinations on OBS-EXP specific apoptosis of the 3 HMCLs. Mean values are indicated by solid black lines. The dashed line indicates an exact additive effect. (D) Heatmaps showing specific apoptosis of indicated HMCLs induced by serial dilution of dexamethasone (DEX) and MCL-1i, individual or combined. Viability was analyzed after 48 hours of drug exposure; values represent the mean of 3 individual experiments. (E) Plots comparing EXP vs OBS specific apoptosis induced by DEX and MCL-1i combinations. Per HMCL, the drug combination that resulted in the highest average OBS-EXP ratio was selected from the data obtained in panel D. The 3 connected data points show the data obtained from 3 individual experiments. Statistical analysis was performed by using paired Student t tests. (F) Representative western blot showing MCL-1, BCL-2, and BCL-XL protein expression of indicated HMCLs after 24 hours of exposure to DEX 1 μM or negative control. α-tubulin was used as a loading control. HDAC, histone deacetylase.
Dexamethasone synergizes with MCL-1 inhibition to induce apoptosis of HMCLs. (A) Overview of the drugs that were implemented in the in vitro lethality screen, including their abbreviations and representing drug class. (B) Matrices showing the combined effect of 2 drugs in inducing specific apoptosis of the HMCLs MM1.s, OPM-2, and L363. Observed (OBS) specific apoptosis is compared with expected (EXP) specific apoptosis and represented by a color scale in which blue indicates an antagonistic effect, white an exact additive response, and red a synergistic effect. Drug abbreviations as represented in panel A. Drug concentrations are described in supplemental Table 1. Viability is analyzed after 48 hours of drug exposure. (C) Data as shown in panel B, ranked by the average effect of the drug combinations on OBS-EXP specific apoptosis of the 3 HMCLs. Mean values are indicated by solid black lines. The dashed line indicates an exact additive effect. (D) Heatmaps showing specific apoptosis of indicated HMCLs induced by serial dilution of dexamethasone (DEX) and MCL-1i, individual or combined. Viability was analyzed after 48 hours of drug exposure; values represent the mean of 3 individual experiments. (E) Plots comparing EXP vs OBS specific apoptosis induced by DEX and MCL-1i combinations. Per HMCL, the drug combination that resulted in the highest average OBS-EXP ratio was selected from the data obtained in panel D. The 3 connected data points show the data obtained from 3 individual experiments. Statistical analysis was performed by using paired Student t tests. (F) Representative western blot showing MCL-1, BCL-2, and BCL-XL protein expression of indicated HMCLs after 24 hours of exposure to DEX 1 μM or negative control. α-tubulin was used as a loading control. HDAC, histone deacetylase.
MM patient samples
Frozen vials with mononuclear cells (MNC) isolated from bone marrow aspirates of newly diagnosed MM patients were requested from the Parelsnoer Institute biobank. All samples were obtained after written informed consent and protocols were approved by the local ethics committee of the Utrecht University Medical Center and contributing partners of the Dutch Parelsnoer Project. The study was conducted in accordance with the Declaration of Helsinki. An overview of clinical characteristics and cytogenetics is provided in supplemental Table 2. Primary MM cells were cultured on near-confluent monolayers of MS-5 feeder cells as previously described.26 For flow cytometric analysis, primary MM cells were discriminated by positive surface staining using CD38-PerCP.CY5.5 monoclonal antibody (BioLegend).
Healthy donor primary cells
CD34+ stem and progenitor cells were isolated from umbilical cord blood as previously described.27 In short, MNC were isolated by using Ficoll-Paque, and CD34+ cells were isolated by using magnetic bead separation (Miltenyi Biotec), resulting in a 80% to 95% pure population. CD34+ cells were cultured in X-VIVO 15 (Lonza), supplemented with 50 ng/mL Flt3 ligand, 50 ng/mL stem cell factor, 20 ng/mL interleukin-3, and 20 ng/mL interleukin-6 (all Miltenyi). For flow cytometric analysis, CD34+ cells were discriminated by monoclonal antibody CD34–fluorescein isothiocyanate (FITC; BD Biosciences).
Endothelial progenitor cells (EPCs) were isolated from cord blood MNC as previously described and cultured in EGM-2 medium (Lonza), supplemented with 10% FBS, SingleQuot Kit (Lonza), and 100 µg/mL penicillin-streptomycin on surfaces coated with collagen I (BD Biosciences).28 Multipotent mesenchymal stem cells (MSC) were isolated from MNC of healthy donor bone marrow aspirates as previously described and cultured in MEM-α, supplemented with 10% FBS, 0.2 mM l-ascorbic acid 2-phosphate (Sigma Aldrich), and 100 µg/mL penicillin-streptomycin. All samples were obtained after informed consent, and protocols were approved by the local ethics committee of the Utrecht University Medical Center.
Preclinical three-dimensional MM model
MSC, EPC, and OPM-2 cells were combined in a three-dimensional coculture using growth factor–reduced Matrigel 50% (Corning) in a 4:1:1 cellular ratio, respectively, containing equal ratios of culture medium as previously described by Braham et al.28 To discriminate the 3 cell populations, OPM-2 cells were labeled with CellTrace-violet (Invitrogen) and EPCs with Vybrant DiO (Thermo Fisher Scientific).
Apoptosis assays
Cell viability of HMCLs, primary MM cells, CD34+ cells, MSC, and EPCs was determined after 48 hours of drug exposure by staining with 15 nM DiOC6 (Thermo Fisher Scientific) and/or 20 nM TO-PRO-3 (Thermo Fisher Scientific) unless stated otherwise and measured by flow cytometry (FACS Canto II, BD Biosciences) using FACSDiva software (BD Biosciences). Data were analyzed by using FlowJo software (BD). Specific apoptosis was calculated by relating the reduced percentage of viable cells (DiOC6+/TO-PRO-3–) upon drug exposure to the percentage of viable control cells, as follows: ([% cell death in treated cells – % cell death in control]/% viable cells control) × 100%. The drug combination effects were determined by comparing observed specific apoptosis vs hypothetical expected specific apoptosis that assumes an additive effect of the 2 combined drugs. This was calculated as previously published by Nijhof et al29: ([apoptosis drug A + apoptosis drug B] – (apoptosis drug A × apoptosis drug B)]. Synergy was assessed by using isobolograms. All drug combinations that caused 50% specific apoptosis or 25% specific apoptosis were included to create isobolograms. Combination indexes were calculated by using the Chou-Talalay method.30
Kinome analysis
For kinomic profiling, HMCLs were lysed in M-PER mammalian protein extraction reagent (Thermo Fisher Scientific) containing Halt protease and Halt phosphatase inhibitor cocktails (Thermo Fisher Scientific). Analysis of serine/threonine kinase (STK) activity was performed by using the high-throughput peptide microarray system of the PamStation 12 platform (PamGene), according to the manufacturer’s instructions. Initial sample and array processing and image captures were performed by using Evolve software (PamGene). Raw data processing, quantification, and statistical analysis of peptide phosphorylation were performed by using BioNavigator software (PamGene). Prediction of upstream kinases was performed on peptides with dexamethasone-induced, statistically significant altered phosphorylation by using the Kinexus Kinase Predictor (www.phosphonet.ca) and identified by scoring kinase prevalence in the top 10 list per peptide.
SDS-PAGE electrophoresis, immunoblotting, and antibodies
Total cell lysates were prepared in lysis buffer containing 1% NP-40. Cytosolic and nuclear fractions were separated by subsequent exposure to lysis buffer containing 0.1% NP-40 (cytosolic fraction), 1% NP-40, and RIPA lysis buffer in combination with mechanical disruption (nuclear fraction). Proteins were separated by using Mini-PROTEAN TGX (Bio-Rad) sodium dodecyl sulfate–polyacrylamide gel electrophoresis (SDS-PAGE) and transferred to low-fluorescence polyvinylidene difluoride membranes (Bio-Rad). An overview of all primary antibodies incorporated in this study is provided in supplemental Table 3. Detection was performed by using secondary antibodies goat anti-mouse 680RD and goat anti-rabbit 800CW (LI-COR Biosciences) and infra-red imaging (Odyssey Sa, LI-COR Biosciences). Image capture was performed by using Image Studio software (LI-COR). Image processing and quantification were performed by using ImageJ2 (Fiji) software.
ImageStream flow cytometry
HMCLs were fixed by 4% paraformaldehyde, permeabilized by using 100% ice-cold methanol, and incubated with rabbit anti-FOXO1, rabbit anti-FOXO3a, or an equal antibody concentration of rabbit immunoglobulin G isotype control (R&D Systems). Subsequently, cells were incubated with FITC-conjugated goat anti-rabbit (Jackson ImmunoResearch Laboratories) in 1% bovine serum albumin. For nuclear staining, DR (1 μM; BioLegend) was added directly before sample analysis. Flow cytometry was performed on an ImageStreamX MKII (Amnis, Luminex). Bright-field and immunofluorescent images were captured at 60× magnification by using Inspire software (Amnis, Luminex). Per sample 20,000 cells were analyzed and selected for round, single cells in focus. The Similarity feature of Ideas analysis software (Amnis, Luminex) was used to determine nuclear localization of FOXO.
Intracellular staining flow cytometry
HMCL fixation, permeabilization, and antibody incubation were performed as described for ImageStream flow cytometry, using rabbit anti-pS6 Ser235/236, rabbit anti-pS6 Ser240/244, rabbit immunoglobulin G isotype control, and FITC-conjugated goat anti-rabbit.
Statistical analysis
Data bars are represented as mean, and error bars indicate standard error of the mean. Data of synergy experiments visualized as heatmaps show the mean of 3 individual experiments. Data points of experiments comparing expected and observed specific apoptosis are obtained from the same 3 individual experiments. Statistical analysis was performed by using GraphPad Prism 8 (GraphPad Software Inc.). Sets of 2 groups were compared by using paired Student t tests, and comparison of 3 groups was performed by two-way analysis of variance using Šidák correction for multiple comparison. For all tests, a P value <.05 was considered statistically significant.
Results
Dexamethasone synergizes with MCL-1 inhibitor S63845 to induce apoptosis
Eight drugs representing 5 drug classes (Figure 1A) that are available or in clinical trials for relapsed-refractory MM and have a direct effect on apoptosis induction in vitro were tested in combinations of 2 for synergistic apoptosis of HMCLs. Of the resulting 28 drug combinations, 13 combinations showed a more-than-additive effect on apoptosis of all 3 HMCLs (Figure 1B-C). The most potent drug combinations included combinations of BH3 mimetics and combinations of a BH3 mimetic with dexamethasone (Figure 1C). The drug combination with the most potent synergistic response was dexamethasone with MCL-1i. The average specific apoptosis induced by this combination was >50% higher compared with the sum of the individual drugs.
To verify this result, the HMCLs were exposed to dilution series of dexamethasone and MCL-1i, individual and combined (Figure 1D; supplemental Figure 2). Specific apoptosis at the optimal drug concentrations was significantly increased compared with an additive effect of the 2 drugs (Figure 1E). In addition, average combination indexes below 0.2 (MM1s.), 0.6 (OPM-2), and 0.4 (L363) confirmed synergy between dexamethasone and MCL-1i in HMCLs with varying sensitivity to the single drugs (supplemental Figure 3).
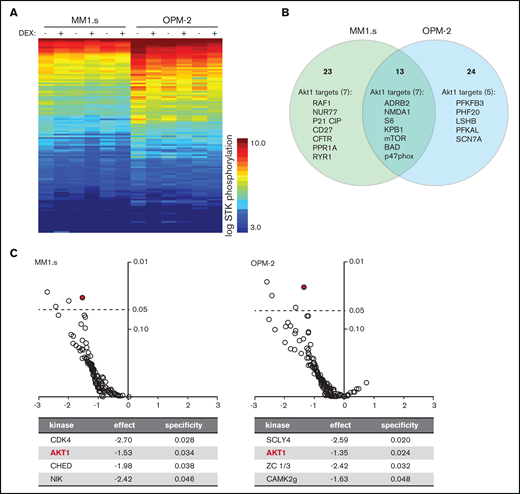
Exposure of HMCLs to dexamethasone (DEX) reduces phosphorylation of Akt1 substrates. (A) Heatmap showing STK phosphorylation of peptides in lysates of MM1.s and OPM-2 exposed to 1 μM DEX or dimethyl sulfoxide (DMSO) control for 4 hours. Columns represent 3 technical triplicates per HMCL and treatment condition. Every row represents a unique peptide motif. The log STK phosphorylation is indicated by a color scale in which low phosphorylated peptides are indicated by blue and high phosphorylated peptides by orange/red. (B) Venn diagram depicting total number of peptides with statistically significant reduced phosphorylation in DEX-treated MM1.s (23 unique hits) and OPM-2 (24 unique hits; 13 hits shared between both HMCLs), compared with control cells. Significant hits belonging to Akt1 downstream substrates are specified per HMCL (7 of 23 unique hits for MM1s; 5 of 24 unique hits for OPM-2; 7 of 13 hits shared between both HMCLs). Original data are provided in supplemental Figure 4. (C) Volcano plot of predicted STK activity based on statistically significant dexamethasone-mediated reduction of peptide phosphorylation as shown in supplemental Figure 4, showing fold-difference (x-axis) and specificity (y-axis). Statistical significance with a P value <.05 is indicated by the dashed line. Details are provided for the significant STK’s per HMCL. Akt1 is indicated by the red mark.
Exposure of HMCLs to dexamethasone (DEX) reduces phosphorylation of Akt1 substrates. (A) Heatmap showing STK phosphorylation of peptides in lysates of MM1.s and OPM-2 exposed to 1 μM DEX or dimethyl sulfoxide (DMSO) control for 4 hours. Columns represent 3 technical triplicates per HMCL and treatment condition. Every row represents a unique peptide motif. The log STK phosphorylation is indicated by a color scale in which low phosphorylated peptides are indicated by blue and high phosphorylated peptides by orange/red. (B) Venn diagram depicting total number of peptides with statistically significant reduced phosphorylation in DEX-treated MM1.s (23 unique hits) and OPM-2 (24 unique hits; 13 hits shared between both HMCLs), compared with control cells. Significant hits belonging to Akt1 downstream substrates are specified per HMCL (7 of 23 unique hits for MM1s; 5 of 24 unique hits for OPM-2; 7 of 13 hits shared between both HMCLs). Original data are provided in supplemental Figure 4. (C) Volcano plot of predicted STK activity based on statistically significant dexamethasone-mediated reduction of peptide phosphorylation as shown in supplemental Figure 4, showing fold-difference (x-axis) and specificity (y-axis). Statistical significance with a P value <.05 is indicated by the dashed line. Details are provided for the significant STK’s per HMCL. Akt1 is indicated by the red mark.
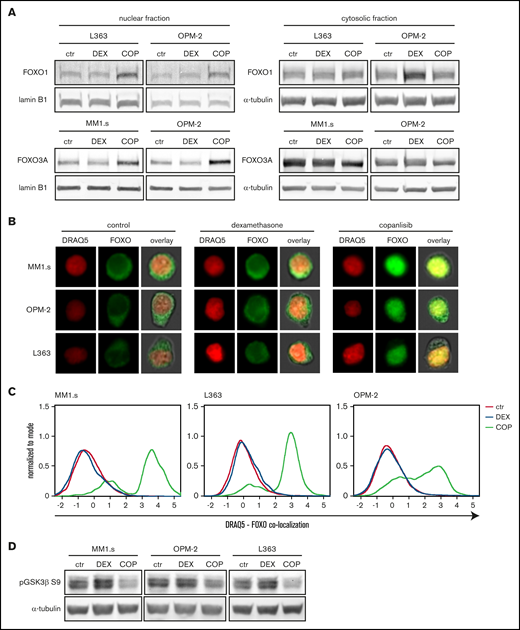
Exposure to dexamethasone (DEX) does not alter FOXO or GSK3β activity in HMCLs. (A) Representative western blot showing FOXO1 and FOXO3a protein expression in nuclear and cytosolic fractions of the indicated HMCLs after 4 hours of exposure to 1 μM DEX, 100 nM copanlisib (COP), or negative control (ctr). α-tubulin and lamin B1 were used as loading controls for cytosolic and nuclear fractions, respectively. (B) Representative image-based flow cytometry image captures by ImageStream at original 60× magnification from indicated HMCLs exposed for 4 hours to DEX 1 μM, COP 100 nM, or negative control. Single images were taken for nuclear dye DR and FOXO (FOXO3a for MM1.s and OPM-2 and FOXO1 for L363) and overlaid with bright-field images. (C) Histograms showing colocalization between DR and FOXO of ImageStream data as obtained in panel B. A positive value indicates similar pixel occupancy, and therefore colocalization, between DR and FOXO, whereas a negative value indicates no similarity in pixel occupancy between both signals. (D) Representative western blot showing expression of GSK3β phosphorylated on serine residue 9 (pGSK3β S9) in indicated HMCLs after 4 hours of exposure to 1 μM DEX, 100 nM COP, or control. α-tubulin was used as a loading control. Quantification findings are given in supplemental Figure 6.
Exposure to dexamethasone (DEX) does not alter FOXO or GSK3β activity in HMCLs. (A) Representative western blot showing FOXO1 and FOXO3a protein expression in nuclear and cytosolic fractions of the indicated HMCLs after 4 hours of exposure to 1 μM DEX, 100 nM copanlisib (COP), or negative control (ctr). α-tubulin and lamin B1 were used as loading controls for cytosolic and nuclear fractions, respectively. (B) Representative image-based flow cytometry image captures by ImageStream at original 60× magnification from indicated HMCLs exposed for 4 hours to DEX 1 μM, COP 100 nM, or negative control. Single images were taken for nuclear dye DR and FOXO (FOXO3a for MM1.s and OPM-2 and FOXO1 for L363) and overlaid with bright-field images. (C) Histograms showing colocalization between DR and FOXO of ImageStream data as obtained in panel B. A positive value indicates similar pixel occupancy, and therefore colocalization, between DR and FOXO, whereas a negative value indicates no similarity in pixel occupancy between both signals. (D) Representative western blot showing expression of GSK3β phosphorylated on serine residue 9 (pGSK3β S9) in indicated HMCLs after 4 hours of exposure to 1 μM DEX, 100 nM COP, or control. α-tubulin was used as a loading control. Quantification findings are given in supplemental Figure 6.
Expression of pro-survival BCL-2 family members has been shown to influence sensitivity to MCL-1 inhibition26 and thus potentially also affects synergy between dexamethasone and MCL-1i. We therefore measured their expression in dexamethasone-treated HMCLs. Exposure of HMCLs to dexamethasone did not reduce protein levels of MCL-1, BCL-2, or BCL-XL (Figure 1F). This excludes direct reduction of pro-survival proteins by dexamethasone as a general underlying mechanism of synergy in combination with MCL-1i.
Kinome analysis reveals dexamethasone-mediated reduction of Akt signaling as potential underlying mechanism of synergy with MCL-1i
To further investigate the mechanism underlying synergy between dexamethasone and MCL-1i, kinome analysis on dexamethasone-treated HMCLs was performed. A comprehensive decrease in STK phosphorylation was observed in dexamethasone-treated samples compared with their paired controls (Figure 2A). Statistical analysis revealed 11 peptides with significantly reduced phosphorylation in both HMCLs, 25 unique peptides for MM1.s and 26 for OPM-2 (supplemental Figure 4). More than 30% of these peptides belong to established Akt targets; 7 unique Akt targets in MM1.s and 5 in OPM-2, and 7 Akt targets, including the well-established downstream mediator mTOR, S6, and Bad, were identified in both HMCLs (Figure 2B). Additional analysis of the significant peptides by using database-driven software predicted a reduction in Akt1 kinase activity as the single significant effect of dexamethasone shared between both HMCLs (Figure 2C).
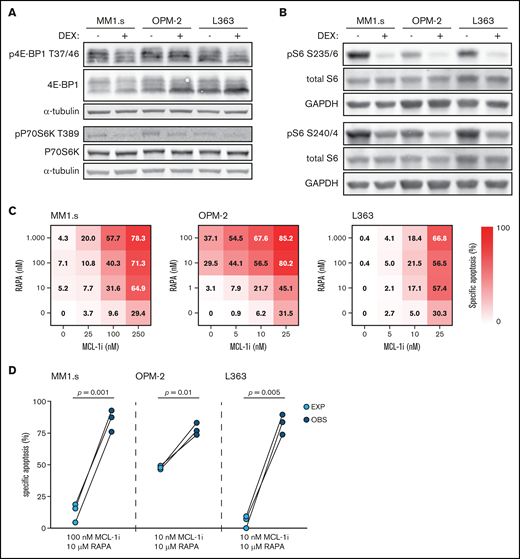
Dexamethasone (DEX) reduces mTORC1 signaling and mTORC1 inhibitor rapamycin synergizes with MCL-1i. (A) Representative western blot showing total 4E-BP1 and 4E-BP1 phosphorylation on threonine residue 37/46 (p4E-BP1 T37/46), and total P70S6K and P70S6K phosphorylation on threonine residue 389 (pP70S6K T389) in indicated HMCLs after 4 hours of exposure to 1 μM DEX or negative control. α-tubulin was used as a loading control. Quantification findings are given in supplemental Figure 7. (B) Representative western blot showing total S6 and S6 phosphorylation on serine residues 235/236 (pS6 S235/6) and 240/244 (pS6 S240/4) in indicated HMCLs after 4 hours of exposure to 1 μM DEX or negative control. Glyceraldehyde-3-phosphate dehydrogenase (GAPDH) was used as a loading control. (C) Heatmaps showing specific apoptosis of indicated HMCLs induced by serial dilution of rapamycin (RAPA) and MCL-1i, individual or combined. Viability was analyzed after 48 hours of drug exposure; values show the mean of 3 individual experiments. (D) Plots comparing expected (EXP) specific apoptosis vs observed (OBS) specific apoptosis induced by RAPA and MCL-1i combinations. Per HMCL the drug combination that resulted in the highest average OBS-EXP ratio was selected from the data obtained in panel C. The 3 connected data points show the data obtained from 3 individual experiments. Statistical analysis was performed by using paired Student t tests.
Dexamethasone (DEX) reduces mTORC1 signaling and mTORC1 inhibitor rapamycin synergizes with MCL-1i. (A) Representative western blot showing total 4E-BP1 and 4E-BP1 phosphorylation on threonine residue 37/46 (p4E-BP1 T37/46), and total P70S6K and P70S6K phosphorylation on threonine residue 389 (pP70S6K T389) in indicated HMCLs after 4 hours of exposure to 1 μM DEX or negative control. α-tubulin was used as a loading control. Quantification findings are given in supplemental Figure 7. (B) Representative western blot showing total S6 and S6 phosphorylation on serine residues 235/236 (pS6 S235/6) and 240/244 (pS6 S240/4) in indicated HMCLs after 4 hours of exposure to 1 μM DEX or negative control. Glyceraldehyde-3-phosphate dehydrogenase (GAPDH) was used as a loading control. (C) Heatmaps showing specific apoptosis of indicated HMCLs induced by serial dilution of rapamycin (RAPA) and MCL-1i, individual or combined. Viability was analyzed after 48 hours of drug exposure; values show the mean of 3 individual experiments. (D) Plots comparing expected (EXP) specific apoptosis vs observed (OBS) specific apoptosis induced by RAPA and MCL-1i combinations. Per HMCL the drug combination that resulted in the highest average OBS-EXP ratio was selected from the data obtained in panel C. The 3 connected data points show the data obtained from 3 individual experiments. Statistical analysis was performed by using paired Student t tests.
Dexamethasone exposure does not affect FOXO and GSK3 activity
A potent downstream mechanism by which Akt regulates survival and apoptosis is inactivation of FOXO and GSK3.19 Western blot analysis showed that HMCLs either express FOXO1 (L363), FOXO3a (MM1.s), or a combination of both (OPM-2) (supplemental Figure 5). To test if the predicted dexamethasone-mediated reduction in Akt1 activity also results in nuclear translocation and thus re-activation of FOXO, the 3 HMCLs were exposed to dexamethasone or copanlisib, a pan-class I PI3K inhibitor that strongly reduces Akt activity and downstream signaling.31 Exposure of the HMCLs to dexamethasone did not alter nuclear FOXO1 or FOXO3a levels (Figure 3A). Visualization and quantification of FOXO expression relative to nuclear positions by using image-based flow cytometry revealed a predominant cytosolic localization of FOXO in untreated HMCLs, characteristic of FOXO inhibition by active Akt (Figure 3B-C). Exposure to dexamethasone did not alter these FOXO localization patterns. Only copanlisib exposure increased nuclear FOXO localization in the 3 HCMLs.
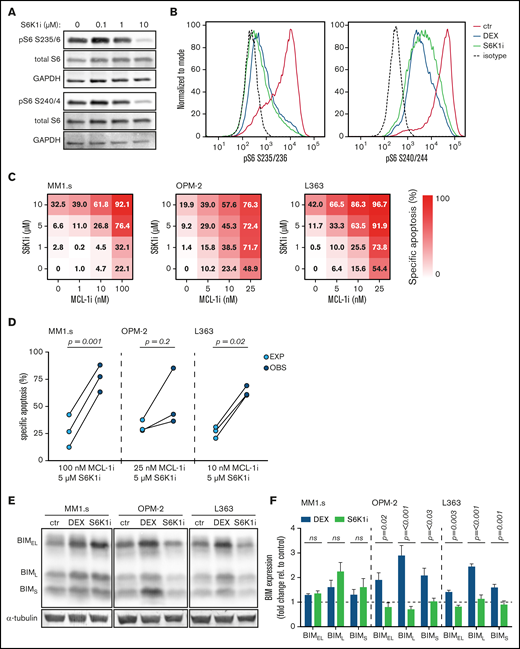
S6K1i inhibits S6 phosphorylation and synergizes with MCL-1i in apoptosis induction of HMCLs, independent of BIM protein induction. (A) Western blot showing total S6 and S6 phosphorylation on serine residues 235/236 (pS6 S235/6) and 240/244 (pS6 S240/4) in MM1.s after 4 hours of exposure to indicated concentrations of S6K1i. Glyceraldehyde-3-phosphate dehydrogenase (GAPDH) was used as a loading control. (B) Histograms comparing expression of S6 phosphorylation on serine residues 235/236 (pS6 S235/236) and 240/244 (pS6 S240/244) in MM1.s after 4 hours of exposure to 1 μM dexamethasone (DEX) or 10 μM S6K1i, determined by flow cytometric analysis. Expression was relative to medium-treated control cells (ctr) and corrected for isotype control, indicated by the dashed line. (C) Heatmaps showing specific apoptosis of indicated HMCLs induced by serial dilution of S6K1i and MCL-1i, individual or combined. Viability was analyzed after 48 hours of drug exposure; values show the mean of 3 individual experiments. (D) Plots comparing expected (EXP) specific apoptosis vs observed (OBS) specific apoptosis induced by S6K1i and MCL-1i combinations. Per HMCL, the drug combination that resulted in the highest average OBS-EXP ratio was selected from the data obtained in panel C. The 3 connected data points show the data obtained from 3 individual experiments. Statistical analysis was performed by paired Student t tests. (E) Representative western blot showing expression of 3 BIM isoforms in indicated HMCLs after 24 hours of exposure to 1 μM DEX, 10 μM S6K1i, or negative control. α-tubulin was used as a loading control. (F) Comparison of BIM isoform expression in HMCLs treated with 1 μM DEX or 10 μM S6K1i. Values show the mean quantification of 3 individual western blot experiments, normalized to α-tubulin and relative to untreated ctr cells, indicated by the dashed line. Statistical analysis was performed by two-way analysis of variance using Šidák correction for multiple testing. ns, not significant.
S6K1i inhibits S6 phosphorylation and synergizes with MCL-1i in apoptosis induction of HMCLs, independent of BIM protein induction. (A) Western blot showing total S6 and S6 phosphorylation on serine residues 235/236 (pS6 S235/6) and 240/244 (pS6 S240/4) in MM1.s after 4 hours of exposure to indicated concentrations of S6K1i. Glyceraldehyde-3-phosphate dehydrogenase (GAPDH) was used as a loading control. (B) Histograms comparing expression of S6 phosphorylation on serine residues 235/236 (pS6 S235/236) and 240/244 (pS6 S240/244) in MM1.s after 4 hours of exposure to 1 μM dexamethasone (DEX) or 10 μM S6K1i, determined by flow cytometric analysis. Expression was relative to medium-treated control cells (ctr) and corrected for isotype control, indicated by the dashed line. (C) Heatmaps showing specific apoptosis of indicated HMCLs induced by serial dilution of S6K1i and MCL-1i, individual or combined. Viability was analyzed after 48 hours of drug exposure; values show the mean of 3 individual experiments. (D) Plots comparing expected (EXP) specific apoptosis vs observed (OBS) specific apoptosis induced by S6K1i and MCL-1i combinations. Per HMCL, the drug combination that resulted in the highest average OBS-EXP ratio was selected from the data obtained in panel C. The 3 connected data points show the data obtained from 3 individual experiments. Statistical analysis was performed by paired Student t tests. (E) Representative western blot showing expression of 3 BIM isoforms in indicated HMCLs after 24 hours of exposure to 1 μM DEX, 10 μM S6K1i, or negative control. α-tubulin was used as a loading control. (F) Comparison of BIM isoform expression in HMCLs treated with 1 μM DEX or 10 μM S6K1i. Values show the mean quantification of 3 individual western blot experiments, normalized to α-tubulin and relative to untreated ctr cells, indicated by the dashed line. Statistical analysis was performed by two-way analysis of variance using Šidák correction for multiple testing. ns, not significant.
In addition to FOXO activation, we investigated if dexamethasone could reduce Akt-mediated inhibition of GSK3. The phosphorylation status of the GSK3β isoform on inhibitory serine 9 residue was thus assessed. Exposure to dexamethasone did not alter GSK3β phosphorylation in the 3 HMCLs (Figure 3D; supplemental Figure 6). This in contrast to copanlisib, which reduced pGSK3β S9 expression by >40%. Combined, this scenario indicates that dexamethasone does not alter FOXO and GSK3 activity downstream of Akt.

S6K1i and MCL-1i synergistically induce apoptosis of ex vivo cultured primary MM plasma cells. (A) Representative plots of flow cytometric analysis of apoptosis induction in CD38+ primary MM cells after 48 hours of exposure to the indicated concentrations MCL-1, dexamethasone (DEX), or S6K1i. Gates represent viable (DiOC6+/TO-PRO-3–) and dead (DiOC6–/TO-PRO-3+) cells. (B) Plots comparing expected (EXP) specific apoptosis vs observed (OBS) specific apoptosis induced by 48 hours of exposure to 100 nM DEX or 10 μM S6K1i, in combination with 10 nM or 100 nM MCL-1i in CD38+ primary MM cells as indicated in panel A. Statistical analysis was performed by using paired Student t tests. (C) Representative histogram and quantification plot showing S6 phosphorylation on serine residues 240/244 (pS6 S240/244) in CD38+ primary MM cells exposed to 100 nM DEX or 10 μM S6K1i for 8 hours, assessed by flow cytometry. The geometric mean fluorescent intensity (gMFI) was normalized to immunoglobulin G isotype control and relative to untreated control cells (ctr).
S6K1i and MCL-1i synergistically induce apoptosis of ex vivo cultured primary MM plasma cells. (A) Representative plots of flow cytometric analysis of apoptosis induction in CD38+ primary MM cells after 48 hours of exposure to the indicated concentrations MCL-1, dexamethasone (DEX), or S6K1i. Gates represent viable (DiOC6+/TO-PRO-3–) and dead (DiOC6–/TO-PRO-3+) cells. (B) Plots comparing expected (EXP) specific apoptosis vs observed (OBS) specific apoptosis induced by 48 hours of exposure to 100 nM DEX or 10 μM S6K1i, in combination with 10 nM or 100 nM MCL-1i in CD38+ primary MM cells as indicated in panel A. Statistical analysis was performed by using paired Student t tests. (C) Representative histogram and quantification plot showing S6 phosphorylation on serine residues 240/244 (pS6 S240/244) in CD38+ primary MM cells exposed to 100 nM DEX or 10 μM S6K1i for 8 hours, assessed by flow cytometry. The geometric mean fluorescent intensity (gMFI) was normalized to immunoglobulin G isotype control and relative to untreated control cells (ctr).
Dexamethasone inhibits the mTORC1–P70S6K axis, which underlies its synergistic effects with MCL-1 inhibition
An alternative for Akt-mediated inhibition of FOXO and GSK3 to regulate cell death and survival is Akt-mediated activation of mTORC1.19 To determine the activity of this complex, the phosphorylation status of its 2 direct targets, 4E-BP1 threonine 37/46 and P70S6K threonine 389, was assessed. Although dexamethasone did not alter 4E-BP1 phosphorylation, it reduced P70S6K phosphorylation by ∼50% in all 3 HMCLs (Figure 4A; supplemental Figure 7). To assess whether P70S6K activity is indeed inhibited, we measured phosphorylation of its direct substrate ribosomal protein S6. As expected, the dexamethasone-treated HMCLs showed a clear reduction in S6 phosphorylation on both serine 235/236 and 240/244 residues (Figure 4B). These data are in concordance with the reduction in mTOR and S6 phosphorylation that was observed in the kinome analysis of dexamethasone-treated HMCLs (Figure 2B). Furthermore, prednisolone, the active metabolite of the GC prednisone, recapitulated dexamethasone effects. In combination with MCL-1i, prednisolone induced synergistic apoptosis of the HMCLs MM1.s and L363 (supplemental Figure 8A-C) and reduced S6 phosphorylation on serine 235/236 and serine 240/244 residues to a similar extent as dexamethasone (supplemental Figure 8D).
To determine if the dexamethasone-mediated reduction in mTORC1 signaling could be the molecular mechanism responsible for synergy with MCL-1i, dexamethasone was replaced by the allosteric mTORC1 inhibitor rapamycin. Although sensitivity to rapamycin varied, the combination with MCL-1i substantially increased apoptosis of the 3 HMCLs (Figure 4C; supplemental Figure 9). Specific apoptosis induced by this drug combination was significantly higher than could be expected by an additive effect of the 2 drugs in MM1.s and L363 (Figure 4D). A similar trend was observed for OPM-2, even though this HMCL was sensitive to single-agent rapamycin. Taken together, these data indicate that dexamethasone inhibits the mTORC1–P70S6K axis downstream of Akt and that this inhibition could explain the synergy with MCL-1i.
Specific P70S6K1 inhibitor PF-4708671 can replace dexamethasone in the synergistic combination with MCL-1 inhibition
To further assess the role of the P70S6K signaling axis as a mechanism of synergy between dexamethasone and MCL-1i, we investigated the effects of the specific P70S6K1 isoform inhibitor PF-4708671 (S6K1i). Titration of S6K1i on MM1.s showed that it reduces phosphorylation of S6 in a dose-dependent manner, with an optimal effect at a dosage of 10 μM, similar to what was previously described (Figure 5A).32 This was comparable to inhibition mediated by dexamethasone 1 μM (Figure 5B). Similar to dexamethasone, S6K1i exposure resulted in a dose-dependent induction of apoptosis of the 3 HMCLs (Figure 5C; supplemental Figure 10). Combination of S6K1i with MCL-1i significantly increased specific apoptosis of MM1.s and L363 compared with the additive effect of the individual drugs (Figure 5D). In addition, average combination indexes below 0.6 (MM1.s), 0.7 (OPM-2), and 0.8 (L363) confirmed synergy between S6K1i and MCL-1i for all 3 HMCLs (supplemental Figure 11). Together, these data show that dexamethasone could be replaced by S6K1i in the combination with MCL-1i to synergistically induce apoptosis of HMCLs. A potential pitfall of inhibiting molecules downstream in the Akt pathway is release of the negative feedback loop between S6K and IRS1, which can result in hyperactivation of Akt33 and could therefore reverse the anti-myeloma effects of S6K1i. We thus compared the effects of dexamethasone and S6K1i on Akt kinase activity by assessing the phosphorylation status at the activating serine 473 residue (supplemental Figure 12). S6K1i exposure, single or in combination with MCL-1i, did not result in increased phosphorylation of Akt S473 compared with dexamethasone and therefore poses no increased risk of Akt hyperactivation.
One mechanism by which dexamethasone and other GCs induce apoptosis of MM and other hematopoietic cancers is by induction of the pro-apoptotic BH3-only protein BIM.10,34 As expected, exposure to dexamethasone induced a dose-dependent increase in BIM expression in all 3 HMCLs (supplemental Figure 13). However, exposure to S6K1i only resulted in an increase in BIM expression in MM1.s but not in the other HMCLs (Figure 5E). BIM expression in S6K1i-treated OPM-2 and L363 remained stable or even decreased compared with untreated control cells. Statistical analysis showed that expression of all 3 main BIM isoforms was significantly lower in S6K1i-treated OPM-2 and L363 compared with their dexamethasone-treated counterparts (Figure 5F). Combined, this indicates that BIM induction is not required for S6K1i-induced apoptosis of HMCLs or its synergistic effect in combination with MCL-1i. In addition, we assessed expression of pro-survival proteins MCL-1, BCL-2, and BCL-XL and of the pro-apoptotic BH-3–only protein NOXA, which was also identified as playing an important role in MM treatment.35 Interestingly, no consistent alterations in protein expression were observed when HMCLs were exposed to dexamethasone or S6K1i as single agents, or in combination with MCL-1i (supplemental Figure 14). Also, activity of the pro-apoptotic BH-3–only protein Bad, as assessed by phosphorylation on the serine 136 residue that has previously been linked to P70S6K-mediated regulation of cell survival,36 showed no consistent decrease in these conditions (supplemental Figure 15). Together, these data provide no indication for a conserved mechanism of apoptosis induction in HMCLs exposed to dexamethasone or S6K1i.
S6K1i and MCL-1i synergistically induce apoptosis of primary MM plasma cells with minimal toxicity on stem and progenitor cells
We next investigated the apoptosis-inducing effects of the dexamethasone/MCL-1i and S6K1i/MCL-1i drug combinations on ex vivo cultured plasma cells from 9 untreated MM patients. MNC isolated from bone marrow aspirates were exposed to dexamethasone, S6K1i, and MCL-1i, individual and combined, and specific apoptosis of CD38+ plasma cells was assessed. Exposure to MCL-1i resulted in a dose-dependent increase in specific apoptosis ranging from 0% to 37% (average, 22%) at 10 nM, and 10% to 72% (average, 49%) at 100 nM (Figure 6A; supplemental Figure 16). For single dosages of dexamethasone and S6K1i, specific apoptosis varied between 0% and 37% (average, 10%), and 0% and 25% (average, 9%), respectively. In 5 of 9 MM samples, combination of dexamethasone with low-dose MCL-1i resulted in an increase in specific apoptosis that was higher than could be expected from an additive response (Figure 6B). A similar effect was observed for 6 of 9 MM samples when dexamethasone was combined with high-dose MCL-1i. Importantly, in all 9 MM samples, S6K1i resulted in an additive or more-than-additive effect on apoptosis in combination with low-dose MCL-1i. In combination with high-dose MCL-1i, a significant more-than-additive effect on apoptosis was reached in all examined MM samples. Three of the included MM samples (MM1, MM3, and MM4) were subjected to a more extensive range of drug concentrations (supplemental Figure 17). With average combination indexes of 0.4 to 0.7 for the dexamethasone/MCL-1i combinations and combination indexes of 0.6 to 0.7 for S6K1i/MCL-1i combinations, synergy in primary MM was confirmed for both drug combinations.
We also analyzed S6 phosphorylation in 2 of the MM samples, as this was reduced in HMCLs after dexamethasone or S6K1i treatment. Exposure of both MM2 and MM6 to single dexamethasone or S6K1i reduced S6 phosphorylation by 30% to 60%, compared with untreated control cells (Figure 6C). These results highlight the molecular mechanism of action shared between dexamethasone and S6K1i to reduce P70S6K activity.
To explore a potential therapeutic window for the S6K1i/MCL-1i drug combination, we assessed its toxicity compared with the dexamethasone/MCL-1i drug combination in CD34+ stem and progenitor cells that were isolated from umbilical cord blood MNC of 2 healthy donors. Exposure of CD34+ cells to S6K1i in combination with low-dose MCL-1i resulted in 8% average specific apoptosis (supplemental Figure 18). In combination with high-dose MCL-1i, toxicity increased to 33%, which was similar to specific apoptosis induced by combination of dexamethasone with low-dose MCL-1i. To compare the apoptosis-inducing effects on myeloma cells vs the potential toxic side effects on microenvironment stem and progenitor cells, we assessed both S6K1i/MCL-1i and dexamethasone/MCL-1i drug combinations in a preclinical three-dimensional MM model that was previously published by Braham et al.28 S6K1i in combination with high-dose MCL-1i diminished the viable OPM-2 population, whereas no reduction in the viable EPC or MSC population could be observed (supplemental Figure 19A). Importantly, quantification of specific apoptosis showed near-complete killing of OPM-2 cells (97%) with only limited toxic effects on EPC and MSC populations (10% and 14%, respectively) (supplemental Figure 19B). This was similar to the effects of dexamethasone in combination with high-dose MCL-1i. Because these combinatorial dosages of S6K1i and MCL-1i were sufficient to induce synergistic apoptosis of primary MM cells, this indicates a potential therapeutic window for intervention by the S6K1i/MCL-1i drug combination.
Discussion
The rapid development of new drugs for the treatment of MM holds a promising outlook for patient survival and quality of life. However, for these novel drugs to be effectively incorporated into MM treatment regimens, it is essential to investigate which drugs act in synergy, by which mechanisms, and how this affects toxicity. In the current study, we performed a lethality screen to assess synergy between 2 drugs, both new and conventional, and reported MCL-1i and dexamethasone as the most potent synergistic combination. The successful combination of dexamethasone and MCL-1 inhibition in MM has recently been recognized by in vitro studies7,8 and might be explained by their converging effects on intrinsic apoptosis activation. However, although dexamethasone and other GCs are a cornerstone of MM therapy, the mechanism(s) by which they induce apoptosis have been a long-standing question. Dexamethasone treatment of MM1.s cells has been shown to reduce transcription and expression of pro-survival proteins,8,37 but we observed no dexamethasone-induced reduction in MCL-1, BCL-2, or BCL-Xl protein levels. A central role has also been assigned to dexamethasone-induced expression of pro-apoptotic BIM.10,38 Indeed, we observed increased BIM expression in HMCLs after dexamethasone exposure, but direct transcriptional regulation by the dexamethasone–GR complex seems unlikely due to lack of GC-responsive elements in the BIM promotor region.39
By direct transcriptional modulation via GC-responsive elements and (in)direct interaction with multiple additional transcription factors, dexamethasone and other GCs can influence various cellular signaling systems.40 According to kinome analysis of dexamethasone-treated HMCLs, we observed that 30% of the peptides with significantly reduced STK phosphorylation belong to known Akt substrates. By regulating both pro-apoptotic and pro-survival molecules, the PI3K-Akt pathway is one of the major signaling pathways balancing cell survival and apoptosis.17 FOXO transcription factors can regulate BIM transcription in a variety of cell types, including lymphocytes.41 In addition, GSK3 can regulate BIM activation,42 and the GSK3-β isoform was also shown capable of regulating MCL-1 protein stability.43,44 Our data, however, show no dexamethasone-induced downstream Akt effects on FOXO or GSK3β activation, and the molecular mechanism of BIM induction therefore remains unclear.
Aberrant Akt-mTORC1 signaling is a common feature in many malignancies, including MM.45 Although the predicted dexamethasone-mediated reduction in Akt activity was not accompanied by effects on FOXO or GSK3-β, we confirmed a potent reduction in mTORC1 signaling. Dexamethasone could be replaced by rapamycin to mimic the synergistic effects on apoptosis in combination with MCL-1i. Interestingly, MM1.s and L363 were insensitive to single-agent rapamycin, whereas the combination with MCL-1i resulted in up to 5.5-fold more apoptosis compared with single-agent MCL-1i. The potentiating effects of rapamycin to induce cell death and overcome drug resistance in combination with other agents, including bortezomib and dexamethasone, have previously been recognized in clinical trials for MM.45 Downstream of mTORC1, we observed a 50% reduction in P70S6K phosphorylation but only a 10% reduction in phosphorylation of 4E-BP1. This suggests that dexamethasone, similar to rapamycin and rapalogues, most strongly reduces activity of rapamycin-sensitive mTORC1 substrates (ie, P70S6K) but less of rapamycin-insensitive mTORC1 substrates (ie, 4E-BP1).46
The mTORC1–P70S6K1 axis is an important regulator of cell death and survival. It controls protein biosynthesis, an essential process required for cell growth and proliferation, and thereby indirectly affects cell survival.24 In addition, P70S6K1 is capable of binding to mitochondrial membranes and subsequent phosphorylation of Bad, phosphorylation of Mdm2 upstream of p53, and phosphorylation of GSK3, thereby inhibiting the activity of these mediators in senescence and apoptosis.36,47 ,48 Together, this makes P70S6K1 an interesting anticancer target, which resulted in the development of the first specific P70S6K1 inhibitor, PF-4708671.32 We found that S6K1i 10 μM was equally potent as dexamethasone 1 μM in inhibiting P70S6K activity. In addition, dexamethasone could be replaced by S6K1i to induce synergistic apoptosis of HMCLs in combination with MCL-1i, although not to the extent of the dexamethasone/MCL-1i combination. This discrepancy might be explained by differences in apoptosis activation by both agents. Exposure of HMCLs to S6K1i did not result in BIM induction as was observed for dexamethasone, suggesting that BIM induction is not required for the synergistic killing of HMCLs in combination with MCL-1i. More likely, one or multiple P70S6K1-dependent mechanisms are responsible for the synergistic effect observed with MCL-1i. Dexamethasone-induced BIM could, however, still contribute to the overall apoptotic process, explaining the observed difference in potency between dexamethasone and S6K1i.
Although the synergistic S6K1i/MCL-1i combination was found to be somewhat less potent than the dexamethasone/MCL-1i combination in HMCLs, S6K1i did outperform dexamethasone in inducing apoptosis in a subset of primary MM cells in combination with MCL-1i. Interestingly, MM samples that showed no synergistic effect upon exposure to the dexamethasone/MCL-1i combination did exhibit more-than-additive apoptosis upon exposure to the S6K1i/MCL-1i combination. This effect was significant in combinations with high-dose MCL-1i. A possible explanation for this difference is the more direct mechanism of action of S6K1i. Whereas dexamethasone is likely dependent on a transcription-mediated inhibition of P70S6K, S6K1i can directly block kinase activity. This is of particular interest in light of GC resistance. A significant subpopulation of patients experience resistance to dexamethasone and other GCs due to a variety of molecular mechanisms resulting in altered GR function and/or GR-mediated transcription.49 S6K1i could potentially circumvent this GC resistance and induce synergy with MCL-1i. This could also be of interest for other hematologic malignancies that are treated with GCs such as acute lymphoblastic leukemia and non-Hodgkin lymphoma.50 In addition, many of the GC-induced toxic side effects are suggested to be the result of GR transactivation.51 By replacing GCs with S6K1i in the synergistic combination with MCL-1i, GR-associated toxicity would be diminished.
Although our work reveals novel opportunities for MM treatment, limitations to the current study remain that should be pursued in the future. Validation of the molecular mechanism underlying synergy with MCL-1 inhibition in MM could be addressed by genetic studies, either based on the inducible deletion of active P70S6K1 or induction of constitutively active P70S6K1. Furthermore, in vivo studies would provide more information about the effectiveness, as well as the toxicity, of the proposed drug combination. Clinical studies combining MCL-1i and S6K1i could be a subsequent step to prove the relevance of our findings. MCL-1 inhibitors, both single-agent and in combination with dexamethasone, are currently in clinical trials for MM.6 Also, the first clinical trials using the adenosine triphosphate (ATP)–competitive pan P70S6K inhibitor LY2584702 tosylate for treatment of patients with advanced solid tumors were completed.52,53 A recently reported single-dose study in healthy participants showed that this pan P70S6K inhibitor causes no serious adverse events (clinicaltrials.gov identifier #NCT01372085). The P70S6K 1 isoform inhibitor used in this study has proven to be specific with no identified off-target effects at 10 µM dosages.32 In addition, 2 studies with mouse solid tumor xenograft models reported no signs of toxicity or suffering at therapeutic dosages.54,55 We also observed limited toxicity of healthy donor stem and progenitor cells in combination with MCL-1i at dosages that caused significant synergistic apoptosis of primary MM cells. Observed toxicity by the S6K1i/MCL-1i combination did not exceed the effects induced by the dexamethasone/MCL-1i combination. Together, our findings provide a strong rationale to combine MCL-1 inhibitors and P70S6K 1 inhibitors in the treatment of MM to induce synergistic apoptosis of MM cells, with limited toxicity to stem and progenitor cells, and devoid of GR-induced toxicity and resistance.
Acknowledgments
The authors thank the support facilities of the University Medical Center Utrecht and the Dutch Parelsnoer Institute for providing primary patient and donor samples. They are grateful to Servier for providing the MCL-1–specific inhibitor S63845. The authors thank Maud Plantinga for providing umbilical cord blood CD34+ samples and Zsolt Sebestyen for endothelial progenitor cells. In addition, they thank Savithri Rangarajan for support with the kinome analyses.
This work was supported in part by a Bas Mulder Award from the Dutch Cancer Foundation (KWF)/Alpe d'HuZes foundation (No. UU 2015-7663) (V.P.) and a project grant from the Dutch Cancer Foundation (KWF)/Alpe d'HuZes foundation (No. 11108) (V.P.).
The funding agencies played no role in the design, reviewing, or writing of the manuscript.
Authorship
Contribution: I.S., L.M.T., and V.P. designed the research; I.S., L.M.T., T.K., A.S., M.C., N.v.N., and L.M.M. performed the experiments and analyzed the results; I.S., L.M.T., T.K., A.S., M.C., M.C.M., R.A.R., and V.P. contributed to interpretation and discussion; I.S., R.A.R., and V.P. wrote and revised the manuscript; M.C.M., R.A.R., and V.P. supervised the study; and all authors reviewed and approved the final manuscript.
Conflict-of-interest disclosure: V.P. received research funding from Philips and royalty payments related to venetoclax. R.A.R. received honoraria from Novartis. M.C.M. received research funding from Celgene and honoraria from Celgene, Takeda, BMS, Servier, and Gilead. The remaining authors declare no competing financial interests.
ORCID profiles: L.M.T., 0000-0002-2848-1681; M.C.M., 0000-0002-3139-8379; N.v.N., 0000-0002-4120-7898; R.A.R., 0000-0002-4352-4598; V.P., 0000-0002-9011-3820

