

Key Points
Pracinostat has preclinical antilymphoma activity.
Pharmacologic targeting of antioxidant production in OxPhos-DLBCLs partially overcomes resistance to HDAC inhibition.

Abstract
Histone deacetylase inhibitors (HDACis) are antitumor agents with distinct efficacy in hematologic tumors. Pracinostat is a pan-HDACi with promising early clinical activity. However, similar to other HDACis, its activity as a single agent is limited. Diffuse large B-cell lymphoma (DLBCL) includes distinct molecular subsets or metabolically defined subtypes that rely in different ways on the B-cell receptor signaling pathway, oxidative phosphorylation, and glycolysis for their survival. The antitumor activity of pracinostat has not been determined in lymphomas. We performed preclinical in vitro activity screening of 60 lymphoma cell lines that included 25 DLBCLs. DLBCL cells belonging to distinct metabolic subtypes were treated with HDACis for 6 hours or 14 days followed by transcriptional profiling. DLBCL xenograft models enabled assessment of the in vivo antilymphoma activity of pracinostat. Combination treatments with pracinostat plus 10 other antilymphoma agents were performed. Western blot was used to assess acetylation levels of histone and nonhistone proteins after HDACi treatment. Robust antiproliferative activity was observed across all lymphoma histotypes represented. Focusing on DLBCL, we identified a low-sensitivity subset that almost exclusively consists of the oxidative phosphorylation (OxPhos)-DLBCL metabolic subtype. OxPhos-DLBCL cells also showed poorer sensitivity to other HDACis, including vorinostat. Transcriptomic analysis revealed fewer modulated transcripts but an enrichment of antioxidant pathway genes after HDACi treatment of OxPhos-DLBCLs compared with high-sensitivity B-cell receptor (BCR)–DLBCLs. Pharmacologic inhibition of antioxidant production rescued sensitivity of OxPhos-DLBCLs to pracinostat whereas BCR-DLBCLs were unaffected. Our study provides novel insights into the antilymphoma activity of pracinostat and identifies a differential response of DLBCL metabolic subtypes to HDACis.
Introduction
Histone deacetylases (HDACs) regulate numerous processes, including cell cycle, apoptosis, and DNA repair, and are also involved in determining the stability and function of multiple proteins.1-4 In cancer, the aberrant expression, localization, and recruitment of HDAC enzymes by oncogenic proteins helps support malignant cell growth and promote metastasis.1-5 Because of the multiple target specificities of HDACs, histone deacetylase inhibitors (HDACis) have the potential to affect tumor cell survival at different levels. HDACis reverse the repressive effects of HDAC enzymes on transcription through direct binding and inactivation of their enzymatic activity.1,2,6 This leads to increased acetylation of histone tails and subsequent transcriptional activation. In addition, they also mediate the acetylation of nonhistone proteins to affect protein function, localization, and/or interactions.
Pan-HDACis that target all 3 classes of the zinc-dependent HDACs have shown promising activity in aggressive hematologic tumors and, indeed, it is for this class of tumors that HDACis have been approved for clinical use.5 Vorinostat is the archetype of the clinically approved HDACi; it was the first to be approved and is a hydroxamic acid HDACi, the HDACi class that represents all but 1 of the clinically approved HDACis.5 Following the approval of vorinostat for the treatment of relapsed or refractory (R/R) cutaneous T-cell lymphoma (CTCL), romidepsin (a bicyclic peptide) received US Food and Drug Administration approval for R/R peripheral T-cell lymphoma and CTCL, and belinostat was approved for R/R CTCL.5 The most recently approved HDACis are panobinostat for relapsed multiple myeloma and chidamide, a benzamide HDACi approved by the China Food and Drug Administration, for the treatment of R/R peripheral T-cell lymphoma.5 Panobinostat is preclinically active in Hodgkin lymphoma (HL) cells, and several clinical studies have demonstrated its efficacy in HL patients.7-11 As single agents or in combination, HDACis have shown preclinical12-16 and early clinical17-27 antitumor activity in diffuse large B-cell lymphoma (DLBCL) and also in other B-cell lymphomas.
Pracinostat is a pan-HDACi that targets class I (HDACs 1, 2, 3, 8), class II (HDACs 4, 5, 6, 7, 9, 10), and class IV (HDAC 11) enzymes with a pharmacokinetic profile that compares favorably to other pan-HDACis.28,29 In early clinical studies, pracinostat showed an acceptable safety profile but limited clinical activity as a single agent in patients with solid tumors, myelofibrosis, or acute myeloid leukemia (AML).30-33 Promising responses from phase 1/2 clinical trials have been reported for pracinostat in combination with azacitidine in AML as well as in myelodysplastic syndromes, in which low-dose pracinostat was combined with a demethylating agent.34-36 Pracinostat is undergoing further clinical evaluation in studies of drug combinations for treating AML patients.37,38 Here, we report the first findings of the antitumor activity of pracinostat in a large panel of diverse lymphoma histotypes, including DLBCL, for which we identify a subset of cell lines with low sensitivity to HDACi treatment that belong to a distinct metabolic subtype of DLBCL.
Methods
Cell lines and materials
Established human cell lines were derived from T-cell lymphoma (n = 10), DLBCL (n = 25), HL (n = 4), mantle cell lymphoma (MCL; n = 10), marginal zone lymphoma (n = 5), chronic lymphocytic leukemia (n = 2), and primary mediastinal B-cell lymphoma (n = 1). One canine lymphoma and 2 murine lymphoma cell lines were also included in the panel. All cell lines were cultured according to the recommended conditions, as previously described.39 All media were supplemented with fetal bovine serum, penicillin-streptomycin-neomycin (5000 units penicillin, 5 mg streptomycin, and 10 mg/mL neomycin; Sigma), and L-glutamine (1%). Cell line identity was authenticated by short tandem repeat DNA profiling.40 Cells were periodically tested to confirm Mycoplasma negativity using the MycoAlert Mycoplasma Detection Kit (Lonza, Visp, Switzerland). Pracinostat (Batch Lot No. PME1302A05) was provided by Helsinn Healthcare, and vorinostat was purchased from LC Laboratories (LC Laboratories, Woburn, MA). L-buthionine-(S,R)-sulfoximine (BSO) and α-Tocopherol (vitamin E) were purchased from Sigma. Drugs used in combination with pracinostat (5-azacitidine, venetoclax, ibrutinib, lenalidomide, bendamustine, everolimus, rituximab, idelalisib, bortezomib, and copanlisib) were all purchased from Selleck Chemicals (Houston, TX) or LC Laboratories.
Single and combination MTT cell viability assays
Cell viability was determined using the MTT assay as previously described.13 For pracinostat and vorinostat, drug concentrations ranged from 20 000 nM to 0.3 nM (three-fold serially diluted). For combination studies, twofold serially diluted pracinostat was added to cells (500 nM to 7.8 nM) in combination with increasing concentrations of the antilymphoma agents listed above, using a concentration range appropriate for each agent. The Chou-Talalay combination index was used to determine a synergistic (combination index <0.9), additive (combination index, 0.9-1.1), or antagonistic (combination index >1.1) effect for each combination, as previously described.41
For the heatmap of the MTT absorbance values, we transformed the raw absorbances calculating a per-row Z-score transformation. The Z-score [Z = (observed value – median)/standard deviation] ensured that each cell line in the cohort of tested cell lines had a median value of 0 with a standard deviation of 1. We used the median instead of the mean because the median is less sensitive to statistical outliers. The absorbance Z-scored values were then used to perform hierarchical clustering using the heatmap.2 function in the gplots package.42 We launched heatmap.2 with the Euclidean measure to obtain distance matrix and complete agglomeration method for clustering.
In vivo xenograft models
For the lymphoma xenograft experiments, mouse maintenance and experiments were performed under the institutional guidelines established for the Animal Facility and with study protocols approved by the local Cantonal Veterinary Authority (license TI-49-2018). NOD-SCID mice were obtained from The Harlan Laboratory (S. Pietro al Natisone, Udine, Italy). Xenografts were established by injecting TMD8 or U2932 DLBCL cells (15 × 106 cells per mouse, 200 µL of phosphate-buffered saline) into the left flanks of female NOD-SCID mice (6 weeks old, ∼20 g body weight). Tumor size was measured on a regular basis and until tumors reached ∼5 mm diameter (100 mm3). For the TMD8 xenograft model, once tumors were established, 9 mice were treated with pracinostat (100 mg/kg once per day by oral gavage, 5 days per week for 11 days), and 7 mice were treated with vehicle only using the aforementioned schedule. For the U2932 xenograft model, once tumors were established, 6 mice were treated with pracinostat (100 mg/kg once per day by oral gavage, 5 days per week for 22 days), and 10 mice were treated with vehicle alone. Subcutaneous tumor size was measured 3 times per week with a caliper, and tumor volume was calculated using the formula V = W2 × L × 0.5, where W is tumor width and L is tumor length. Differences in tumor volumes were calculated by using a two-sided Student t test, and the P value for significance was < .05.
Western blotting
Cells were treated with 250 nM pracinostat for 6 or 72 hours. Protein extractions, sodium dodecyl sulfate-polyacrylamide gel electrophoresis, and immunoblotting were performed as previously described.41 The following antibodies were from Cell Signaling (Danvers, MA): anti-acetyl-histone H2A (Lys5) (#2576), anti-histone H2A (#12349), anti-acetyl-histone H2B (Lys5) (#2574), histone H2B (#2934), anti-acetyl-histone H3 (Lys9/Lys14) (#9677), anti-histone H3 (#3638), anti-acetyl-histone H4 (Lys16) (#13534), anti-histone H4 (#2935), anti-acetyl-p53 (Lys382) (#2525), anti-p53 (#2527), anti-acetyl-STAT3 (Lys685) (#2523), and anti-STAT3 (#9139S). Anti-glyceraldehyde 3-phosphate dehydrogenase (GAPDH) was used as a loading control (FF26A/F9, CNIO, Spanish National Cancer Research Center, Madrid, Spain).
Cell cycle, apoptosis, and cell proliferation assays
Cell cycle and apoptosis analyses were performed by fluorescence-activated cell sorting. Cells were treated with an HDACi for the indicated times. For combination treatments with pracinostat and BSO, cells were pretreated with 100 µM vitamin E for 40 minutes before addition of pracinostat and BSO. For apoptosis analysis, cells were stained with annexin V and 7-aminoactinomycin D (7-AAD). For cell cycle analysis, cells were fixed in 70% cold ethanol before staining with 7-AAD. For the proliferation assay, cells were seeded at a density of 0.25 × 10⁶ cells per mL in 6-well plates and treated for 14 days with 250 nM pracinostat or dimethyl sulfoxide (DMSO) alone. Every 3 to 4 days, cells were counted and resuspended in fresh medium containing pracinostat or DMSO at a density of 0.25 × 10⁶ cells per mL. For each cell line, the percentage of live cells at days 3, 7, 10, and 14 was determined by dividing the pracinostat live cell number by the DMSO live cell number. Statistical tests were performed using a Student t test.
RNA sequencing
Total RNA was extracted using TRI reagent (Sigma) and processed for RNA sequencing (RNA-seq) (stranded, single-ended 75-bp-long sequencing reads) by using the NEBNext Ultra Directional RNA Library Prep Kit for Illumina (New England BioLabs, Ipswich, MA) on a NextSeq 500 System (Illumina, San Diego, CA) as previously described.39 Data mining was performed as previously described.43 Differentially expressed transcripts were selected by using the following criteria: Benjamini-Hochberg multiple test corrected P value and false discovery rate < .01 and logFC (fold-change) ≥1.0 (upregulated) or logFC ≤ −1.0 (downregulated). Functional annotation was performed using gene set enrichment analysis on FC preranked lists. The gene sets we used were from the MSigDB collection44 and from different publications,45 applying as threshold P < .05 and false discovery rate < 0.05. Expression data have been deposited in the National Center for Biotechnology Information’s Gene Expression Omnibus (GEO) under accession number GSE151612.
Results
Pracinostat shows in vitro and in vivo antiproliferation activity in lymphoma
To comprehensively evaluate the antiproliferation activity of pracinostat in lymphoma cells, we screened 60 cell lines derived from different histologic subtypes of lymphoma including B-cell and T-cell lymphomas (supplemental Table 1; supplemental Figure 1A). Pracinostat exhibited robust activity across all histologies, with a median 50% inhibitory concentration (IC50) of 243 nM (95% confidence interval, 171-324 nM). Average IC50 values were comparable across lymphoma subtypes (Table 1). We also assessed the antiproliferative activity of the US Food and Drug Administration (FDA)–approved pan-HDACi vorinostat, for which the median IC50 was 306 nM (95% confidence interval, 241-364 nM) (supplemental Tables 1 and 2). IC50 values for vorinostat strongly correlated with those of pracinostat (r = 0.84; P < .0001) (supplemental Figure 1B).
Median IC50 values for pracinostat in the different lymphoma histologies screened
| Histology | Median, nM | 95% CI | n |
|---|---|---|---|
| ABC-DLBCL | 173.8 | 104.1-434.6 | 8 |
| GCB-DLBCL | 232.4 | 116.5-459.2 | 17 |
| BCR-DLBCL | 170.7 | 76.3-523.9 | 8 |
| OxPhos-DLBCL | 865 | 514.4-1012.8 | 4 |
| MCL | 249.7 | 67.9-753.7 | 10 |
| MZL | 304.3 | 52.7-369.9 | 5 |
| CLL | 1148.3 | 639.1-1657.4 | 2 |
| PMBCL | 197.9 | N/A | 1 |
| CTCL | 317.6 | 134.6-370.3 | 3 |
| ALCL | 479.5 | 224-803.7 | 5 |
| PTCL-NOS | 339.9 | N/A | 1 |
| ATCL | 158.2 | N/A | 1 |
| HL | 298 | 158-509.5 | 4 |
| Canine DLBCL | 130.2 | N/A | 1 |
| Murine DLBCL | 231.9 | 166.6-297.1 | 2 |
For DLBCL, median IC50 values are shown for cell of origin (COO; ABC-DLBCL and GCB-DLBCL) and consensus clustering classification (CCC) subtypes (OxPhos-DLBCL and BCR-DLBCL).
ALCL, anaplastic large T-cell lymphoma; ATCL, angioimmunoblastic T-cell lymphoma; CI, confidence interval; CLL, chronic lymphocytic leukemia; MZL, marginal zone lymphoma; N/A, not available; PMBCL, primary mediastinal B-cell lymphoma; PTCL-NOS, peripheral T-cell lymphoma, not otherwise specified.
The in vivo activity of pracinostat was assessed in TMD8 and U2932 DLBCL cells. In vitro, TMD8 showed more than sixfold higher sensitivity to pracinostat than U2932. The responses of the TMD8 and U2932 xenografts to pracinostat closely mirrored the in vitro data; for the TMD8 model, administration of pracinostat significantly delayed tumor growth after 3 days of treatment, which persisted for the duration of the experiment (P < .05). In this model, tumors of mice treated with pracinostat were 30% smaller than tumors of control mice, indicating that pracinostat was effective at slowing tumor growth in vivo (Figure 1A). In the U2932 xenograft model (supplemental Figure 1C), pracinostat showed a trend only for reducing tumor growth (P = not significant).
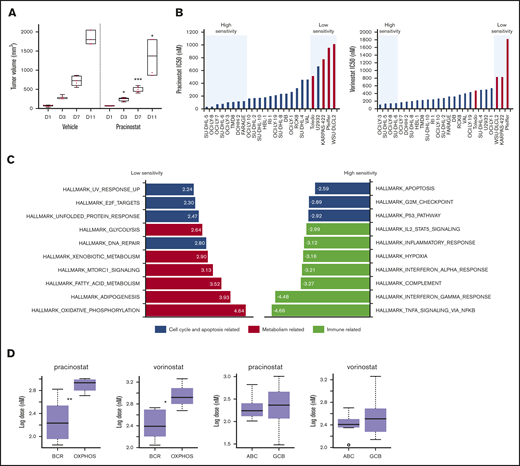
DLBCL subsets exhibit different sensitivities to pracinostat. (A) The in vivo activity of pracinostat was assessed in the TMD8 DLBCL xenograft model. Pracinostat significantly delayed tumor growth after 3 days of treatment. Boxplots represent tumor volumes (mm3) for vehicle- and pracinostat-treated mice. Midlines indicate the median, upper and lower perimeters indicate the 25th and 75th percentiles, and tails indicate minimum and maximum values. (B) Individual IC50 values for DLBCLs are shown. High-sensitivity (IC50 ≤ 0.5 × median IC50) and low-sensitivity (IC50 ≥ 2 × median IC50) DLBCLs are highlighted in the blue boxes. Red bars correspond to OxPhos-DLBCLs. (C) Functional annotation analysis to compare low-sensitivity (IC50 ≥ 2 × median IC50 for pracinostat) vs high-sensitivity (IC50 ≤ 0.5 × median IC50 for pracinostat) DLBCLs revealed an enrichment of fatty acid metabolism–related transcripts in low-sensitivity DLBCLs (left, red bars). High-sensitivity DLBCLs (right) were enriched for immune-related pathways (yellow bars). Cell cycle and apoptosis-related pathways (blue bars) were enriched in both low- and high-sensitivity DLBCLs. The top 10 enriched Hallmark gene sets (P < .05 and false discovery rate < .05) are shown for each sensitivity group. (D) Comparison of IC50 values for BCR-DLBCLs and OxPhos-DLBCLs showed that OxPhos-DLBCLs were significantly less sensitive to pracinostat and vorinostat than were BCR-DLBCLs. Comparison of ABC-DLBCLs and GCB-DLBCLs showed that these molecular subtypes exhibited similar sensitivities to HDACis. The midlines indicate the median, upper and lower perimeters indicate the 25th and 75th percentiles, and tails indicate minimum and maximum values. Two-sided Student t test: *P < .05; **P < .01; ***P < .001.
DLBCL subsets exhibit different sensitivities to pracinostat. (A) The in vivo activity of pracinostat was assessed in the TMD8 DLBCL xenograft model. Pracinostat significantly delayed tumor growth after 3 days of treatment. Boxplots represent tumor volumes (mm3) for vehicle- and pracinostat-treated mice. Midlines indicate the median, upper and lower perimeters indicate the 25th and 75th percentiles, and tails indicate minimum and maximum values. (B) Individual IC50 values for DLBCLs are shown. High-sensitivity (IC50 ≤ 0.5 × median IC50) and low-sensitivity (IC50 ≥ 2 × median IC50) DLBCLs are highlighted in the blue boxes. Red bars correspond to OxPhos-DLBCLs. (C) Functional annotation analysis to compare low-sensitivity (IC50 ≥ 2 × median IC50 for pracinostat) vs high-sensitivity (IC50 ≤ 0.5 × median IC50 for pracinostat) DLBCLs revealed an enrichment of fatty acid metabolism–related transcripts in low-sensitivity DLBCLs (left, red bars). High-sensitivity DLBCLs (right) were enriched for immune-related pathways (yellow bars). Cell cycle and apoptosis-related pathways (blue bars) were enriched in both low- and high-sensitivity DLBCLs. The top 10 enriched Hallmark gene sets (P < .05 and false discovery rate < .05) are shown for each sensitivity group. (D) Comparison of IC50 values for BCR-DLBCLs and OxPhos-DLBCLs showed that OxPhos-DLBCLs were significantly less sensitive to pracinostat and vorinostat than were BCR-DLBCLs. Comparison of ABC-DLBCLs and GCB-DLBCLs showed that these molecular subtypes exhibited similar sensitivities to HDACis. The midlines indicate the median, upper and lower perimeters indicate the 25th and 75th percentiles, and tails indicate minimum and maximum values. Two-sided Student t test: *P < .05; **P < .01; ***P < .001.
DLBCLs with an enrichment of oxidative phosphorylation transcripts have an inferior response to HDACi treatment
DLBCLs were the largest histologic subgroup in our screening and displayed IC50 values that largely reflected the trend seen across all the lymphoma histologies. Focusing on this lymphoma subset, we used in-house baseline gene expression profiling data45 to determine whether specific molecular signatures were associated with sensitivity to pracinostat. Comparison of low-sensitivity (IC50 ≥ 2 × median IC50) vs high-sensitivity (IC50 ≤ 0.5 × median IC50) DLBCL cells (Figure 1B) revealed an enrichment of fatty acid metabolism–related transcripts in low-sensitivity DLBCLs. High-sensitivity DLBCLs were enriched in immune-related pathways. Both low- and high-sensitivity DLBCLs showed an enrichment of cell cycle and apoptosis transcripts (Figure 1C). These signatures were similar in vorinostat-treated cells (supplemental Figure 1D) and so likely represented pathways associated with DLBCL response to pan-HDACis.
Low-sensitivity cell lines were highly enriched in the previously defined oxidative phosphorylation (OxPhos)-DLBCL subtype.46 High-sensitivity DLBCLs never included this subtype. Comparison of IC50 values of OxPhos-DLBCLs and B-cell receptor (BCR)-DLBCLs (which are defined by upregulated expression of BCR signaling genes and are not dependent on OxPhos for energy production) showed significantly higher IC50 values for OxPhos-DLBCLs (Figure 1D). We observed a similar lower sensitivity of OxPhos-DLBCLs when we looked at drug response data for 2 other HDACis that we had previously tested on a smaller panel of lymphoma cell lines,13 as well as public data sets of DLBCL response to various HDACis (supplemental Figure 1E-F).
The association between the OxPhos signature and reduced sensitivity to HDACis was not limited to DLBCLs. MCLs with low sensitivity to HDACis showed an enrichment of the OxPhos signature. Conversely, BCR signaling was enriched in MCLs with high sensitivity to HDACis (supplemental Figure 1G). For other B-cell lymphoma histologies included in our MTT screening panel, we were unable to determine the association between OxPhos or BCR pathways and response to HDACis because of small sample sizes.
Comparison of DLBCLs based on their cell of origin, which classifies DLBCLs according to their molecular similarities to normal germinal center B-cells (GCB-DLBCL) or activated B-cells (ABC-DLBCL),47 showed no differences in sensitivity to HDACis (Figure 1D). Of note, OxPhos-DLBCL cell lines comprise only GCB-DLBCLs, whereas BCR-DLBCLs comprise both GCB- and ABC-DLBCLs. We therefore compared OxPhos-DLBCLs with only BCR-DLBCLs that also classify as GCB-DLBCLs; OxPhos-DLBCLs maintained significantly higher IC50 values for pracinostat and vorinostat, further supporting their poorer sensitivity to HDACis (supplemental Figure 1H).
EZH2 and BCL2 aberrations associate with low-sensitivity DLBCLs
DLBCLs are characterized by recurrent genetic aberrations, and the most recent classification models have used the presence of these features to assign DLBCLs to specific subsets. We saw that EZH2 mutation and BCL2 translocation were significantly more prevalent in DLBCLs with poorer responses to pracinostat and vorinostat. These aberrations are both features of the C3 and EZB genetic subtypes48,49 (supplemental Figure 2). Thus, in addition to an OxPhos signature, aberrations affecting EZH2 and BCL2 were also characteristic of low-sensitivity DLBCLs. Mutated CREBBP and EP300, also features of the C3 and EZB subtypes, did not associate with response to HDACis and neither did MYC translocations (supplemental Figure 2).
Pracinostat inhibits DLBCL proliferation by inducing apoptosis and cell cycle arrest
To investigate the mechanisms of pracinostat-induced cytotoxicity, we exposed BCR- and OxPhos-DLBCLs to HDACi’s for 72 hours and assessed apoptosis induction. Marked apoptosis, defined as twofold or higher percentage of annexin V–positive cells in HDACi-treated cells compared with control cells, was observed in all BCR-DLBCLs after treatment with pracinostat (Figure 2A). For OxPhos-DLBCLs, apoptosis induction was observed in only 1 of the 4 cell lines (Toledo). Similar results were obtained for vorinostat (supplemental Figure 3A). Annexin V positivity was negatively correlated with IC50 values: r = −0.78 and P = .005 for pracinostat-treated cells and r = −0.90 and P = .006 for vorinostat-treated cells (supplemental Figure 3B), indicating that higher sensitivity to HDACis was associated with apoptosis induction in DLBCL cells. Cell cycle analyses showed marked sub-G1 accumulation in BCR-DLBCLs treated with HDACis, whereas OxPhos-DLBCLs showed G1 arrest and minor sub-G1 accumulation after treatment with pracinostat (Figure 2B) and vorinostat (supplemental Figure 3C).
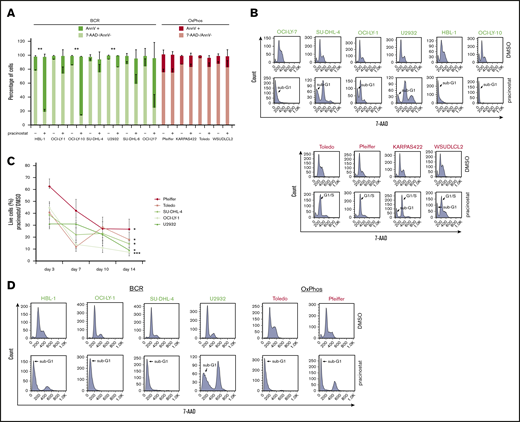
Pracinostat shows preferential cytotoxicity toward BCR-DLBCLs. (A) BCR-DLBCLs (green bars; n = 7) and OxPhos-DLBCLs (red bars; n = 4) were treated with 250 nM pracinostat for 72 hours before staining with annexin V (AnnV) and 7-aminoactinomycin D (7-AAD) for apoptosis analysis by fluorescence-activated cell sorting (FACS). The upper part of each bar represents the percentages of apoptotic, annexin V–positive cells (AnnV+), and the lower part represents the percentage of nonapoptotic, 7-AAD–negative/annexin V–negative (7-AAD–/AnnV–) cells. A subset of BCR-DLBCLs showed marked apoptosis induction after pracinostat treatment (4 of 7); for OxPhos-DLBCLs, the percentage of apoptotic cells was negligible. (B) Cells were treated with pracinostat as above in panel A, then fixed and stained with 7-AAD before cell cycle analysis by FACS. In agreement with the apoptosis assay, BCR-DLBCLs frequently showed marked accumulation in sub-G1. Conversely, OxPhos-DLBCLs were characterized by G1 arrest and minor sub-G1 accumulation. Top: BCR-DLBCLs; bottom: OxPhos-DLBCLs. (C) Cells were treated with 250 nM pracinostat or DMSO for 14 days, with cell count, medium change, and drug replenishment every 3 to 4 days. For each data point, the number of live cells for pracinostat was normalized to the number of live DMSO-treated cells. (D) BCR-DLBCLs and OxPhos-DLBCLs were treated with 250 nM pracinostat for 14 days before processing for cell cycle analysis by FACS. Experiments were performed at least twice. Error bars denote the standard error of the mean (SEM). Two-sided Student t test: *P < .05; **P < .01; ***P < .001.
Pracinostat shows preferential cytotoxicity toward BCR-DLBCLs. (A) BCR-DLBCLs (green bars; n = 7) and OxPhos-DLBCLs (red bars; n = 4) were treated with 250 nM pracinostat for 72 hours before staining with annexin V (AnnV) and 7-aminoactinomycin D (7-AAD) for apoptosis analysis by fluorescence-activated cell sorting (FACS). The upper part of each bar represents the percentages of apoptotic, annexin V–positive cells (AnnV+), and the lower part represents the percentage of nonapoptotic, 7-AAD–negative/annexin V–negative (7-AAD–/AnnV–) cells. A subset of BCR-DLBCLs showed marked apoptosis induction after pracinostat treatment (4 of 7); for OxPhos-DLBCLs, the percentage of apoptotic cells was negligible. (B) Cells were treated with pracinostat as above in panel A, then fixed and stained with 7-AAD before cell cycle analysis by FACS. In agreement with the apoptosis assay, BCR-DLBCLs frequently showed marked accumulation in sub-G1. Conversely, OxPhos-DLBCLs were characterized by G1 arrest and minor sub-G1 accumulation. Top: BCR-DLBCLs; bottom: OxPhos-DLBCLs. (C) Cells were treated with 250 nM pracinostat or DMSO for 14 days, with cell count, medium change, and drug replenishment every 3 to 4 days. For each data point, the number of live cells for pracinostat was normalized to the number of live DMSO-treated cells. (D) BCR-DLBCLs and OxPhos-DLBCLs were treated with 250 nM pracinostat for 14 days before processing for cell cycle analysis by FACS. Experiments were performed at least twice. Error bars denote the standard error of the mean (SEM). Two-sided Student t test: *P < .05; **P < .01; ***P < .001.
The cytotoxic and cytostatic effects of pracinostat were largely reversible because cells treated with pracinostat for 72 hours followed by drug washout showed little sub-G1 accumulation. Only HBL-1 and Toledo showed pronounced accumulation in sub-G1 after drug washout (supplemental Figure 3D). To determine the effects of prolonged exposure to HDACis, we treated OxPhos- and BCR-DLBCLs with pracinostat for 14 days (Figure 2C). Chronic treatment resulted in up to 93% reduced proliferation and increased sub-G1 accumulation in all cell lines, although BCR-DLBCLs showed greater inhibition of proliferation than OxPhos-DLBCLs (P = .009).
Pracinostat induces acetylation of core histones and nonhistone proteins
Pracinostat markedly induced acetylation of all 4 core histones (H2A, H2B, H3, and H4) at 6 hours and persisted at 72 hours, with no differences between BCR- and OxPhos-DLBCLs. Notably, at 72 hours, increased histone acetylation coincided with reduced levels of total histones H2A and H2B, suggesting increased modification of these histone pools to their acetylated forms. Histones H3 and H4 were not affected to the same extent (Figure 3; supplemental Figure 4A).

Pracinostat induces acetylation of core histones and nonhistone proteins. DLBCLs were treated with DMSO (–) or pracinostat (+) for 6 hours (A) or 72 hours (B) before protein extraction and western blotting analysis. For each panel, OxPhos-DLBCLs are to the left of the dashed line and BCR-DLBCLs are to the right. Pracinostat induced acetylation of core histones at both time points. Quantification of acetylated protein bands is shown on the right side of the immunoblots and was performed using ImageJ.
Pracinostat induces acetylation of core histones and nonhistone proteins. DLBCLs were treated with DMSO (–) or pracinostat (+) for 6 hours (A) or 72 hours (B) before protein extraction and western blotting analysis. For each panel, OxPhos-DLBCLs are to the left of the dashed line and BCR-DLBCLs are to the right. Pracinostat induced acetylation of core histones at both time points. Quantification of acetylated protein bands is shown on the right side of the immunoblots and was performed using ImageJ.
Of 4 BCR-DLBCLs treated with pracinostat, 2 (SU-DHL-4 and OCI-LY-1) showed a marginal increase in acetylated p53(Lys382) after 6 hours whereas for U2932, increased acetylation of p53(Lys382) was observed only after 72 hours of treatment. Our observation that p53 was acetylated in untreated cells was in agreement with p53 being mutated in the BCR-DLBCLs (supplemental Figure 2) and with the reported hyperacetylation of mutant p53 in cancer cells. Acetylated p53(Lys382) was not detected in either of the 2 OxPhos-DLBCLs exposed to pracinostat at either time point. Total and acetylated STAT3(Lys685) were variably expressed in both OxPhos- and BCR-DLBCLs. Expression of acetylated STAT3 mirrored that of total STAT3 with similar levels of acetylated STAT3 detected in DMSO- and pracinostat-treated cells. The BCR-DLBCL HBL-1, also an ABC-DLBCL according to the cell of origin classification, had the highest STAT3 levels, an observation in agreement with overexpression and constitutive activation of STAT3 in ABC-DLBCLs50,51 (Figure 3; supplemental Figure 4B).
Acute and chronic treatment of DLBCL cells with HDACis differentially modulates the DLBCL transcriptome
RNA-seq was performed on 3 OxPhos-DLBCLs (Pfeiffer, Toledo, WSU-DLCL2) and 3 BCR-DLBCLs (SU-DHL-4, SU-DHL-6, OCI-LY-1) treated for 6 hours and 14 days with DMSO or pracinostat. Acute 6-hour treatment resulted in similar numbers of up- and downregulated transcripts for OxPhos-DLBCLs (149 and 197, respectively), and BCR-DLBCLs (upregulated, 402; downregulated, 377). Chronic 14-day treatment almost quadrupled the number of upregulated transcripts in BCR-DLBCLs (n = 1489), whereas the number of downregulated transcripts remained unchanged (n = 368). Similar observations were made for OxPhos-DLBCLs that had more than double the number of upregulated genes after chronic treatment (n = 359), with no change in the number of downregulated genes (n = 198) (Figure 4A; supplemental Table 3). For both acute and chronic treatments, the number of modulated transcripts was always higher in BCR-DLBCLs, indicating a higher sensitivity than OxPhos-DLBCLs to HDACi-mediated modulation of their transcriptomes. Comparison of individual transcripts that were modulated at the 2 time points for either BCR-DLBCL or OxPhos-DLBCL showed little overlap, with less than 10% of transcripts commonly modulated at 6 hours or 14 days (Figure 4A). Similar results were obtained for DLBCLs treated with vorinostat (supplemental Figure 5A-B; supplemental Table 4).
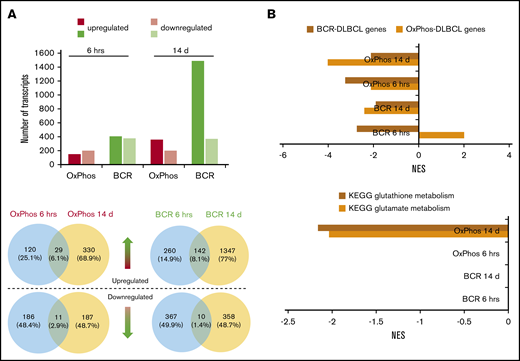
Transcriptomic profiling reveals differences in the modulation of gene expression after acute and chronic exposure of DLBCL subsets to HDACis. BCR-DLBCLs and OxPhos-DLBCLs were exposed to HDACis for 6 hours or 14 days before extraction of total RNA and RNA sequencing. (A) Top: the transcriptomes of OxPhos-DLBCLs were markedly less modulated by HDACi treatment than those of BCR-DLBCLs. Acute treatment produced similar numbers of up- and downregulated transcripts for each DLBCL subtype; chronic treatment resulted in a higher proportion of upregulated transcripts. Bottom: Venn diagrams show that for each DLBCL subtype, only a minor fraction of transcripts was commonly modulated at the 2 time points. Blue circles denote transcripts that are significantly modulated after 6 hours, yellow circles denote transcripts modulated after 14 days. Venn diagrams above the dashed line represent upregulated transcripts, and those below the line represent downregulated transcripts. (B) Top: gene set enrichment analysis (GSEA) showed that gene signatures for BCR-DLBCL and OxPhos-DLBCL molecular subtypes were significantly modulated in both DLBCL subsets by acute and chronic treatment with HDACis. Bottom: GSEA showed that processes required for the production of the antioxidant glutathione were modulated only in OxPhos-DLBCL treated with HDACi for 14 days (OxPhos 14 d). These processes were not modulated in OxPhos-DLBCLs and BCR-DLBCLs treated for 6 hours or in BCR-DLBCLs treated for 14 days (OxPhos 6 hrs, BCR 6 hrs, BCR 14 d, respectively). KEGG, Kyoto Encyclopedia of Genes and Genomes; NES, normalized enrichment score.
Transcriptomic profiling reveals differences in the modulation of gene expression after acute and chronic exposure of DLBCL subsets to HDACis. BCR-DLBCLs and OxPhos-DLBCLs were exposed to HDACis for 6 hours or 14 days before extraction of total RNA and RNA sequencing. (A) Top: the transcriptomes of OxPhos-DLBCLs were markedly less modulated by HDACi treatment than those of BCR-DLBCLs. Acute treatment produced similar numbers of up- and downregulated transcripts for each DLBCL subtype; chronic treatment resulted in a higher proportion of upregulated transcripts. Bottom: Venn diagrams show that for each DLBCL subtype, only a minor fraction of transcripts was commonly modulated at the 2 time points. Blue circles denote transcripts that are significantly modulated after 6 hours, yellow circles denote transcripts modulated after 14 days. Venn diagrams above the dashed line represent upregulated transcripts, and those below the line represent downregulated transcripts. (B) Top: gene set enrichment analysis (GSEA) showed that gene signatures for BCR-DLBCL and OxPhos-DLBCL molecular subtypes were significantly modulated in both DLBCL subsets by acute and chronic treatment with HDACis. Bottom: GSEA showed that processes required for the production of the antioxidant glutathione were modulated only in OxPhos-DLBCL treated with HDACi for 14 days (OxPhos 14 d). These processes were not modulated in OxPhos-DLBCLs and BCR-DLBCLs treated for 6 hours or in BCR-DLBCLs treated for 14 days (OxPhos 6 hrs, BCR 6 hrs, BCR 14 d, respectively). KEGG, Kyoto Encyclopedia of Genes and Genomes; NES, normalized enrichment score.
Antioxidant pathways are specifically attenuated by HDACis in OxPhos-DLBCLs
Functional annotation analysis revealed marked downregulation of cell cycle and DLBCL proliferation gene sets at 6 hours, with further repression at 14 days (supplemental Figure 5C). Transcripts defining the BCR-DLBCL phenotype were downregulated by acute treatment, and chronic treatment sustained this attenuation. Transcripts defining the OxPhos-DLBCL phenotype were also downregulated by acute and chronic exposure to HDACis with the exception of BCR-DLBCLs acutely treated with pracinostat in which the OxPhos-DLBCL gene set was positively regulated (Figure 4B; supplemental Figure 5D). In OxPhos-DLBCLs, glutamate metabolism and glutathione metabolism (enzymatic processes that generate glutathione [GSH], a major reactive oxygen species [ROS] scavenger) were unaffected at 6 hours, whereas chronic treatment significantly inhibited both processes. In BCR-DLBCLs, neither of these processes was modulated by HDACi treatment at either time point (Figure 4B; supplemental Figure 5D). The downregulation of antioxidant-generating pathways in chronically treated OxPhos-DLBCLs suggested a specific role for antioxidants in mediating OxPhos-DLBCL response to HDACis.
Inhibition of antioxidant production increases the sensitivity of OxPhos-DLBCLs to HDACi treatment
An important mechanism by which HDACis mediate cytotoxicity is through the generation of ROS.52 OxPhos-DLBCLs primarily rely on OxPhos for adenosine triphosphate production, leading to chronic ROS production.46,53 However, they are able to evade the toxicity of elevated ROS by increasing GSH production.53 We hypothesized that the lower sensitivity of OxPhos-DLBCLs to HDACi treatment could be a result of their inherent ability to efficiently detoxify ROS through elevated GSH levels. To test this, we targeted γ-glutamyl cysteine synthase (GCS), a crucial enzyme in GSH synthesis. We took advantage of BSO, a potent and selective chemical GCS inhibitor54 with good clinical tolerability.55,56 Pharmacologic inhibition of GCS was more toxic for OxPhos-DLBCLs than BCR-DLBCLs (Figure 5A).
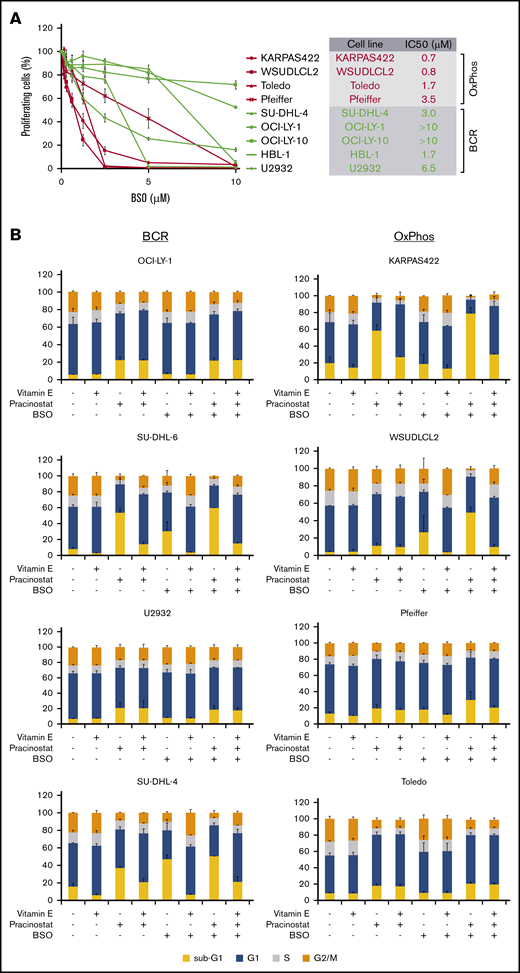
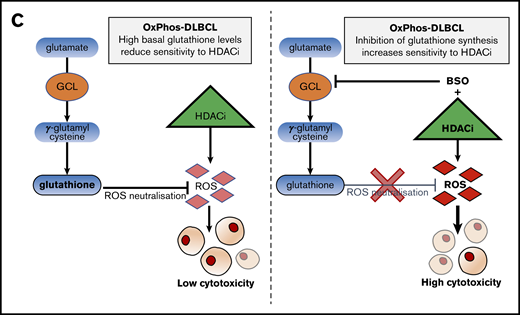
Inhibition of antioxidant production renders OxPhos-DLBCLs more sensitive to HDACi treatment. (A) Left: OxPhos-DLBCLs and BCR-DLBCLs were treated with increasing concentrations of BSO, a chemical inhibitor of glutathione production. OxPhos-DLBCLs (red lines) exhibited a greater vulnerability to BSO treatment than BCR-DLBCLs (green lines). Right: IC50 values for OxPhos-DLBCLs (red) and BCR-DLBCLs (green) treated with BSO. (B) Cell cycle analysis of DLBCLs treated with a combination of pracinostat (250 nM) and BSO (10 µM). For OxPhos-DLBCLs (right), dual treatment markedly augmented the sub-G1 fraction in comparison with single treatment with either drug alone. Preincubation with the antioxidant vitamin E (100 µM) rescued cells from the cytotoxicity of dual treatment. Dual treatment did not increase the sub-G1 fraction in BCR-DLBCLs (left). (C) Schema illustrating proposed mechanism of reduced OxPhos-DLBCL sensitivity to HDACi-induced cytotoxicity via upregulation of ROS. Left panel: intrinsically high glutathione production in OxPhos-DLBCLs41 neutralizes ROS produced by HDACi treatment, resulting in reduced OxPhos-DLBCL cell death. Right panel: BSO is a specific inhibitor of γ-glutamyl cysteine ligase (GCL), a crucial enzyme in glutathione synthesis. Dual treatment with BSO and HDACi increases OxPhos-DLBCL cell killing. The increased cytotoxicity of dual BSO-HDACi treatment can be blocked by pretreatment with the antioxidant vitamin E (not shown), reducing OxPhos-DLBCL cell death to the level seen when cells are treated with HDACi alone (as shown in left panel). Experiments were performed at least twice. Error bars denote standard deviation.
Inhibition of antioxidant production renders OxPhos-DLBCLs more sensitive to HDACi treatment. (A) Left: OxPhos-DLBCLs and BCR-DLBCLs were treated with increasing concentrations of BSO, a chemical inhibitor of glutathione production. OxPhos-DLBCLs (red lines) exhibited a greater vulnerability to BSO treatment than BCR-DLBCLs (green lines). Right: IC50 values for OxPhos-DLBCLs (red) and BCR-DLBCLs (green) treated with BSO. (B) Cell cycle analysis of DLBCLs treated with a combination of pracinostat (250 nM) and BSO (10 µM). For OxPhos-DLBCLs (right), dual treatment markedly augmented the sub-G1 fraction in comparison with single treatment with either drug alone. Preincubation with the antioxidant vitamin E (100 µM) rescued cells from the cytotoxicity of dual treatment. Dual treatment did not increase the sub-G1 fraction in BCR-DLBCLs (left). (C) Schema illustrating proposed mechanism of reduced OxPhos-DLBCL sensitivity to HDACi-induced cytotoxicity via upregulation of ROS. Left panel: intrinsically high glutathione production in OxPhos-DLBCLs41 neutralizes ROS produced by HDACi treatment, resulting in reduced OxPhos-DLBCL cell death. Right panel: BSO is a specific inhibitor of γ-glutamyl cysteine ligase (GCL), a crucial enzyme in glutathione synthesis. Dual treatment with BSO and HDACi increases OxPhos-DLBCL cell killing. The increased cytotoxicity of dual BSO-HDACi treatment can be blocked by pretreatment with the antioxidant vitamin E (not shown), reducing OxPhos-DLBCL cell death to the level seen when cells are treated with HDACi alone (as shown in left panel). Experiments were performed at least twice. Error bars denote standard deviation.
We then treated cells with pracinostat and BSO to see whether inhibition of antioxidant synthesis would affect the sensitivity of DLBCLs to HDACis. Dual treatment was more cytotoxic for OxPhos-DLBCLs than treatment with either drug alone. The only exception was the OxPhos-DLBCL Toledo that showed similar sub-G1 accumulation for single and combined treatments. For BCR-DLBCLs, the dual treatment did not increase cell death more than single-agent treatment (Figure 5B). Pretreatment with the lipid-soluble antioxidant vitamin E rescued the viability of OxPhos-DLBCLs exposed to BSO alone or HDACi’s plus BSO, but it did not alter the viability of OxPhos-DLBCLs treated with HDACi’s alone, with the exception of KARPAS422. BCR-DLBCLs exhibited a heterogeneous response to vitamin E pretreatment. For 2 cell lines (SU-DHL-6 and SU-DHL-4), vitamin E conferred protection from exposure to all single and combination treatments. For the other 2 BCR-DLBCLs, sub-G1 accumulation was not diminished by vitamin E. Collectively, these results indicated a critical role for antioxidants in providing some protection from the cytotoxic effects of HDACi-induced ROS in OxPhos-DLBCLs (Figure 5C).
Combination of pracinostat with other antilymphoma agents enhances its antiproliferative activity
Finally, to further characterize the preclinical activity of pracinostat, we sought to identify effective combination partners. We exposed 4 DLBCL cell lines to increasing concentrations of pracinostat plus 10 antilymphoma agents. Combinations were mostly synergistic and in particular, the addition of the BCL2 inhibitor venetoclax, the BTK inhibitor ibrutinib, and the immunomodulatory agent lenalidomide were synergistic in all the cell lines tested (supplemental Table 5). Notably, of the 6 drugs showing synergism with pracinostat in at least 3 of the 4 cell lines tested, 4 (ibrutinib, lenalidomide, idelalisib, and rituximab) were among the top 100 drugs whose effects on the transcriptome significantly overlapped those of pracinostat (supplemental Table 6).
Discussion
We characterized the activity of the pan-HDACi pracinostat in a panel of 60 lymphoma cell lines comprising 25 DLBCLs and 6 other histologic subtypes of lymphoma. Pracinostat showed robust antiproliferative activity across all lymphoma subtypes, with IC50 values that were clinically achievable25 and compared favorably with those of the FDA-approved HDACi vorinostat. Focusing on DLBCL, we sought to characterize the molecular features associated with sensitivity to pracinostat. The pathways enriched in high- and low-sensitivity DLBCLs overlapped with processes previously identified46 as enriched in defined molecular subtypes of DLBCL with specific metabolic dependencies. Several studies have shown that these metabolic subtypes of DLBCL, termed OxPhos-DLBCL and BCR-DLBCL, exhibit different sensitivities to agents that specifically target the BCR signaling cascade and/or the mitochondrial translation pathway.57-59 In our study, low-sensitivity DLBCLs consisted almost exclusively of OxPhos-DLBCLs, indicating that this subtype is poorly responsive to HDACis. Analysis of DLBCLs treated with other pan-HDACis indicated a similar trend.
The cumulative nature of epigenetic regulation indicates that epigenetic drugs are likely to fully accomplish their effects at prolonged time points. Indeed 14-day treatment significantly enhanced the cytotoxicity of pracinostat compared with 72-hour treatment. OxPhos-DLBCLs, which were prone to G1 arrest after 72 hours, exhibited pronounced cell death after 14 days of treatment.
We did not observe differences in the acetylation levels of core histones in the 2 DLBCL subtypes. However, it is possible that other properties of acetylated histones not addressed in this study, including their genome-wide distribution, differ between HDACi-treated OxPhos-DLBCLs and BCR-DLBCLs, and this would be worthy of further investigation. p53 was expressed at varying levels in BCR-DLBCLs but was detected in only 1 OxPhos-DLBCL. The apparent association of p53 expression with sensitivity to HDACis was intriguing because wild-type p53 and individual p53 mutants have been shown to play distinct roles in metabolic regulation by promoting glycolysis or OxPhos in a context-dependent manner.60-63 It is therefore possible that the presence of p53 in BCR-DLBCLs contributes to skewing them more toward glycolysis, which we have shown to be associated with increased sensitivity to HDACis.
Transcriptome profiling showed that OxPhos-DLBCLs had a markedly lower number of modulated transcripts than BCR-DLBCLs after 6 hours or 14 days of HDACi treatment. Chronic treatment increased the number of upregulated transcripts for both subtypes, and multiple pathways and processes important for tumor cell survival and proliferation were exclusively modulated or more strongly modulated after chronic treatment. Gene sets defining BCR-DLBCLs and OxPhos-DLBCLs were downregulated in both DLBCL subsets at both time points with the exception of the OxPhos-DLBCL gene set, which was upregulated in BCR-DLBCLs acutely treated with pracinostat. Although it is counterintuitive, this observation is in agreement with previous reports showing that interference with BCR signaling via acute knockdown of SYK in BCR-DLBCLs increases mitochondrial fatty acid oxidation.53
ROS activation is a major mechanism of HDACi-mediated cytotoxicity.1 OxPhos-DLBCLs preferentially rely on OxPhos to meet their energy needs, and a by-product of this process is ROS accumulation, which is effectively quenched by increased production of glutathione.41 Metabolic pathways involved in glutathione synthesis were downregulated solely in OxPhos-DLBCLs and only after 14 days of HDACi treatment, suggesting that increased cell death after chronic treatment of OxPhos-DLBCLs could be partly a result of reduced antioxidant production. In OxPhos-DLBCLs, the combination of pracinostat with the GCS inhibitor BSO, a drug that can safely be given to patients,55,56 resulted in enhanced cell killing compared with either agent alone; on the contrary, BCR-DLBCLs showed minor or no benefit at all from the combination. This suggested that blocking the intrinsic antioxidant mechanism of protection of OxPhos-DLBCLs rendered these cells more sensitive to the cytotoxic effects of HDACis. Providing further support for this, pretreatment with vitamin E, an antioxidant not targeted by BSO, protected cells from combination treatment and restored OxPhos-DLBCL cell viability. OxPhos and an elevated antioxidant program are also features of other tumor types,64-67 in which the combined use of BSO and HDACis could represent an effective strategy to overcome intrinsic antioxidant mechanisms.
HDACis are often used in combination with other drugs to enhance efficacy.1,12,14-16,21 Pracinostat showed beneficial combination with all of the 10 additional agents we studied in at least 2 of the 4 DLBCL cell lines tested. The agent that combined most efficaciously with pracinostat was the BCL2 inhibitor venetoclax. Of interest, venetoclax has been shown to trigger ROS production in lymphoma cells, and this might contribute to its synergistic effect with pracinostat.64,65 The combination with the demethylating agent 5-azacitidine, clinically explored in patients with AML or myelodysplastic syndrome,34-37 showed benefit in 2 of 4 DLBCLs, suggesting it might also be effective for some DLBCLs. It is possible that the use of BSO in the context of these combination strategies could further enhance the killing of tumor cells.
Of interest, OxPhos-DLBCLs and BCR-DLBCLs harbor specific genetic features common to recently defined molecular subtypes of DLBCL. Some BCR-DLBCLs harbor BCL2 translocations (SU-DHL-4, SU-DHL-6, and OCI-LY-1) or BCL2 amplification (HBL-1), which are prominent molecular features of the recently described C3 and C5 DLBCL molecular subtypes, respectively.68 Of the OxPhos-DLBCLs, KARPAS422 exhibits features of the C3 subtype. Hence, therapeutic vulnerabilities identified for C3 and C5 subtypes might be useful for identifying agents that combine efficaciously with pracinostat in DLBCL. Venetoclax and the PI3K inhibitor copanlisib are efficacious as single agents and in combination with each other in C3 and C5 DLBCLs,68 and in our study, we observed synergism when either of these agents was combined with pracinostat.
In conclusion, our study identified a previously unrecognized association between metabolic subtypes of DLBCL and response to HDACi treatment. Through pharmacologic blockade of glutathione synthesis using BSO, we showed that inhibition of antioxidant production in OxPhos-DLBCLs partially overcame HDACi resistance. Our study provides novel insights into the preclinical antilymphoma activity of the pan-HDACi pracinostat, including the identification of effective combination partners for this HDACi. These findings can be clinically exploited and are potentially applicable to other tumor types with dependencies on antioxidant pathways.
Expression data have been deposited in the National Center for Biotechnology Information’s Gene Expression Omnibus database (accession number GSE151612).
Acknowledgment
This work was partially supported by institutional research funding from Helsinn Healthcare.
Authorship
Contribution: A.A.M. formed the hypotheses, supervised the project, designed and performed the experiments, analyzed the data, and wrote the manuscript; F.S., G.S., V.P., E.G., C.T., and E.C. performed experiments and analyzed data; L.C. performed bioinformatic analyses; L.A., G.D., E.L., and C.P. provided critical reagents and contributed useful suggestions; A.R. performed RNA sequencing; E.Z. and A.S. contributed useful discussions and suggestions; and F.B. formed the hypotheses, directed and coordinated the project, designed the experiments, analyzed the data, and wrote the manuscript.
Conflict-of-interest disclosure: E.L. is employed by Helsinn Healthcare. C.P. is a past employee of Helsinn Healthcare. E.Z. received institutional research funding from Celgene, Roche, and Janssen, advisory board fees from Celgene, Roche, Mei Pharma, AstraZeneca, and Celltrion Healthcare, and travel grants from AbbVie and Gilead, and provided expert statements to Gilead, Bristol Myers Squibb, and MSD. A.S. received institutional research funds from Bayer, ImmunoGen, Merck, Pfizer, Novartis, Roche, MEI Pharma, and ADC Therapeutics, and travel grants from AbbVie and PharmaMar. F.B. received institutional research funding from Acerta, ADC Therapeutics, Bayer AG, Cellestia, CTI Life Sciences, EMD Serono, Helsinn Healthcare, ImmunoGen, Menarini Ricerche, NEOMED Therapeutics 1, Nordic Nanovector ASA, Oncology Therapeutic Development, and PIQUR Therapeutics AG, and consultant fees from Helsinn Healthcare and Menarini Ricerche, provided expert statements to HTG, and received travel grants from Amgen, Astra Zeneca, Jazz Pharmaceuticals, and PIQUR Therapeutics AG. The remaining authors declare no competing financial interests.
Correspondence: Francesco Bertoni, Institute of Oncology Research, Faculty of Biomedical Sciences, Università della Svizzera Italiana, Via Vincenzo Vela 6, 6500 Bellinzona, Switzerland; e-mail: frbertoni@mac.com.

