

Key Points
Bleeding severity in patients with RBDs is more pronounced than previously anticipated.
Previously determined threshold factor activity levels to ensure no (spontaneous) bleeding in patients with an RBD are inaccurate.

Abstract
Patients with hereditary rare bleeding disorders (RBDs) present with diverse hemorrhagic symptoms. Correlation between factor activity levels and clinical bleeding severity is poor for most RBDs. Threshold factor activity levels have been previously described in relation to bleeding severity but have not yet been validated. The Rare Bleeding Disorders in the Netherlands (RBiN) study is a nationwide cross-sectional study of patients registered in all 6 Dutch Haemophilia Treatment Centers with a known RBD and who are age 1 to 99 years. Bleeding scores were determined, and laboratory and clinical data were extracted from patient files. In all, 263 patients were included, of whom 202 (77%) attended the scheduled study visit. The median International Society of Thrombosis and Haemostasis (ISTH) bleeding assessment tool (BAT) score was 9. Correlations between baseline factor activity levels and ISTH BAT scores were strong for deficiencies in factor II (FII) (r = –0.792) and FX (r = –0.838) and were moderate for deficiencies of fibrinogen (r = –0.683), FV (r = –0.623), FVII (r = –0.516), FXIII (r = –0.516), and α2-antiplasmin (r = –0.594). There was no correlation for FXI deficiency (r = –0.218). The RBD BAT identified more women (94% vs 83%) and children (100% vs 71%) with an RBD than the ISTH BAT did. Importantly, 48% of patients had more severe bleeding than predicted for their baseline factor activity level. In addition, 34% of patients were predicted to be asymptomatic, but they actually had grade 2 (31%) or 3 (3%) bleeding. Bleeding severity in patients with RBDs is more pronounced than previously anticipated. The previously determined threshold factor activity levels to ensure no (spontaneous) bleeding in patients with an RBD are inaccurate. This trial was registered at www.clinicaltrials.gov as #NCT03347591.
Introduction
Rare bleeding disorders (RBDs) refer to hereditary deficiencies of fibrinogen, prothrombin (factor II [FII]), FV, FVII, FVIII, FX, FXI, and FXIII as well as disorders of fibrinolysis. RBDs are generally inherited as autosomal recessive disorders, except for dysfibrinogenemia and some cases of FXI deficiency, which can be autosomal dominant. The prevalence of RBDs for homozygosity or compound heterozygosity varies from 1:500 000 to 1:2 000 000.1 They are significantly more prevalent in population groups with a high rate of consanguinity.1,2
The clinical presentation of RBDs is diverse, ranging from asymptomatic to severe spontaneous bleeding.3 The reported correlation between the factor activity level and degree of bleeding varies from strong and predictable (for deficiencies of fibrinogen, FV+FVIII, FX, and FXIII) to no correlation for FXI deficiency as reported in a multicenter cohort study (EN-RBD) among 489 patients.4 Overall, life-threatening bleeding episodes such as cerebral bleeding and spontaneous hemorrhages in muscles and joints seem to occur less frequently when compared with hemophilia.2 However, the large variability between the individual RBDs makes it impossible to consider these disorders only as a group.
Hemorrhagic disorders of fibrinolysis mainly consist of plasminogen activator inhibitor type 1 (PAI-1) deficiency and α2-antiplasmin (α2-AP) deficiency. The bleeding phenotype of patients with fibrinolytic disorders is characterized by delayed bleeding after trauma, surgery, and dental procedures.5 Bleeding in areas of high fibrinolytic activity is also common, such as menorrhagia and epistaxis.5 Another category of RBDs is FV Amsterdam. This bleeding disorder is caused by a pathogenic gain-of-function variant in the FV gene leading to an aberrant FV that binds tissue factor pathway inhibitor (TFPI), prolonging the half-life and concentration of TFPI, which results in severely reduced thrombin generation and a bleeding tendency.6
Peyvandi et al4 described the minimal factor levels needed to remain asymptomatic for RBDs, showing a large variety between different coagulation factor deficiencies. Although heterozygous patients are usually not considered to have a bleeding disorder, factor activity levels that are needed to remain symptomatic vary from 12 IU/dL for FV deficiency up to 56 IU/dL for FX deficiency. These threshold levels are now often used in clinical practice; however, they have not been validated in a separate patient population.7
Bleeding assessment tools (BATs) have been used since 1982 for the quantification of a bleeding tendency.8 Since then, several BATs were developed for the assessment and quantification of bleeding symptoms and diagnosis of bleeding disorders, including the International Society of Thrombosis and Haemostasis (ISTH) BAT in 2010.9-11 However, these BATs originally focused on patients with von Willebrand disease (VWD). The ISTH BAT score has also been validated in carriers of hemophilia, but few RBD patients have been evaluated with these tools.12 In addition, BATs are known to be of limited diagnostic value for patients with mild bleeding disorders.13 In 2016, Palla et al14 published a novel BAT score for patients with RBDs. The most important differences between the ISTH BAT and the RBD BAT are (1) the RBD BAT has separated the individual surgical items as tonsillectomy, minor surgery, and major surgery instead of categorizing these as one item, (2) the RBD BAT includes subtraction points in case there is no bleeding after hemostatic challenges, and (3) the calculation of the score in the RBD BAT corrects for sex and age and uses subtraction points for specific hemostatic items. The RBD BAT score is a potentially interesting diagnostic tool, but it has not yet been validated in a separate RBD patient cohort.
Given the low prevalence of RBDs, systemically collected data on these disorders are scarce.15 Over the past few years, several registries in Europe and the United States have been developed for patients with an RBD.16,17 However, data derived from registries is still limited and is mostly absent for disorders of fibrinolysis.
The aims of this study are to describe the Dutch RBD patient population for the first time and to determine the usability of the ISTH BAT and RBD BAT for this patient population. In addition, we aim to validate the previously determined threshold factor activity levels. Because the Dutch patient population was not included in the EN-RBD study, this study can be used to validate the results from the EN-RBD study in a separate RBD cohort.4,14
Materials and methods
Patient recruitment
A nationwide cross-sectional study was conducted among patients with a hereditary RBD in The Netherlands: the Rare Bleeding Disorders in the Netherlands (RBiN) study. All known patients with an RBD in a Dutch hemophilia treatment center (HTC), including those with fibrinolytic disorders, were invited to participate in this study. Patients were recruited from all 6 Dutch HTCs: Expertise Center for Hemophilia and Related Disorders (Leiden University Medical Centre and HAGA Hospital, The Hague), Haemophilia Treatment Center Nijmegen-Eindhoven-Maastricht (HTC NEM: Radboud University Medical Centre, Maxima Medical Centre, and Maastricht University Medical Center), Amsterdam University Medical Centers, University Medical Centre Groningen, van Creveldkliniek (University Medical Centre Utrecht), and Erasmus Medical Centre Rotterdam. Patients were included from October 2017 to November 2019. This study was approved by the Medical Ethical Committee of Arnhem-Nijmegen. All patients (and/or parents in the case of minors) provided written informed consent in accordance with the Declaration of Helsinki.
Patient inclusion
This study included patients age 1 year or older. Patients with a congenital coagulation factor deficiency were invited to participate if the specific coagulation factor activity level was below the lower limit of normal, or if there was a proven pathogenic heterozygous, compound heterozygous, or homozygous variant in the gene encoding for an RBD factor deficiency. Patients were diagnosed because of a bleeding tendency, family investigation, or abnormal laboratory values upon screening (eg, before surgery). HTC NEM is the only Dutch HTC that tests for PAI-1 deficiency and hyperfibrinolysis. To avoid overdiagnosis and false-positive results, laboratory tests for diagnosing a PAI-1 deficiency or hyperfibrinolysis are performed only in case of an ISTH BAT score ≥10, a positive family history of a fibrinolysis disorder, or in patients with a typical fibrinolytic bleeding pattern (ie, delayed bleeding after interventions and/or co-occurrence with obstetric failure).5,18 Patients with a PAI-1 deficiency were eligible for inclusion if the PAI-1 activity level was below the detection limit and the PAI-1 antigen level was below the lower limit of normal (reference range, 3.4-39 ng/mL). Patients with hyperfibrinolysis were eligible if the euglobulin clot lysis time ratio before and after application of a tourniquet was ≥5.8 (reference range, 1.2-5.7, locally validated assay).
Assessment methods
Participating patients were asked to come to their HTC for a study visit, during which the ISTH BAT and RBD BAT were conducted and blood was drawn for laboratory testing.10,14 The number of patients identified by the ISTH BAT and RBD BAT for the individual coagulation factor deficiency was calculated by dividing the number of patients with a positive score on the specific BAT by the number of included patients for the total group and for children, women, and men separately. The cutoff value for a positive or abnormal ISTH BAT score was ≥4 in adult men, ≥6 in adult women, and ≥3 in children.10,19 The cutoff value for a positive or abnormal RBD BAT was ≥1.5 for men, women, and children.14 All participating patients were interviewed about their clinical symptoms by 1 investigator (J.L.S.) to conduct the BATs and to avoid inconsistencies. Patients were divided into clinical bleeding severity categories (asymptomatic and grade 1, 2, or 3 bleeding) based on previous research on RBD patients by Peyvandi et al4 in the EN-RBD study. This bleeding severity scale uses the most severe bleeding a patient has ever had. Category I refers to provoked bleeding episodes, category II refers to spontaneous minor bleeding episodes (eg, bruising), and category III refers to spontaneous major bleeding episodes (eg, cerebral bleeds or hemarthrosis). To determine whether the threshold levels to remain asymptomatic or free from grade 1, 2, or 3 bleeding are correct and may be used in clinical practice, patients were classified as “correct” if they had no more severe bleeding than expected considering their baseline factor activity level. If they experienced more severe bleeding than predicted, they were classified as “incorrect.” Data regarding the patients’ medical history, baseline factor activity levels, treatment plan, and use of other medications were extracted from electronic patient files. Factor measurements were performed locally using 1-stage clotting assay. In addition, participants were asked to complete an extensive self-administered questionnaire that contained questions on their bleeding disorder, quality of life, and social aspects. The results of laboratory measurements in the central laboratory and the results of the questionnaires will be analyzed separately.
Statistical analysis
Statistical analysis was performed using IBM SPSS Statistics 25. Values are reported as medians with interquartile range (IQR). Pearson’s correlation was used to correlate the ISTH BAT scores with the RBD BAT scores and to correlate the ISTH BAT with baseline factor activity levels. The strength of the correlations was described by using the following classification: no correlation (0-0.29), weak correlation (0.30-0.59), moderate correlation (0.50-0.69), strong correlation (0.70-0.89), or very strong correlation (0.90-1.0). McNemar’s test was used to compare the percentage of patients identified by the ISTH BAT and the RBD BAT. A 2-sided P < .05 was considered statistically significant.
Results
Patients
A total of 263 patients were included from October 2017 to November 2019. Patient characteristics are provided in Table 1. The median age at time of inclusion was 38.5 years (range, 1-87 years). Overall, 49% of included patients were adult women, 29% were adult men, and 22% were children between age 1 and 18 years. Bleeding scores were available for 202 patients (77%). The genotype was known in 26% of patients. All patients with factor activity levels in the normal range had genetically confirmed heterozygous pathogenic variants. Disorders of fibrinolysis were relatively common, accounting for 21% of included patients. Eight percent of patients were receiving prophylactic treatment, mainly those with an FXIII deficiency or fibrinogen deficiency.
Baseline characteristics of the RBiN study population
| RBD deficiency | All patients | Women | Men | Children | Median age (range), y | Median coagulation factor level (range) | Patients receiving prophylaxis | Patients with known genotype |
|---|---|---|---|---|---|---|---|---|
| Fibrinogen | 41 (16) | 22 (54) | 11 (27) | 8 (20) | 38 (4-87) | 700 mg/L (0-3180 mg/L) | 5 (13) | 21 (51) |
| FII | 16 (6) | 7 (44) | 6 (38) | 3 (19) | 37 (10-77) | 53% (0%-66%) | 0 (0) | 5 (31) |
| FV | 25 (10) | 11 (44) | 8 (32) | 6 (24) | 36 (2-73) | 35% (0%-60%) | 1 (4) | 4 (16) |
| FV Amsterdam | 2 (1) | 1 (50) | 1 (50) | 0 | 47.5 (31-64) | 283% (271%-295%) | 0 (0) | 2 (100) |
| FV + FVIII | 6 (2) | 1 (17) | 1 (17) | 4 (67) | 11 (1-35) | 10% (2%-24%) | 0 (0) | 5 (83) |
| FVII | 57 (22) | 21 (37) | 19 (33) | 17 (30) | 32 (2-82) | 30% (0%-61%) | 2 (4) | 6 (11) |
| FX | 8 (3) | 5 (63) | 1 (13) | 2 (25) | 29 (11-58) | 33% (0%-55%) | 1 (14) | 2 (25) |
| FXI | 43 (16) | 22 (51) | 11 (26) | 10 (23) | 41 (2-84) | 35% (0%-58%) | 0 (0) | 4 (9) |
| FXIII | 14 (5) | 2 (14) | 8 (57) | 4 (29) | 31.5 (5-60) | 0% (0%-82%) | 12 (86) | 10 (71) |
| α2-AP | 23 (9) | 13 (57) | 6 (26) | 4 (17) | 50 (6-76) | 61% (0%-82%) | 0 (0) | 5 (21) |
| PAI-1 | 14 (5) | 14 (100) | 0 (0) | 0 (0) | 45 (20-60) | 2.5 ng/mL (1.5-3.2 ng/mL) | 0 (0) | 0 (0) |
| Hyperfibrinolysis | 14 (5) | 12 (86) | 2 (14) | 0 (0) | 49.5 (22-75) | 8.6% (5.8%-12.7%) | 0 (0) | 0 (0) |
| Total | 263 | 131 (50) | 74 (28) | 58 (22) | 38.5 (1-87) | NA | 21 (8) | 69 (26) |
All data are n (%), unless otherwise stated. The columns for women and men show the number of patients aged 18 years or older, and the column for children shows patients younger than 18 years old. For patients with FV Amsterdam, the reported value in the column for coagulation factor activity level is the TFPI level. For patients with hyperfibrinolysis, the reported value in the column for coagulation factor level is the euglobulin clot lysis time ratio.
NA, not applicable.
ISTH BAT bleeding scores
The overall median ISTH BAT score for the total group (n = 202) was 9 (IQR, 5-15). The median ISTH BAT score for adult female patients was 11 (IQR, 6.5-15.5), and for pediatric patients, the median score was 5 (IQR, 1-7). The individual ISTH BAT scores per RBD are shown in Figure 1. There were large differences in the BAT scores for each RBD. The highest median scores were seen in patients with FV and FXIII deficiencies. Because scores were available for only 2 patients with FV Amsterdam (16 and 19), they are not shown in Figure 1. The presence of specific bleeding symptoms in the ISTH BAT score per RBD are shown in Figure 2. The number of patients with each symptom for the separate RBDs is shown in supplemental Table 1. A symptom was scored as present if the patient had a score of 1 or more on the ISTH BAT for this item. Overall, the most common symptom was menorrhagia, occurring in 77% of all included women age 14 years or older (n = 119). All female patients with PAI-1 deficiency (n = 12), hyperfibrinolysis (n = 13), FXIII deficiency (n = 2), or combined FV+VIII deficiency (n = 1) had menorrhagia. Other prevalent symptoms were bleeding after surgery (76%), bleeding after tooth extractions (65%), and postpartum hemorrhage (51%). The least common symptoms were gastrointestinal bleeding (7%) and cerebral bleeding (7%), the latter mainly occurring in patients with either an FXIII deficiency (42%) or an FII deficiency (15%). Muscle hematomas and hemarthrosis were also seen less often, except in patients with an FXIII deficiency (58% and 50%, respectively).
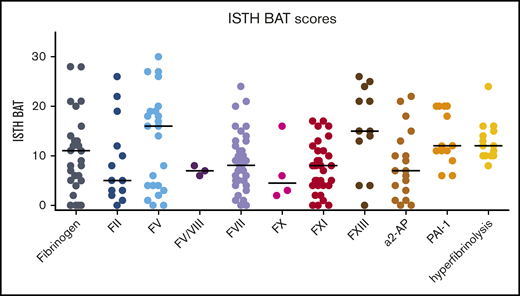
ISTH BAT scores of patients included in the RBiN study. Black horizontal lines are medians.
ISTH BAT scores of patients included in the RBiN study. Black horizontal lines are medians.
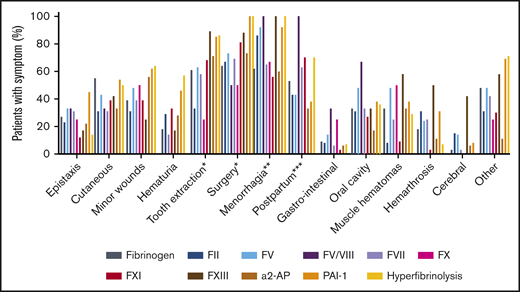
Percentage of patients with different types of bleeding symptoms. A symptom was scored as being present if the patient had an ISTH BAT score on that item of ≥1. *Patients who underwent a tooth extraction or surgery; **adult female patients; ***female patients who underwent labor.
Percentage of patients with different types of bleeding symptoms. A symptom was scored as being present if the patient had an ISTH BAT score on that item of ≥1. *Patients who underwent a tooth extraction or surgery; **adult female patients; ***female patients who underwent labor.
Correlation between baseline coagulation factor activity level and ISTH BAT score
Figure 3 shows the correlation between baseline coagulation factor activity levels and the ISTH BAT score for each RBD. A strong correlation between baseline coagulation factor activity level and the ISTH BAT score was found for FII deficiency (r = –0.792; P = .001) and FX deficiency (r = –0.838; P = .162). A moderate correlation was found for fibrinogen deficiency (r = –0.583; P = .001), FV deficiency (r = –0.697; P < .001), FVII deficiency (r = –0.515; P < .01), FXIII deficiency (r = –0.516; P = .086), and α2-AP deficiency (r = –0.592; P = .01). There was no correlation for FXI deficiency (r = –0.218; P = .238). PAI-1 deficiency and hyperfibrinolysis were not quantifiable, so correlations could not be made for these disorders.
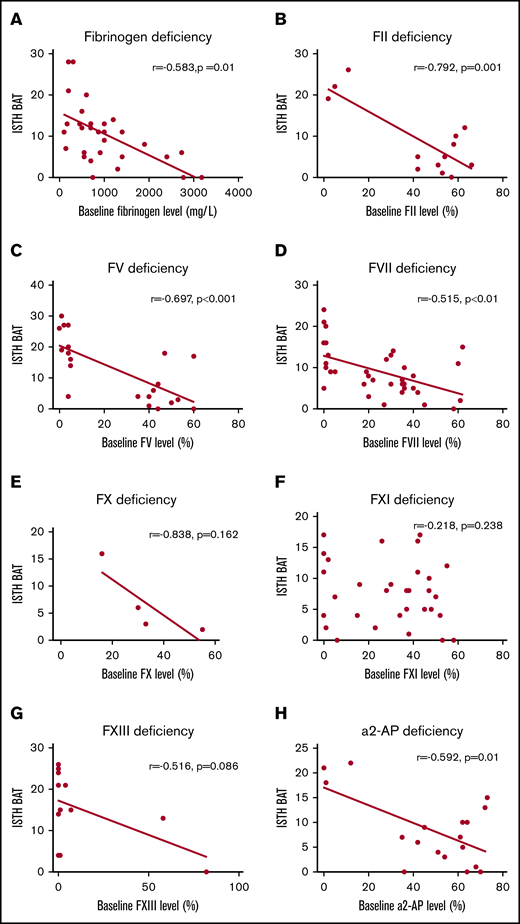
Correlation between baseline factor activity levels and ISTH BAT scores with linear regression lines. Panels show deficiencies in fibrinogen (A), FII (B), FV (C), FVII (D), FX (E), FXI (F), FXIII (G), and α2-AP (H).
Correlation between baseline factor activity levels and ISTH BAT scores with linear regression lines. Panels show deficiencies in fibrinogen (A), FII (B), FV (C), FVII (D), FX (E), FXI (F), FXIII (G), and α2-AP (H).
RBD BAT bleeding scores
The median RBD BAT score for the total group (n = 202) was 3.36 (IQR, 2.00-4.895), for adult female patients, 3.98 (IQR, 2.60-5.265), and for pediatric patients, 3.30 (IQR, 2.79-4.10). The individual RBD BAT scores per RBD are shown in supplemental Figure 1. Figure 4A shows the correlation between the ISTH BAT and RBD BAT scores. There was a correlation of 0.692 between the 2 BATs (P < .001). The sensitivities for both bleeding scores are shown in Figure 4B for the entire RBD group and separately for children, women, and men. No difference could be found between the RBD BAT vs the ISTH BAT (84% vs 80%; P = .291). However, the RBD BAT was able to identify more women (94% vs 83%; P < .01) and children (100% vs 71%; P < .01), whereas the ISTH BAT identified more men (79% vs 57%; P < .01). The correlations between baseline coagulation factor activity levels and the RBD BAT were less pronounced than the correlations with the ISTH BAT (supplemental Figure 2).
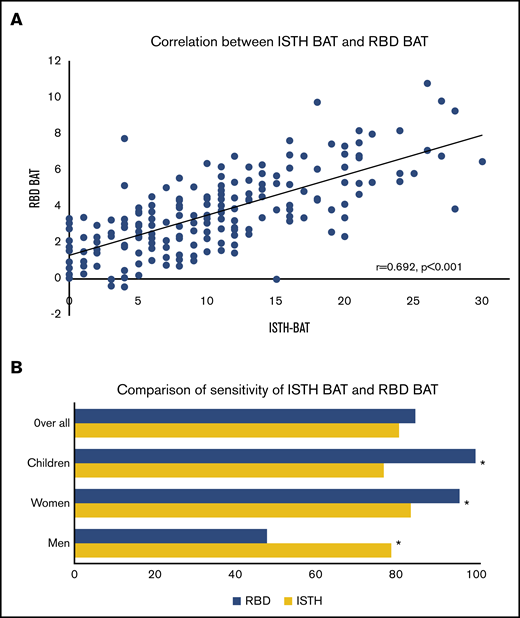
Correlation and comparison of the ISTH BAT and RBD BAT. (A) Correlation between ISTH BAT and RBD BAT scores with linear regression line. (B) Comparison of the percentage of identified patients (all patients, children younger than 18 years old, adult women aged 18 years or older, and adult men aged 18 years or older) by the ISTH BAT and RBD BAT. *Statistically significant difference.
Correlation and comparison of the ISTH BAT and RBD BAT. (A) Correlation between ISTH BAT and RBD BAT scores with linear regression line. (B) Comparison of the percentage of identified patients (all patients, children younger than 18 years old, adult women aged 18 years or older, and adult men aged 18 years or older) by the ISTH BAT and RBD BAT. *Statistically significant difference.
Bleeding severity grade and validation of threshold factor activity levels
The distribution of bleeding severity per RBD is shown in Figure 5A. In total, 16 patients (8%) were classified as asymptomatic. Grades 1, 2, and 3 bleeding were noted in 26 (13%), 122 (60%), and 38 patients (19%), respectively. Patients with FXIII deficiency had the highest proportion of grade 3 bleeding (75%). There was a correlation between the ISTH BAT and the bleeding severity grade, but there was a wide spread in all of the bleeding categories except for the asymptomatic patients (supplemental Figure 3). Figure 5B shows the predicted bleeding grade of a patient calculated from his or her individual factor activity level results, using previously determined threshold levels per RBD.4 Overall, 48% of the patients had more severe bleeding than predicted, based on their baseline factor activity level. Over the whole group, 34% of patients were predicted to be asymptomatic, but they actually had grade 2 (31%) or grade 3 (3%) bleeding (not shown in Figure 5B). The greatest discrepancies were observed for FV deficiency (57% incorrect), FVII deficiency (57% incorrect), and FXI deficiency (59% incorrect).
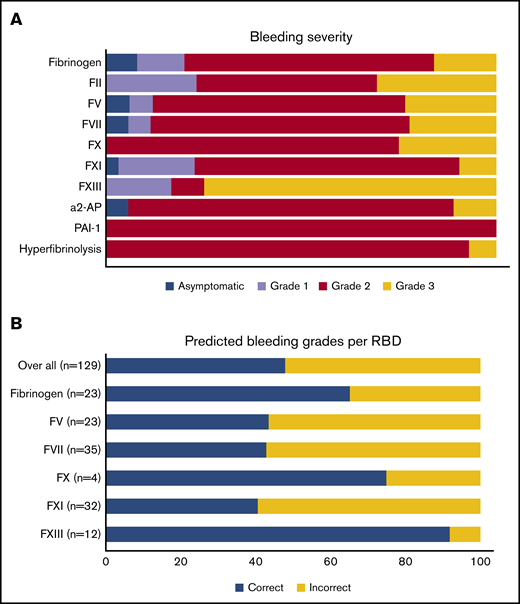
Bleeding grades. (A) Clinical bleeding severity of patients with an RBD. (B) Patients with more severe bleeding than expected, taking into account previously determined baseline factor activity levels.
Bleeding grades. (A) Clinical bleeding severity of patients with an RBD. (B) Patients with more severe bleeding than expected, taking into account previously determined baseline factor activity levels.
Discussion
The RBiN study is the first study in which clinical data for Dutch RBD patients are described. In all, the study population had 263 patients with a wide variety of baseline factor activity levels and included both homozygous and heterozygous patients. The bleeding severity revealed that the Dutch RBD population showed a more severe bleeding pattern than the previously described European RBD population.4,20 More importantly, these RBiN patients often showed more severe bleeding than was predicted for their baseline factor activity levels.
There was considerable heterogeneity in the bleeding phenotype between different RBDs. This can be explained by the specific bleeding phenotype of the RBD as well as the heterogeneous population included in this study, which ranged from young children to adults and from severe homozygous deficiencies to mild heterozygous deficiencies. The large variety in clinical phenotype within 1 RBD can be explained by the poor correlation between baseline factor activity levels and bleeding phenotype. For clinical practice, it remains important to always consider the specific disorder of an individual patient. In general, the ISTH BAT score of patients with an RBD was mainly dominated by the following types of bleeding: bleeding after surgery, after tooth extractions, after labor, and with menorrhagia. This is often described as a relatively mild bleeding phenotype when compared with hemophilia.2 Because clinical studies of hereditary bleeding disorders historically have focused on patients with hemophilia, knowledge of female-specific bleeding is less developed and may be underestimated. The high occurrence of menorrhagia (77% of the female patients age older than 14 years) found in this study is similar to that in women with VWD (73%) but higher than in carriers of hemophilia A (50%-64%).12,21-23 Fifty-one percent of women in this study who underwent labor had a postpartum hemorrhage (PPH). As shown in Figure 2, PPH was especially common in patients with FXI deficiency (70%; n = 10), hyperfibrinolysis (70%; n = 8), FVII deficiency (63%; n = 8), and FV+FVIII deficiency (100%; n = 1). None of the women with FXIII deficiency in this study had experienced labor, so the prevalence of PPH could not be calculated for this RBD. In women with VWD and carriers of hemophilia, deliveries are complicated with PPH in 34% of patients.24 More recently, slightly lower prevalences of PPH in carriers of hemophilia have been reported (24%-30%).12,23 However, the results observed in this study are difficult to interpret, because PPH was defined by the specific ISTH BAT item, not by actual blood loss indicated in the electronic medical record because these data were not available. Nevertheless, the number of women scoring on this individual item is high, and alertness on this topic is warranted.
The highest median ISTH BAT scores were found in patients with FV deficiency (16), FXIII deficiency (15), PAI-1 deficiency (12), and hyperfibrinolysis (12). Although it was expected for patients with FXIII deficiency, their ISTH BAT scores may be underestimated because 86% of patients with FXIII deficiency were receiving prophylaxis.25 The high number of patients with FXIII deficiency who experienced grade 3 bleeding can be explained by the fact that most of these patients had a baseline factor activity level of 0. The higher BAT scores in FV deficiency, known to be a mild bleeding disorder, might be explained by the relatively low baseline factor activity levels of the patients included in this study (Table 1).4 The absence of a specific FV concentration to ensure prophylactic treatment for these patients may further increase their BAT scores. In addition, platelet FV levels were not available, so possibly patients in this study had relatively low FV in their platelets as well.26 The mild bleeding phenotype of FV deficiency is thought to be (partly) caused by the low TFPI levels in these patients because TFPI binds to FV.27 The hypothesis regarding the influence of TFPI levels on the bleeding tendency is reinforced by the 2 patients in this study with FV Amsterdam. With normal FV activity levels, they had very high TFPI levels, resulting in ISTH BAT scores of 16 and 19. Possibly, patients with FV deficiency in this study had relatively normal levels or activity of TFPI, which would cause the higher bleeding tendency. TFPI levels will be measured in the specific RBiN population (results are outside the scope of this study). The high ISTH BAT scores in patients with a PAI-1 deficiency and hyperfibrinolysis are possibly an overestimation because of an inclusion bias; people with low ISTH BAT scores and without another specific indication of a fibrinolytic disorder did not undergo laboratory testing for these disorders. The relatively high number of patients with a fibrinolysis disorder (23 with α2-AP deficiency, 14 with a PAI-1 deficiency, and 14 with hyperfibrinolysis) and their high median ISTH BAT scores (7, 12, and 12, respectively) illustrate the importance of performing additional assays for fibrinolysis to diagnose these disorders. In addition, it is noteworthy that all patients with PAI-1 deficiency or hyperfibrinolysis and the majority of patients with α2-AP deficiency had at least grade 2 bleeding, meaning they experienced spontaneous bleeding and not only after interventions.
For all RBDs, the absence of a good correlation between coagulation factor activity levels and clinical phenotype indicates that there are other essential variables contributing to the clinical bleeding phenotype. In previous studies, a strong correlation between coagulation factor activity level and clinical phenotype was found for deficiencies of fibrinogen, FV+FVIII, FX, and FXIII.4 In this study, the strongest correlations were found in patients with FII or FX deficiencies. Only a small number of patients with an FX deficiency were included in the RBiN study, which may explain the lack of a significant correlation between coagulation factor activity level and clinical phenotype. The fact that only a moderate correlation was found for fibrinogen deficiency in this study suggests that the initial correlation found for this deficiency may not be as strong as previously reported. The lack of an association for FXI deficiency is consistent with the results from the study by Peyvandi et al.4 Most likely, the balance of all coagulant and anticoagulant factors will determine the bleeding severity. This study is the first to describe a correlation between α2-AP and bleeding severity and to show a moderate correlation. Global hemostasis assays such as thrombin generation, could contribute to the determination of an individualized bleeding phenotype. This is an interesting topic for further research.
The patients in this study had a more severe bleeding phenotype than patients in previous European studies.4,20 The patient population in this study possibly had more severe factor deficiencies compared with patients in those studies. Another explanation might be that the methodologies of the studies were different: all of the patients in the RBiN study were interviewed by the investigator, but the EN-RBD study used electronical medical records to assess bleeding severity. The previously determined factor activity levels to remain free from different bleeding severity grades were incorrect in 48% of the patients included in this study. This can be partly explained by the higher number of patients in this study who suffered from grade 2 or 3 bleeding compared with the EN-RBD study, which determined the threshold levels.4 The only RBD with a good prediction of bleeding severity in this study was FXIII deficiency, with only 8% of patients having bleeding more severe than what was predicted. However, because patients with FXIII deficiency in this study almost exclusively had very low factor activity levels, more data are necessary on heterozygous patients to determine whether the threshold levels are accurate. Overall, these results highlight the importance of obtaining a complete overview of an individual patients’ coagulation status. Given the fact that for most RBDs, correlations between factor activity levels and clinical bleeding severity are not strong, it is probably impossible to obtain better threshold levels than the ones used at the moment. Although these threshold levels to remain free from bleeding are often used in clinical practice, they should be interpreted with caution and should not be seen as definite cutoff levels for an individual patient with a bleeding tendency, which was also shown by the wide CIs in the original study.4 Caution is especially warranted concerning patients with FV, FVII, and FXI deficiencies.
The number of RBD patients identified by the RBD BAT was higher than for the ISTH BAT for women and children, and the ISTH BAT identified more men. The RBD BAT corrects for age and sex in the questionnaire, but the ISTH BAT does not correct for age; it does, however, correct for sex by using a lower cutoff value for men than for women. These results suggest that a correction for age in the RBD BAT helps diagnose RBDs in the pediatric RBD patient population. The correction for sex seems to be better in the RBD BAT for women, but there is an underestimation of the RBD BAT in men. Therefore, the correction factor seems to be inaccurate in the male patient population. These corrections for sex and age can be useful for diagnosing other bleeding disorders as well. To conclude that the RBD BAT is a better diagnostic tool, it will be necessary to use a healthy control group as a negative control in future studies.
A limitation of this study is the small number of patients per bleeding disorder, which is inherent in research on rare disorders at a nationwide level. In the future, it would be beneficial to perform studies at an international level, which would help enlarge the patient group. In addition, there may be local differences per HTC in the diagnosis of RBDs. However, all diagnosed patients were included to give an overview as complete as possible, and because all patients were diagnosed in an HTC, they were diagnosed by experts in the field. Despite the limited number of patients per RBD in our study population, our study has several significant implications. For the first time, patients with a fibrinolytic disorder were included in this type of study, and they had high bleeding scores. Another of our study’s strong points is that it reports real-life data. In addition, although most studies include only symptomatic patients because they have been diagnosed because of a bleeding phenotype, this study also included known heterozygous family members as well as patients diagnosed as a result of abnormalities on coagulation screening before surgery. However, as in all studies of patients with bleeding disorders, there is still likely to be an underestimation of the number of asymptomatic patients, because they are less likely to be diagnosed with a bleeding disorder.
In conclusion, the RBiN study reports real-life data and confirmed the heterogeneous bleeding tendency of patients with RBDs. Overall, correlations between baseline factor activity levels and clinical bleeding severity are poor, which is illustrative of RBDs. Bleeding was more severe in this patient population than in the previously described European RBD population. This difference persisted even when taking into account only patients with rare coagulation factor deficiencies, because disorders of fibrinolysis were not included in the previous study. Threshold levels to remain free from bleeding may not be reliable in this patient population and should be interpreted with caution.
For data sharing requests, please e-mail the corresponding author, Joline L. Saes, at joline.saes@radboudumc.nl.
Authorship
Contribution: K.M., M.H.C., R.E.G.S., M.P., L.N., F.J.M.v.d.M., I.C.K., W.L.v.H., and S.E.M.S. are members of the steering committee that designed the study and are delegates of all Dutch Hemophilia Treatment Centers; J.L.S. interviewed the patients; J.L.S. and M.J.A.V. analyzed the data; J.L.S., M.J.A.V., W.L.v.H., and S.E.M.S. wrote the manuscript; and all authors revised the manuscript and gave final approval.
A complete list of the members of the RBiN Study Group appears in “Appendix.”
Conflict-of-interest disclosure: K.M. reports grants and other funding from Bayer and Sanquin, grants from Pfizer, and other funding from Boehringer Ingelheim, Bristol-Myers Squibb, Aspen, and Uniqure outside the submitted work. M.H.C. has received grants from governmental research institutes such as the Dutch Research Institute (NWO), ZonMW, Innovation Fund, and NWO-NWA and unrestricted investigator-initiated research grants as well as educational and travel funding from Pfizer, Baxter, Baxalta, Shire, Bayer Schering Pharma, CSL Behring, Sobi Biogen, Novo Nordisk, Novartis, and Nordic Pharma and has served as steering board member for Roche and Bayer (all grants, awards and fees go to the Erasmus Medical Center as an institution and are outside the submitted work). R.E.G.S. reports grants from Bayer, Baxalta, Pfizer, and Novo Nordisk outside the submitted work. M.P. reports a grant from Pfizer outside the submitted work. F.J.M.v.d.M. reports grants from CSL Behring, Pfizer, Bayer, Novo Nordisk, Sobi, Roche, and OctaPharma outside the submitted work. W.L.H. reports personal fees from Takeda, Bayer, and CSL Behring, other funding from Enzyre, and nonfinancial support from Sobi outside the submitted work. The remaining authors declare no competing financial interests.
Correspondence: Joline L. Saes, Radboud University Medical Center, PO Box 9101, 6500 HB Nijmegen, The Netherlands; e-mail: joline.saes@radboudumc.nl.
Appendix: study group members
Members of the RBiN Study Group are: J.L.S., K.M., M.H.C., R.E.G.S., M.P., L.N., F.J.M.v.d.M., I.C.K., W.L.v.H., and S.E.M.S.

