

Key Points
Active iron export by ferroportin can be driven by proton gradient and charge potential.
Mutagenesis analysis suggests that the iron translocation site is at the pore region of ferroportin.

Abstract
As the sole iron exporter in humans, ferroportin controls systemic iron homeostasis through exporting iron into the blood plasma. The molecular mechanism of how ferroportin exports iron under various physiological settings remains unclear. Here we found that purified ferroportin incorporated into liposomes preferentially transports Fe2+ and exhibits lower affinities of transporting other divalent metal ions. The iron transport by ferroportin is facilitated by downhill proton gradients at the same direction. Human ferroportin is also capable of transporting protons, and this activity is tightly coupled to the iron transport. Remarkably, ferroportin can conduct active transport uphill against the iron gradient, with favorable charge potential providing the driving force. Targeted mutagenesis suggests that the iron translocation site is located at the pore region of human ferroportin. Together, our studies enhance the mechanistic understanding by which human ferroportin transports iron and suggest that a combination of electrochemical gradients regulates iron export.
Introduction
Ferroportin is the only iron exporter known in vertebrates.1 At the systemic level, ferroportin exports iron into the blood plasma from most cells involved in iron metabolism,2 including dietary iron absorbed by duodenal enterocytes,3 stored iron released from hepatocytes,4 and the majority of body iron that is recycled by macrophages through erythropoiesis. During pregnancy, ferroportin releases maternal iron from placenta syncytiotrophoblasts into the fetal circulation.5 In addition to handling systemic iron flow, ferroportin maintains local iron balance in heart and other tissues.6,7 Ferroportin has been proposed to act as a “safety valve” that relieves cardiomyocytes8 from iron-overload conditions such as those caused by thalassemia treatment.9-12 An important regulator of ferroportin is hepcidin,13-15 a peptide hormone triggering the internalization and subsequent degradation of the iron exporter. This regulation represents the most important control point of systemic iron homeostasis.2,8
Despite the physiological importance of ferroportin, the molecular mechanism of iron export remains unclear. Ferroportin belongs to the major facilitator superfamily (MFS) of membrane transporters, most of which use a cotransport mechanism, with proton being the typical coupling ion.16-19 The coupling enables the proton cotransporters to overcome an unfavorable substrate gradient that can occur under certain physiological conditions. The cotransport activity of ferroportin, however, is not obvious from previous studies conducted in Xenopus oocytes,20,21 of which the intracellular pH cannot be controlled. In addition, it is difficult to analyze metal efflux from cells20 because metal ions injected into the cells can be sequestered by small chelator molecules or chaperone proteins. The cellular studies20,21 show that ferroportin can transport Fe2+, Co2+, and Zn2+ but disagree on whether ferroportin can transport Cd2+ and Mn2+.
To resolve these difficulties, the current study determined the transport activity of purified human ferroportin in liposomes. Purified ferroportin actively transports Fe2+ as in cells. Other divalent metal ions, Co2+, Ni2+, and Mn2+, are transported with decreasing affinities. Ferroportin can transport protons, and this activity requires the cotransport of Fe2+ (or Co2+). Moreover, ferroportin can conduct uphill active transport against a Fe2+ (or Co2+) gradient. Mutagenesis analyses suggest that the iron translocation site is at the pore region of ferroportin. Elucidation of the transport mechanism of human ferroportin has implications for the control of iron export under various physiological settings.
Methods
Cloning and protein purification
The coding sequence of human ferroportin was amplified with polymerase chain reaction from an untagged clone (OriGene SC127301) and subcloned into a modified pPICZ-B expression vector (supplemental Figure 1A). A PreScission protease cleavage site, enhanced green fluorescent protein sequence, and 10× histidine tag were added to the C-terminal of ferroportin. Ferroportin mutants were generated by site-directed mutagenesis with the use of QuikChange. The nucleotide sequences of all the constructs were verified by DNA sequencing.
Wild-type and mutant ferroportin constructs were linearized and transformed into Pichia pastoris. Zeocin-resistant colonies with the highest expression level were inoculated to BMG media (1% glycerol, 0.34% yeast nitrogen base, 1% ammonium sulfate, 0.4 μg/mL biotin, and 100 mM potassium phosphate, pH 6.0) and grown at 30°C for 20 hours. After an exchange to the media without glycerol, protein expression was induced with 0.7% methanol for 2 days at 25°C. The cells were harvested by centrifugation and flash-frozen in liquid nitrogen.
For protein purification, 20 g frozen Pichia cells were applied to a ball mill (Retsch) to break the cell wall. The cell membrane was subsequently solubilized in a buffer containing 2% n-dodecyl β-d-maltoside (DDM), 300 mM NaCl, 100 mM Tris-HCl, pH 8.0, 10 µg/mL DNase I, and protease inhibitors. After centrifugation, the supernatant was incubated with Ni-NTA agarose, and the resin was subsequently washed in a buffer containing 20 mM imidazole, 50 mM Tris-HCl, pH 8.0, 150 mM NaCl, and 0.2% DDM. PreScission protease was added to remove the enhanced green fluorescent protein and 10× histidine tag from ferroportin. After the in-resin digestion, the protein was collected and concentrated for the subsequent purification by size-exclusion chromatography (Superdex 200). The peak fractions showing the highest UV absorbance (supplemental Figure 1A) were pooled and concentrated to 20 mg/mL, and the fresh protein was immediately used for liposome reconstitution.
Reconstitution of ferroportin into liposomes
The lipid mixture of 1-palmitoyl-2-oleoyl-sn-glycero-3-phosphoethanolamine and 1-palmitoyl-2-oleoyl-sn-glycero-3-phospho-(1'-rac-glycerol) at a 3:1 ratio (wt/wt) was resuspended in the reconstitution buffers used in different assays. The buffers contained 0.6% sodium cholate, and the final concentration of total lipids was 10 mg/mL. The lipid suspension was sonicated and mixed with purified ferroportin at 1:40 protein-to-lipid ratio (wt/wt). Bio-beads were added to remove the DDM detergent and to promote the liposomal reconstitution of ferroportin. After 2 hours, the protein concentration of the supernatant containing proteoliposomes was measured with a bicinchoninic acid assay and adjusted to the same protein concentration for wild-type and mutant ferroportins. The proteoliposomes were stored on ice before the transport assays.
Transport assay of divalent metal ions
The reconstitution buffer used for the metal transport assay contained 150 mM NaCl and 25 mM of different pH buffers, which are MES-NaOH pH 6.0, MES-NaOH pH 6.5, HEPES-NaOH pH 7.0, HEPES-NaOH pH 7.5, and Tris-HCl pH 8.0. These pH buffers and the buffers containing 5 mM CaCl2 were used during the lipid resuspension and ferroportin reconstitution. After the reconstitution, the proteoliposomes were mixed 1:1 (vol/vol) with the reconstitution buffers containing 500 µM calcein. Calcein was enclosed into the proteoliposomes through 3 freeze-thaw cycles and sonication. The proteoliposomes were subsequently passed through a G50 desalting column to remove free calcein and to exchange the buffers outside of the liposomes.
The metal transport assay was performed in 96-well plates with a Synergy 2 plate reader (BioTek), and the calcein fluorescence was detected with the excitation wavelength at 494 nm and emission at 516 nm. After 5 minutes equilibration, 10 µM FeCl2, 100 µM CoCl2, 100 µM MnCl2, or 100 µM NiCl2 was added. For the competition assay, 100 µM of ZnCl2, CdCl2, CaCl2, or MgCl2 was added together with 10 µM FeCl2. The metal transport through ferroportin was monitored for another 20 minutes. At 25 minutes, 1 µM calcimycin was added to allow metal influx through this ionophore. The intensity of the calcein fluorescence at 25 minutes was expressed as a percentage of the fluorescence before the metal ions were added (between 0 and 5 minutes), and this was used as a measure of transport activity.
Proton transport assay
The proteoliposomes were enclosed with a reconstitution buffer containing 150 mM KCl and 25 mM HEPES-KOH pH 7.5. Subsequently, the proteoliposomes were flowed through a G50 column prewashed with 150 mM NaCl and 25 mM HEPES pH 7.5. For the analysis of proton uptake, the same buffer with 1 µM 9-amino-6-chloro-2-methoxyacridine (ACMA) was added at the outside of the liposome; ACMA can diffuse freely into the liposomes but cannot diffuse out once it is proton bound.22 The ACMA fluorescence was detected with an excitation wavelength at 410 nm and emission at 490 nm. After 5 minutes of equilibration, 10 µM FeCl2 (or 20 µM CoCl2) and 20 nM valinomycin were added to generate an electrochemical gradient. The proton transport through ferroportin was monitored for another 20 minutes. At 25 minutes, 1 µM carbonyl cyanide m-chlorophenyl hydrazone (CCCP) was added to allow proton influx through this proton channel. The intensity of the ACMA fluorescence at 25 minutes was expressed as a percentage of the fluorescence before the metal ions were added (between 0 and 5 minutes), and this was used as a measure of proton transport activity.
Assay of active transport against the Fe2+/Co2+ concentration gradient
For the analysis of active transport, the reconstitution buffer enclosed in proteoliposomes was 25 mM HEPES pH 7.5, 150 mM KCl, 100 µM FeCl2 (supplemented with 100 µM sodium ascorbate to prevent oxidation), or 100 µM CoCl2. The proteoliposomes were quickly flowed through a G50 spin column and immediately used for the transport assay. To measure proton transport, a buffer containing 25 mM HEPES pH 7.5, 150 mM NaCl, and 1 µM ACMA was added from the outside of the liposome. After 5 minutes equilibration, 1 µM FeCl2 (with 1 µM sodium ascorbate) or 1 µM CoCl2 and 20 nM valinomycin were added. The proton transport through ferroportin was monitored for another 20 minutes. At 25 minutes, 1 µM CCCP was added to allow proton influx through this proton channel.
Results
Purified human ferroportin in a liposomal system transports iron efficiently
To conduct the transport assay in proteoliposomes, we expressed human ferroportin in P pastoris and purified the protein (supplemental Figure 1). During the purification, the wild-type protein (and mutant proteins used in later experiments) showed one major peak on size-exclusion chromatography. The wild-type ferroportin was reconstituted into liposomes, which was subsequently enclosed with calcein, a fluorophore that specifically binds divalent ions (Figure 1A). Fe2+ and other divalent metal ions (M2+) were provided from the outside of the liposomes to generate an influx gradient, and metal ions transported into the liposomes were detected by the quenching of calcein fluorescence.23,24
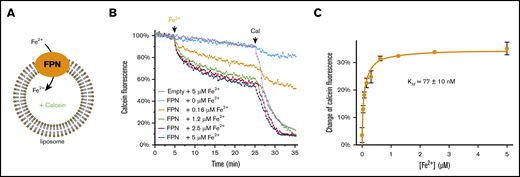
Purified human ferroportin (FPN) actively transports iron into liposomes. (A) Fluorescence-based assay of Fe2+ transport by FPN. The chemical gradient of Fe2+ drives the Fe2+ transport by FPN into the liposome. The Fe2+ influx is detected by the quenching of calcein fluorescence enclosed in the liposome. (B) Time-resolved FPN transport of Fe2+. The representative curves show the fluorescence quenching at different Fe2+ concentrations. Addition of Fe2+ and calcimycin (Cal) are indicated above the curves. The FPN-mediated Fe2+ transport is between 5 and 25 minutes and is saturated at high Fe2+ concentrations. Empty liposomes and FPN-containing liposomes with 0 μM Fe2+ are used as controls. (C) Michaelis-Menten curve of Fe2+ transport. The error bar of each data point is from duplicated experiments. Error of the apparent KM is calculated from the curve fitting of the duplicates by GraphPad Prism.
Purified human ferroportin (FPN) actively transports iron into liposomes. (A) Fluorescence-based assay of Fe2+ transport by FPN. The chemical gradient of Fe2+ drives the Fe2+ transport by FPN into the liposome. The Fe2+ influx is detected by the quenching of calcein fluorescence enclosed in the liposome. (B) Time-resolved FPN transport of Fe2+. The representative curves show the fluorescence quenching at different Fe2+ concentrations. Addition of Fe2+ and calcimycin (Cal) are indicated above the curves. The FPN-mediated Fe2+ transport is between 5 and 25 minutes and is saturated at high Fe2+ concentrations. Empty liposomes and FPN-containing liposomes with 0 μM Fe2+ are used as controls. (C) Michaelis-Menten curve of Fe2+ transport. The error bar of each data point is from duplicated experiments. Error of the apparent KM is calculated from the curve fitting of the duplicates by GraphPad Prism.
The reconstituted ferroportin shows a large activity of Fe2+ transport (Figure 1B). At high Fe2+ concentrations (1.2-5 μM), the calcein fluorescence is quenched to ∼50% to 60%. As a control, calcimycin, a divalent cation ionophore, was added later to allow untransported Fe2+ to cross liposome membranes. In the presence of calcimycin, the fluorescence is lowered by another ∼40%. In contrast, the empty liposome without ferroportin incorporated shows little decrease of fluorescence (∼10%), whereas adding calcimycin lowers the fluorescence by another ∼80%. Taken together, ferroportin can transport a large fraction of iron provided to the liposomal system.
To further validate the liposomal assay of ferroportin activity, we showed that the Fe2+ transport mediated by ferroportin follows Michaelis-Menten kinetics (Figure 1C). The Fe2+ influx is saturated at moderate to high Fe2+ concentrations. If Fe2+ had entered the proteoliposomes by significant leakage, the apparent influx would have increased proportionally with the Fe2+ gradient. Instead, this saturability is due to the limit imposed by ferroportin transport, and the Fe2+ influx is primarily through ferroportin. The apparent Michaelis constant (KM) of Fe2+ is 0.077 μM, close to the apparent affinity constant (≤0.1 μM) estimated from a cellular assay20 ; this consistency indicates that the reconstituted ferroportin has a similar activity as in the cellular environment and that the liposomal assay can mimic physiological conditions.
Human ferroportin preferentially transports iron over other divalent metal ions
We tested the transport of other divalent metal ions by ferroportin (Figure 2A-B) to compare with the cellular studies.20,21 The apparent KM for Co2+ transport is 5.2 μM, consistent with the apparent affinity constant of ≤5 μM from the cellular assay.20 Ferroportin can also transport Ni2+ (KM = 12.7 μM) in vitro; this Ni2+ transport activity has not been directly shown before.21 Ferroportin is a poor transporter of Mn2+, with a KM of 40 μM and a lower Vmax (maximum rate of transport) compared with other metals. This apparent KM of Mn2+ is lower than that observed in cellular assays (∼740 μM), probably because most Mn2+ is sequestered in cells and free Mn2+ is at a low concentration. The KM of Mn2+ is nevertheless high, supporting the assertion that Mn2+ is unlikely a physiological substrate of ferroportin. It remains possible, however, that ferroportin may slowly detoxify Mn2+ given a prolonged period of time. Our in vitro assay cannot analyze the activity of Cu2+ because it causes a precipitation of the proteoliposome. In addition, Ca2+, Mg2+, Cd2+, and Zn2+ do not quench calcein fluorescence. To overcome this problem, we analyzed the competition23 of these ions against Fe2+ transport (Figure 2C). Ca2+ and Mg2+ at 100 μM do not affect Fe2+ transport. In contrast, 100 μM Cd2+ and Zn2+ can inhibit the transport of Fe2+ (10 μM), suggesting that ferroportin may be able to transport Cd2+ and Zn2+. Taken together, it is clear that ferroportin can transport several divalent transition-metal ions in addition to Fe2+. Given that Co2+ is more resistant to oxidation, we included Co2+ in subsequent experiments to compare with Fe2+ transport. The apparent KM of Fe2+ is much lower than that of Co2+, Ni2+, and Mn2+, indicating that ferroportin preferentially exports Fe2+ over other divalent metal ions.
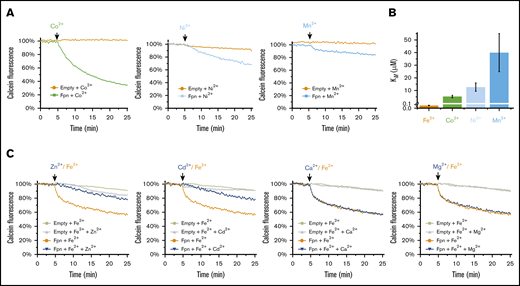
Human ferroportin preferably transports Fe2+over other divalent metal ions. (A) Transport activity of Co2+, Ni2+, and Mn2+ using the calcein-based assay (as in Figure 1). Addition of these divalent metal ions is indicated above the curves. All metal ions are provided at the concentration of 100 μM. (B) Comparison of the apparent KM of ferroportin-mediated transport of different metal ions, with the y-axis break at 0.1 μM. (C) Competition of other divalent ions (Zn2+, Cd2+, Ca2+, and Mg2+) against Fe2+ transport. Fe2+ and the competing metal ions are provided at the concentrations of 10 μM and 100 μM, respectively.
Human ferroportin preferably transports Fe2+over other divalent metal ions. (A) Transport activity of Co2+, Ni2+, and Mn2+ using the calcein-based assay (as in Figure 1). Addition of these divalent metal ions is indicated above the curves. All metal ions are provided at the concentration of 100 μM. (B) Comparison of the apparent KM of ferroportin-mediated transport of different metal ions, with the y-axis break at 0.1 μM. (C) Competition of other divalent ions (Zn2+, Cd2+, Ca2+, and Mg2+) against Fe2+ transport. Fe2+ and the competing metal ions are provided at the concentrations of 10 μM and 100 μM, respectively.
Proton gradients facilitate the iron transport by ferroportin at the same direction
With the liposomal transport assay established, we investigated whether the iron transport of human ferroportin can be altered by proton gradients (Figure 3A). We first tested the pH profile of iron transport activity in the absence of a proton gradient. With the same pH maintained at the inside and outside of proteoliposomes, we found that ferroportin is maximally active at pH 7.5 but loses most of its Fe2+ or Co2+ transport activity at pH 6 and pH 8 (Figure 3B-C), consistent with previous cellular assays.20 To generate proton gradients, we kept pH 7 at one side of the liposomes and varied the pH at the other side. With the pH gradients, the most notable change in the pH profiles is that the maximum activity of Fe2+ or Co2+ transport is now observed at pH 8 inside, when pH 7 is provided at the outside (pH 8in/7out) (Figure 3B-C). When pH 7 is provided at the inside, a notable difference is that 7in/6out shows a higher activity than pH 6in/6out and pH 6in/7out. The complicated changes in the activity levels reflect combined effects from the proton gradients, the intrinsic pH profile of ferroportin, and the unidirectional Fe2+ or Co2+ gradient being applied to the system. When larger proton gradients were applied (Figure 3D-E), the highest Fe2+ or Co2+ transport activity is observed with pH 8in/6out. Taken together, the inward transport of Fe2+ (or Co2+) by ferroportin can be stimulated by the inward proton gradient across the membrane.
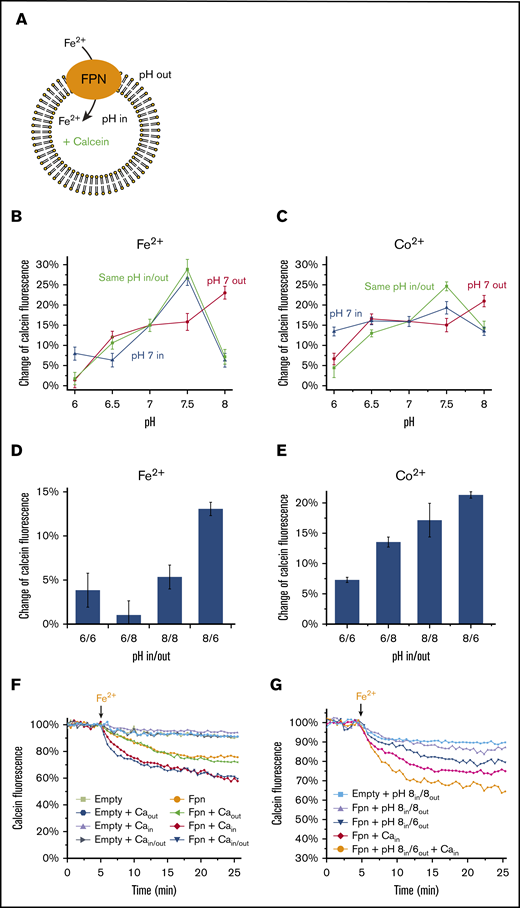
Proton gradients facilitate Fe2+and Co2+transport in the same direction. (A) Assay of the Fe2+ transport activity (same as in Figure 1) with the variations of pH inside and outside the liposome. (B) Comparison of the pH profiles of Fe2+ transport with and without proton gradients. The same pHs inside and outside the liposomes (green curve) show the pH dependence of ferroportin (FPN) activity without a proton gradient. The proton gradients across the membrane are generated by keeping pH 7 at inside (blue curve) or outside (red curve) the liposomes and varying the pHs at the other side. Fe2+ is provided at 10 μM concentration. (C) Comparison of the pH profiles of Co2+ transport with and without proton gradients. Co2+ is provided at 100 μM concentration. (D-E) Relative Fe2+ and Co2+ transport activities with proton gradients between pH 6 and pH 8. All error bars are standard deviations from 3 repeats. (F) Fe2+ transport activities with 5 mM Ca2+ inside and/or outside the liposomes. (G) Fe2+ transport activities with 5 mM Ca2+ inside and with proton gradients between pH 6 and pH 8.
Proton gradients facilitate Fe2+and Co2+transport in the same direction. (A) Assay of the Fe2+ transport activity (same as in Figure 1) with the variations of pH inside and outside the liposome. (B) Comparison of the pH profiles of Fe2+ transport with and without proton gradients. The same pHs inside and outside the liposomes (green curve) show the pH dependence of ferroportin (FPN) activity without a proton gradient. The proton gradients across the membrane are generated by keeping pH 7 at inside (blue curve) or outside (red curve) the liposomes and varying the pHs at the other side. Fe2+ is provided at 10 μM concentration. (C) Comparison of the pH profiles of Co2+ transport with and without proton gradients. Co2+ is provided at 100 μM concentration. (D-E) Relative Fe2+ and Co2+ transport activities with proton gradients between pH 6 and pH 8. All error bars are standard deviations from 3 repeats. (F) Fe2+ transport activities with 5 mM Ca2+ inside and/or outside the liposomes. (G) Fe2+ transport activities with 5 mM Ca2+ inside and with proton gradients between pH 6 and pH 8.
Apart from the proton gradient, a recent report found that extracellular Ca2+ stimulates ferroportin activity in cells.25 With the purified system, here we show that Ca2+ inside the liposome enhances the Fe2+ transport activity of ferroportin (Figure 3F), consistent with the cellular assays. In contrast, Ca2+ at the outside has no stimulatory effect. Thus, Ca2+ needs to be present at the side toward which ferroportin transports Fe2+; this directionality is conceptually the same as observed with cellular assays, in which iron export requires extracellular Ca2+. Because Ca2+ and proton gradient both enhance Fe2+ transport, we investigated the relationship between these 2 stimulators. We found that the transport activity increases by approximately fourfold with pH 8in/6out, and increases by sixfold with 5 mM Ca2+ at pH 8in/8out. When 5 mM Ca2+ and pH 8in/6out are both applied, the activity increases cumulatively to 10-fold. This observation suggests that the extracellular Ca2+ and proton gradient may act together to enhance (or regulate) ferroportin activity under physiological conditions.
Ferroportin is a proton symporter
To detect whether ferroportin can transport proton, we used an ACMA fluorophore to follow the change of proton concentration in proteoliposomes22 (Figure 4A). To allow sufficient pH change detectable by the quenching of ACMA, we need to neutralize the positive charges that are built up after Fe2+ (and H+) influx and that prevent further influx. We therefore loaded liposome with KCl inside and an equal concentration of NaCl outside, and added valinomycin, a K+ ionophore, to allow selective outflow of K+, thereby generating counteractive negative charges inside the liposome.

Human ferroportin (FPN) transports proton along the iron gradient. (A) Assay of proton transport based on the quenching of ACMA fluorescence. ACMA is provided from the outside to diffuse into the liposome22 (black arrow). After proton is bound, ACMA cannot diffuse out. To promote proton transport by FPN, 10 μM Fe2+ is provided at the outside to generate an influx gradient. The positive charge (blue sphere) introduced by Fe2+ and H+ influx is compensated for by K+ outflow through valinomycin (blue arrow). (B) Proton transport by FPN requires a Fe2+ gradient. Addition of Fe2+ at 5 minutes and CCCP at 25 minutes are indicated above the curves, and valinomycin (Val) is added at 0 minutes. (C) Proton transport by FPN in the presence of a Co2+ gradient. To generate an influx gradient, 100 μM Co2+ is provided from the outside of the liposome. Other experimental setups are the same as in panel B.
Human ferroportin (FPN) transports proton along the iron gradient. (A) Assay of proton transport based on the quenching of ACMA fluorescence. ACMA is provided from the outside to diffuse into the liposome22 (black arrow). After proton is bound, ACMA cannot diffuse out. To promote proton transport by FPN, 10 μM Fe2+ is provided at the outside to generate an influx gradient. The positive charge (blue sphere) introduced by Fe2+ and H+ influx is compensated for by K+ outflow through valinomycin (blue arrow). (B) Proton transport by FPN requires a Fe2+ gradient. Addition of Fe2+ at 5 minutes and CCCP at 25 minutes are indicated above the curves, and valinomycin (Val) is added at 0 minutes. (C) Proton transport by FPN in the presence of a Co2+ gradient. To generate an influx gradient, 100 μM Co2+ is provided from the outside of the liposome. Other experimental setups are the same as in panel B.
In the presence of ferroportin, significant proton influx is observed when the Fe2+ or Co2+ gradient and the negative charge potential are applied together (Figure 4B-C). In contrast, the charge potential alone does not promote much proton inflow. The Fe2+/Co2+ gradient alone only promotes low proton inflow due to the accumulation of positive charges. As a control, CCCP, a proton channel, was added later to allow further proton influx, and the relative levels of fluorescence quenching confirm that the proton influx mediated by ferroportin is significant. Taken together, ferroportin is capable of transporting protons, and the proton transport requires the presence of Fe2+/Co2+. The downhill Fe2+/Co2+ gradient used here should also promote the Fe2+/Co2+ transport (Figure 1). Because the Fe2+ and H+ are cotransported in the same direction, ferroportin is an Fe2+/H+ symporter.
Ferroportin mediates secondary active transport
Proton symporters should support secondary active transport.26-28 Therefore, in principle, a favorable electrochemical potential will drive ferroportin to move Fe2+ or Co2+ uphill against its concentration gradient. To demonstrate this active transport, we set the Fe2+/Co2+ concentrations at 1 μM outside the proteoliposomes and 100 μM inside (Figure 5A). The uphill influx was driven by a negative-inside charge potential, generated from selective K+ efflux as explained earlier. Direct analysis of the Fe2+/Co2+ transport activity is, however, infeasible because the calcein fluorophore binds the metal ions and lowers their concentration inside the liposome to an unknown level. Thus, we analyzed proton transport instead.23 A large proton influx, which was driven by the charge potential, was observed against the uphill Fe2+/Co2+ gradient (Figure 5B-C). Remarkably, if Fe2+/Co2+ was not provided from the outside, the proton transport did not occur, indicating that the proton transport is tightly coupled to the Fe2+/Co2+ transport. Because of this coupling, the proton transport indicates the uphill transport of Fe2+/Co2+ against their chemical gradients. Taken together, these data show that the symport of Fe2+/Co2+ and proton can be driven uphill against the chemical gradient of Fe2+/Co2+.

Human ferroportin (FPN) supports uphill active transport. (A) Assay of proton transport with an uphill Fe2+ gradient. The gradient is generated by enclosing 100 μM Fe2+ inside the liposome and providing 1 μM Fe2+ from the outside. The influx of Fe2+ and H+ is promoted by a charge gradient that is generated from the K+ outflow through valinomycin (Val; blue arrow). The assay of proton transport by the quenching of ACMA fluorescence is the same in Figure 4. (B) FPN transports protons against an uphill Fe2+ gradient. Addition of Fe2+ and CCCP are indicated above the curves. (C) FPN transports protons against an uphill Co2+ gradient, with 100 μM Co2+ enclosed inside the liposome and 1 μM Co2+ provided from the outside.
Human ferroportin (FPN) supports uphill active transport. (A) Assay of proton transport with an uphill Fe2+ gradient. The gradient is generated by enclosing 100 μM Fe2+ inside the liposome and providing 1 μM Fe2+ from the outside. The influx of Fe2+ and H+ is promoted by a charge gradient that is generated from the K+ outflow through valinomycin (Val; blue arrow). The assay of proton transport by the quenching of ACMA fluorescence is the same in Figure 4. (B) FPN transports protons against an uphill Fe2+ gradient. Addition of Fe2+ and CCCP are indicated above the curves. (C) FPN transports protons against an uphill Co2+ gradient, with 100 μM Co2+ enclosed inside the liposome and 1 μM Co2+ provided from the outside.
Mutations disrupting the iron and proton transport activities of ferroportin
To understand the structural basis of iron export, we built homology models29 of human ferroportin (Figure 6A) based on the crystal structures of a bacterial homolog.24 The bacterial structures were determined at the inward- and outward-facing conformations, which allow alternating access during the substrate transport, a mechanism believed to be used by all MFS transporters.16 In this bacterial homolog, the iron-binding site is located at the N-half of the protein (N-lobe) and buried in the transmembrane helices. The iron is coordinated by 4 residues (T20, D24, N196, and S199) in the crystal structures of the bacterial homolog; in human ferroportin, the corresponding residues constituting this putative iron-bind site are S35, D39, N212, and S215, respectively. Biochemical analyses of the bacterial homolog show that the D24A mutant has drastically reduced transport activity.24 In addition, the iron-binding affinity is lowered by several folds with D24A, N196A, and D24A/N196A mutations.

Iron and proton transport activities of ferroportin mutants. (A) Homology model of human ferroportin in inward-open (left) and outward-open (right) conformations. The models are generated by I-TASSER45 using the PDB code 5AYN and 5AYO. The iron-binding site in the bacterial homolog is shown in cyan sphere. (B-C) Relative Fe2+ and Co2+ transport activities of mutants. Experimental setups are the same as in Figure 1. (D-E) Relative proton transport activities of the mutants under a Fe2+ and Co2+ gradient. Experimental setups are the same as in Figure 4.
Iron and proton transport activities of ferroportin mutants. (A) Homology model of human ferroportin in inward-open (left) and outward-open (right) conformations. The models are generated by I-TASSER45 using the PDB code 5AYN and 5AYO. The iron-binding site in the bacterial homolog is shown in cyan sphere. (B-C) Relative Fe2+ and Co2+ transport activities of mutants. Experimental setups are the same as in Figure 1. (D-E) Relative proton transport activities of the mutants under a Fe2+ and Co2+ gradient. Experimental setups are the same as in Figure 4.
We mutated D39 and N212 in human ferroportin to determine whether it shares the same iron-binding site as the bacterial homolog. Surprisingly, we found that mutations of D39A, N212A, D39A/N212A, and H32A, a nearby residue (Figure 6A), all retain a similar activity of iron transport as the wild-type human ferroportin (supplemental Figure 2A). Moreover, the apparent KM values of D39A, N212A, D39A/N212A, and H32A are similar or even better than that of the wild-type ferroportin (supplemental Figure 2B). Because mutating the iron-binding site is expected to change the iron-transport activities and the apparent KM, these ineffective mutations suggest that the iron-binding site of human ferroportin is different from that of the bacterial homolog.
The N-lobe location of the iron-binding site in the bacterial homolog is known to be unusual (Figure 6A) because all other MFS transporters with known structures bind substrates at the interface between the N- and C-lobes.16 The homology models of human ferroportin show several acidic and histidine residues around this interface region, including H32, D39, D181, E219, D254, D325, D473, E486, D504, and H507; these residues are capable of binding iron or protonate under a physiological pH. We therefore mutated all of these candidate residues to identify those involved in proton and iron transport. Among the 12 mutants tested, only D181N exhibits low Fe2+ or Co2+ transport activity, suggesting that D181 is involved in the iron binding (Figure 6B-C). In addition, D181N has a low proton transport activity compared with the wild-type ferroportin (Figure 6D-E). The homology models show that D181 can be alternatively accessed at the inward- and outward-facing conformations, supporting that D181 constitutes part of the iron-translocation pore.
Unlike D181N, several other mutants can actively transport Fe2+/Co2+ but exhibit low activities of transporting proton, indicating that these 2 activities can be decoupled (Figure 6D-E). The E219A and E486A mutants both can decouple the proton-iron symport. E219Q, however, is active for both Fe2+/Co2+ and proton transport, whereas E486Q mutant decouples the symport; these mutations were tested because the glutamine side chain cannot be protonated. D254N drastically lowers the proton transport activity, whereas D39N, D325N, and D473N exhibit ∼50% to 60% of activity compared with the wild-type ferroportin. In contrast, H32A, D504N, and H507A remain largely active for iron and proton transport. These residues are unlikely to be involved in the transport process. Taken together, decoupling of iron and proton transport activities is probably because the mutations disrupt the protonation or deprotonation process during the ferroportin-mediated transport.
Discussion
In this study, we established a liposomal assay to analyze the transport activities of purified human ferroportin. This proteoliposome system enables the precise characterization of transport activities of human ferroportin and avoids limitations of cell-based assays (Figure 1). For example, it is difficult to measure proton transport or to control the concentration of free iron in cells. Compared with iron export from cells, the iron import into the proteoliposomes is in a reversed direction but is conceptually equivalent. Ferroportin can transport iron into liposomes with an apparent KM at the submicromolar range, consistent with the cell-based assays. This low KM allows ferroportin to efficiently transport iron even at low cellular concentrations.
Ferroportin shows considerable activity of transporting several other transition metal ions, suggesting that ferroportin may also export these metals from various cells. The exporter activity of ferroportin is unusual among the numerous metal transporters found in cells, most of which are importers of metal ions.30 Thus, this unusual exporter may be used in vivo for protection against the cytotoxicity caused by overload of transition metal ions. Compared with Fe2+ transport, however, ferroportin exhibits a much larger KM of transporting other transition metals (Figure 2B). Thus, it is possible that ferroportin does not affect the normal metabolism of these metals but acts as a safety valve when these metal ions exceed certain cellular levels. Furthermore, overloaded iron and other transition metals are known to induce ferroportin expression in various cells, such as macrophages.31-36 This regulatory mechanism may serve as another trigger for ferroportin to export these transition metals and detoxify cells.
Ferroportin exhibits tightly coupled activities of proton and iron transport at the same direction (Figure 4B-C). The mechanism of proton symport is most well studied in LacY, a canonical MFS transporter.26 Protonation of LacY is required for substrate binding, which induces the transition between the inward- and outward-facing conformations. This structural transition allows substrate release, which is associated with side chain rearrangements that involve deprotonation. If ferroportin shares a similar mechanism as LacY, the tight coupling between proton and iron transport can also be explained. By analogy, iron binding at the inward-facing conformation is required to induce the structural transition to the outward-facing conformation to release iron. In the absence of the iron binding and release, the proton transport, which involves protonation and deprotonation at the alterative conformations, becomes insignificant (Figure 5B-C).
Ferroportin uses multiple mechanisms to enhance its transporter activity. Inspired by a previous report,25 here we found that the presence of Ca2+ increases ferroportin activity in the purified liposomal system (Figure 3F). Because Ca2+ and proton gradient enhance the ferroportin activity cumulatively (Figure 3G), they seem to use different mechanisms, presumably through modulating the protein conformation in different ways; if a similar mechanism were used, Ca2+ and proton gradient should have overcome the need of each other for enhancing the activity. Moreover, iron export into the blood plasma is facilitated by ferroxidases8 such as ceruloplasmin and hephaestin, which oxidize Fe2+ to Fe3+.
Among the mutants of 11 acidic or histidine residues we tested, D181N is the only one inactive for both iron and proton transport (Figure 6B-E). The homology models of human ferroportin show that D181 is located at the interface between the N- and C-lobes, a location consistent with that of the translocation pore (Figure 6A). If the iron binding is disrupted by D181N, the structural transition cannot be induced to allow proton transport, consistent with the loss of both activities. Clinically, a D181V mutation leads to ferroportin disease, suggesting the importance of this residue in the function of iron export.37 Moreover, the region around D181 on TM5 is a hotspot of ferroportin disease mutations, including N174I, R178Q, I180T, Q182H, and N185D/T.38-40 The cluster of these mutations also suggests that the translocation site is located around D181. Taken together, the iron translocation by human ferroportin probably involves D181, and this translocation site is at the pore region, similar to other MFS transporters.
This pore location of iron binding and translocation site is different from that reported in the bacterial homolog.24 Due to the considerable sequence similarity, the overall structures of human ferroportin should be largely similar to the crystal structures of the bacterial homolog, which has revealed an unusual iron-binding site at the N-lobe of the bacterial protein. However, human ferroportin mutants at this site can transport iron with similar Vmax and KM as the wild-type protein, unlike the corresponding mutants of the bacterial homolog. Thus, our data indicate key differences between the human ferroportin and its bacterial homolog, the latter of which is also not a proton symporter.
Several mutations can decouple the proton transport from iron transport. For instance, the E486Q mutant mimics the protonated form of E486, allowing ferroportin to bind iron with high affinity and to conduct iron transport, but this mutant cannot transport proton (Figure 6B-E). The homolog model at the outward-facing conformation shows that E486 is at the C-lobe of ferroportin and forms a salt bridge with R88 at the N-lobe. At the inward-facing conformation, however, these residues are far apart, thereby allowing the protonation of E486. However, E486 is located at the intracellular surface and not exposed to the extracellular side at the outward-facing conformation (Figure 6A). Because E486 cannot be deprotonated at the outward-facing conformation, the proton transport cannot be mediated by E486 alone. Instead, this residue probably serves as the initial proton-binding site on a translocation path, whereas the actual residues mediating the proton transport remain to be identified. Similar to LacY, protonation of ferroportin may increase its affinity of iron binding; in LacY, the protonation is on a glutamate residue, which does not bind the substrate directly but donates the proton to assist substrate binding.41 Overall, the structural mechanism of proton-symport in ferroportin remains to be answered.
Proton coupling is broadly used by MFS transporters as the energy source to conduct active transport.16 The efficiency of iron export is determined by the iron and proton gradient. Membrane potential also contributes to the overall electrochemical gradient because ferroportin is an electrogenic symporter of Fe2+ and H+. The negative charge potential inside cells is against the export of the positively charged Fe2+ and H+. Theoretically, for the Fe2+ export to occur, the regular membrane potential of −60 mV requires a 1000-fold concentration gradient of Fe2+ across the plasma membrane (assuming one proton cotransports with one Fe2+). To overcome this unfavorable and potentially controlling barrier of membrane potential, one plausible solution is to coordinate iron export with iron import in various cell types. In duodenal enterocytes, iron41-43 and many other nutrients are imported through various proton symporters8 (supplemental Figure 3A). In macrophages, iron released in the phagolysosome is also transported to cytoplasm by proton symporters, DMT118 and Nramp1 (supplemental Figure 3B). These protons, together with the imported iron, may generate sufficient driving force for iron export. As an exception, cardiomyocytes constantly depolarize to generate a reversed membrane potential, which may facilitate iron export and protect these cells against iron overdose44 (supplemental Figure 3C). Examining these hypotheses under physiological or cellular conditions will shed light on the control and driving force of iron export in vivo.
Requests for data sharing may be submitted to the corresponding author (Weikai Li; e-mail: weikai@wustl.edu).
Acknowledgments
The authors thank Shizhen Wang for critical reading of the manuscript.
W.L. is supported by the National Institutes of Health, National Heart, Lung, and Blood Institute (R01 HL121718), National Eye Institute (R21 EY028705), and National Institute of General Medical Sciences (R01 GM131008); the W. M. Keck Foundation (Basic Science @ the Forefront of Science); and the Children’s Discovery Institute (MC-II-2020-854).
Authorship
Contribution: S.L. performed the experiments; Y.Y. purified the proteins; and W.L. and S.L. designed the study, analyzed data, and wrote the manuscript.
Conflict-of-interest disclosure: The authors declare no competing financial interests.
Correspondence: Weikai Li, Department of Biochemistry and Molecular Biophysics, Washington University School of Medicine, 660 S Euclid Ave, St. Louis, MO 63110; e-mail: weikai@wustl.edu.

