

Key Points
Metabolic landscape of MM cells supports the relevance of amino acid depletion as a novel anti-MM therapeutic strategy.
Erw-ASNase combined with proteasome inhibition results in synergistic anti-MM effects by inducing ROS-mediated cell death.

Abstract
Metabolic reprogramming is emerging as a cancer vulnerability that could be therapeutically exploitable using different approaches, including amino acid depletion for those tumors that rely on exogenous amino acids for their maintenance. ʟ-Asparaginase (ASNase) has contributed to a significant improvement in acute lymphoblastic leukemia outcomes; however, toxicity and resistance limit its clinical use in other tumors. Here, we report that, in multiple myeloma (MM) cells, the DNA methylation status is significantly associated with reduced expression of ASNase-related gene signatures, thus suggesting ASNase sensitivity for this tumor. Therefore, we tested the effects of ASNase purified from Erwinia chrysanthemi (Erw-ASNase), combined with the next-generation proteasome inhibitor (PI) carfilzomib. We observed an impressive synergistic effect on MM cells, whereas normal peripheral blood mononuclear cells were not affected. Importantly, this effect was associated with increased reactive oxygen species (ROS) generation, compounded mitochondrial damage, and Nrf2 upregulation, regardless of the c-Myc oncogenic-specific program. Furthermore, the cotreatment resulted in genomic instability and DNA repair mechanism impairment via increased mitochondrial oxidative stress, which further enhanced its antitumor activity. Interestingly, carfilzomib-resistant cells were found to be highly dependent on amino acid starvation, as reflected by their higher sensitivity to Erw-ASNase treatment compared with isogenic cells. Overall, by affecting several cellular programs, Erw-ASNase makes MM cells more vulnerable to carfilzomib, providing proof of concept for clinical use of this combination as a novel strategy to enhance PI sensitivity in MM patients.
Introduction
Multiple myeloma is a hematological cancer deriving from the neoplastic transformation of terminally differentiated B lymphocytes.1 The last decade has seen remarkable progress in the management of patients with MM, thanks to the introduction of novel therapies, such as proteasome inhibitors (PIs), immunomodulators, monoclonal antibodies, and chimeric antigen receptor T cells.2,3 However, despite significant progress in deciphering the genomic landscape of MM, the translation of these findings into effective targeted therapies remains largely unsuccessful because of the high degree of genomic heterogeneity and instability of this malignacy.4-7 Therefore, innovative strategies are desirable to improve the outcome of patients with a poor prognosis and to reduce the side effects associated with currently available therapeutics.8,9
Metabolic reprogramming is a hallmark of human cancer and is represented by the dependency of tumors on particular metabolic pathways for promoting growth, survival, proliferation, and long-term maintenance.10 Based on this nononcogene addiction, tumor cells rely on aerobic glycolysis to supply energy by converting a majority of glucose-derived pyruvate to lactate.11 Moreover, malignant cells engage glutamine (Gln) anaplerosis to replace tricarboxylic acid (TCA) cycle intermediates (eg, α-ketoglutarate), thus sustaining their metabolic status. Therefore, the majority of human cancers use glucose and Gln to rewire metabolism and to generate energy to sustain their growth. In contrast, normal cells have lower nutrient demands so that metabolic reprogramming represents a specific tumor cell vulnerability that could be therapeutically exploited.10,12-15 Unfortunately, these approaches are hampered by numerous side effects, requiring the need for alternative strategies, such as combination therapies.12,16-18
In the present study, our gene expression profile analysis of publically available databases revealed higher expression of amino acid metabolism-related genes among MM patients compared with normal plasma cells. Similarly, a comprehensive metabolomics analysis showed aberrant asparagine synthetase (ASNS) hypermethylation on these cells, suggesting higher sensibility for asparaginase-based therapies. As a result, the amino acid depletion and metabolic deregulation triggered by the clinically used drug Erwinia chrysanthemi–derived ASNase (Erw-ASNase) led to anti-MM activity. Moreover, this strategy made MM cells particularly vulnerable to carfilzomib (Kar) treatment by leading to marked mitochondrial oxidative stress, DNA damage, and apoptotic cell death that were all prevented by antioxidant agents or mitochondria-targeted catalase overexpression. Furthermore, the enhanced genomic instability and impaired DNA-repair mechanisms further contributed to the synergistic effects of the tested combination. We also provide data showing that Kar resistance, by making MM cells more dependent on amino acid metabolism, results in higher Erw-ASNase sensitivity compared with isogenic cells. Overall, dual targeting of proteasome and amino acid metabolism with drugs that are already being used clinically shows great promise for anti-MM strategies.
Materials and methods
Reagents
Erw-ASNase was provided by Jazz Pharmaceuticals. Kar- and Escherichia coli–derived ASNase were purchased from Selleck Chemicals (cat. no. S2853) and Sigma-Aldrich (product no. A3809), respectively.
Cell lines and culture
MM cell lines were purchased from American Type Culture Collection or Leibniz Institute DSMZ or were provided by collaborators. All cell lines were Mycoplasma free and were routinely tested for it. Cells were cultured in RPMI 1640 medium containing 10% fetal bovine serum (Gibco), 4 mM Gln, 100 U/mL penicillin, and 100 μg/mL streptomycin (Gibco). For experiments conducted under amino acid–deprived conditions, MM cells were grown in amino acid–free medium (Minimal Essential Medium, product no. 51412C; Sigma-Aldrich), supplemented or not with L-Gln and/or L-Asn (4 mM and 0.4 mM as final concentration, respectively). The Kar-sensitive and Kar-resistant AMO-1 cells were provided by Lenka Besse (Department of Oncology and Hematology, St. Gallen Cantonal Hospital, St. Gallen, Switzerland). The 293T cell line was purchased from American Type Culture Collection and cultured in Dulbecco’s modified Eagle medium containing 10% fetal bovine serum, 4 mM Gln, 100 U/mL penicillin, and 100 μg/mL streptomycin (Gibco).
Primary cells
Blood samples collected from healthy volunteers were processed using a Ficoll-Paque (GE Healthcare) gradient to obtain peripheral blood mononuclear cells (PBMCs). MM cells from individuals affected by MM were purified from bone marrow (BM) samples after informed consent was obtained, in accordance with the Declaration of Helsinki and approval by the Ethical Committee at San Martino Policlinico in Genoa. Mononuclear cells were separated using Ficoll-Paque density sedimentation, and plasma cells were purified (>95% CD138+) by positive selection with an anti-CD138 magnetic activated cell separation microbeads system (Miltenyi Biotec).
Western blotting
Whole-cell lysates, sodium dodecyl sulfate polyacrylamide gel electrophoretic separation, and blotting were performed as previously described.19 Primary antibodies used are detailed in supplemental Material and methods. Signals were acquired with an iBright 1500 Imaging System using standard enhanced chemiluminescence (Thermo Fisher). Band intensities were quantified by Quantity One SW software (Bio-Rad). Cytochrome c translocation from mitochondria into cytosol during apoptosis was assayed using a Cytochrome c Release Assay Kit (ab65311; Abcam), according to the manufacturer’s instructions.
Cell viability and apoptosis assay
The viability and apoptosis of MM cell lines were assessed as previously described.20 For MM primary cells, 2 × 10³ CD138+ primary tumor cells were plated in a white opaque 96-well plate in complete medium supplemented with 4 ng/mL interleukin-6. Next, cells were treated with drugs, and cell viability was measured 48 hours later with a CellTiter-Glo Luminescent Cell Viability Assay (cat. no. G7570; Promega), following the manufacturer’s instructions.
Lentiviral-mediated gene transfer
pLV empty vector (control), pLV-EGFP/Puro-SV40 > hcMyc (human cMyc overexpressing), and mitochondrial Catalase (pLVX EF1a-IRES-puro-CatalaseMito)21 were used to create stable isogenic MM cell lines. pLV-EGFP/Neo-SV40 > Nluc was used to generate a stable MM cell line expressing luciferase. All lentiviral plasmids were purchased from VectorBuilder, with the exception of pLVXEF1a-IRES-puro-CatalaseMito, which was provided by Arianna Giacomini (University of Brescia, Brescia, Italy). The detailed procedure used is reported in supplemental Material and methods.
Tumor cell–specific bioluminescence imaging in cocultures with stromal cells
A total of 7 × 10³ luciferase-positive MM cells (U266 pLV-SV40-EGFP/Luc+) were plated in 96-well optical white plates in the presence or absence of preplated luciferase-negative primary stromal cells (20 × 103 cells seeded 24 hours before) and treated with drugs or vehicle (dimethyl sulfoxide [DMSO]), as indicated in each experiment. After 48 hours of treatment, MM cell–specific viability was assessed with a Nano-Glo Live Cell Assay System (cat. no. N2011; Promega).
Immunofluorescence staining
DNA damage was detected by confocal microscopy, as described previously.22 The anti-γH2AX antibody was from Millipore (Ser139, cat. no. 05-636) and the secondary Alexa Fluor 488–conjugated antibody was from Jackson ImmunoResearch (cat. no. 115-546-006). γH2AX foci were counted using ImageJ-Find Maxima.
Asparaginase and glutaminase enzymatic activities
A total of 200 × 103 MM cells was plated in a 12-well plate in 2 mL of complete medium and treated with 0.3 U/mL of ASNase (Erw-ASNase or E coli derived), and asparagine (Asn) and Gln were dosed at indicated time in conditioned media. At each time point, supernatants were centrifuged at 2200 rpm for 3 minutes. Then, 500 µL of 10% sulfosalicylic acid was added to 1 mL of supernatant, rapidly frozen in dry ice, and stored at −80°C. The analytical procedure for amino acid quantification in medium was carried out as reported by Gentili et al.23 Amino acid concentrations were finally reported as normalized to specific control for every time point.
Cell cycle analysis
Cell-cycle profiles were obtained by staining cells with propidium iodide (50 μg/mL) in hypotonic lysis solution (0.1% [volume-to-weight ratio] sodium citrate, 0.1% [volume-to-volume ratio] Triton X-100) and incubating them at 4°C for 24 hours before fluorescence-activated cell sorting analysis.
Mitochondrial membrane potential assay
Active mitochondria were labeled in MM cells by TMRE (tetramethylrhodamine, ethyl ester) staining. After drug treatments, cells were incubated with 50 nM TMRE for 15 minutes at 37°C, and positive staining was measured at flow cytometry.
MitoSOX Red Mitochondrial Superoxide staining
MitoSOX Red reagent (5 mM; Thermo Scientific) was resuspended in DMSO and diluted in Hanks balanced salt solution/Ca/Mg buffer to obtain a final concentration of 5 μM as working solution. Cells were incubated in 2 mL of working solution for 10 minutes at 37°C, and positive staining was evaluated by flow cytometry or confocal microscopy.
Homologous recombination assay
Homologous recombination (HR) activity was measured using a Homologous Recombination Assay Kit (Norgen Biotek), according to the manufacturer’s instruction. Briefly, U266 cells were treated with drugs for 6 hours and then nucleofected with Amaxa Nucleofector 4-D (Lonza, EH-100 program) with 250 ng of dl1 and dl2 plasmids. Next, cells were treated with drugs for another 20 hours, and DNA was extracted with a QIAamp DNA Blood Mini Kit (QIAGEN). Finally, quantitative polymerase chain reaction (qPCR) was performed with 300 ng of DNA as starting material, using an appropriate thermal cycling program.
Determination of intracellular NAD and ATP levels
The NAD+ and adenosine triphosphate (ATP) content of whole cells was assessed as previously described.24
Transient transfection of MM cells
U266 NrF2-silenced cells were generated by transient transfection of small interfering RNAs (siRNAs; ON-TARGETplus SMART pool siRNA; #L-003755-00-0005) using nucleofection. For each nucleofection, 2 × 10⁶ U266 cells were pulsed with the EH-100 program, using an Amaxa SF Cell Line 4-D Nucleofector X Kit L (Lonza). siRNAs were used at a final concentration of 500 nM. At 24 hours after nucleofection, cells were treated and used for further experiments.
Human data sets
Gene expression profiling data were derived from publicly available Gene Expression Omnibus data sets (accession numbers GSE66293 and GSE47552) obtained with Affymetrix Human Gene 1.0 ST array. The heat maps of the gene lists were generated using DNA-Chip Analyzer software,25 and hierarchical clustering analyses were performed using Pearson’s correlation and average linkage metrics. To obtain enrichment scores based on global ASNase gene expression levels, the gsva function in the Gene Set Variation Analysis package for microarray and RNA-sequencing data (GSVA, version 3.8) was applied in R Bioconductor (version 3.5.1), by choosing the z-score method and Gaussian distribution. Samples were then stratified into low (z-score ≤ −1), intermediate (−1 < z-score < 1), or high (z-score ≥ 1) groups. To verify the possible association between upregulation of the ASNase gene signature and clinical outcome in MM, we considered samples from 767 MM patients at baseline that were included in the Multiple Myeloma Research Foundation (MMRF) CoMMpass Study and publicly available (https://research.themmrf.org/) and extracted from the Interim Analysis 12a (MMRF_CoMMpass_IA12a). Transcript per million read values, obtained by Salmon gene expression quantification (MMRF_CoMMpass_IA12a_E74GTF_Salmon_V7.2_Filtered_Gene_TPM), were used to extract the expression levels of 15 available genes (ENSG00000268104 not present) in the entire signature. Z-score was calculated by discarding genes with constant expression levels, and MM samples were stratified according to z-score value. The low z-score group (185 MM patients) was compared with the high z-score group (198 MM patients) in relation to survival data (CoMMpass_IA12_FlatFiles). The Kaplan-Meier method (survival package) was applied to overall survival (OS) and progression-free survival (PFS), the log-rank test P value was calculated between high and low z-score groups, and MM patients were stratified in each group according to their risk by time. Gene set enrichment analysis26 was performed by applying 1000 phenotype permutations and default analysis conditions on hallmark gene set collection (5-500 genes per gene set). Significant gene sets were selected on the basis of a false discovery rate q value < 25%. For gene methylation analysis, MM data derived from our published study were used.27 We extrapolated the probes related to the genes of interest with their genomic annotation using the Illumina Human Methylation 450 kanno.ilmn12.hg19 Bioconductor package.28 For probes that refer to the UCSC RefGene Group Promoter Region (TSS1500, TSS200, 5′UTR, first exon), we evaluated the methylation level (β value); thereafter, we correlated the mean level per sample with gene expression level by Spearman method (2-sided).
Statistical analysis
All values are expressed as mean ± standard deviation (SD). The statistical significance of differences between treatments was analyzed with the Student t test using GraphPad Prism analysis software; differences were considered significant at P ≤ .05. Drug interactions were assessed using CalcuSyn 2.0 software (Biosoft), which is based on the Chou-Talalay method. A combination index (CI) of 1 indicates and additive effect, CI < 1 indicates synergism, and CI > 1 indicates antagonism. Fisher’s exact test was applied to verify the association between IgH chromosomal translocations and z-score in MM samples.
Results
Metabolic landscape provides the biological rationale for amino acid–depletion approach in MM
Cancer cells adapt their metabolic pathways to the increased nutritional demand for energy and biosynthesis processes, which are essential for tumor growth.10 Amino acids are components of proteins, as well as intermediate metabolites that fuel multiple biosynthetic pathways; as a result, their targeting has shown promise for therapeutic intervention in numerous cancers.10,29 Moreover, thanks to the different amino acid–dependency pattern compared with tumors cells, these therapies have a minimal effect on normal cells.30-32 An example of this approach is represented by ASNase, a backbone agent used for the treatment of acute lymphoblastic leukemia.33 Although it is known that ASNase mediates hydrolysis of the nonessential amino acids Asn and Gln,34,35 the contribution of each amino acid depletion to the antitumor activity of this agent remains to be elucidated. In such a scenario, Bolzoni et al recently demonstrated that Gln-addiction targeting, using ASNase, results in potent anti-MM activity.15 Based on these data, we analyzed the correlation between drug sensitivity and messenger RNA (mRNA) levels of genes involved in Gln and Asn metabolism of MM cells by integrating publicly available compendia of gene expression data sets.36-38 As shown in Figure 1A and supplemental Figure 1, an increased expression of probe sets belonging to reported the ASNase signature36 was observed in more advanced disease phases, from monoclonal gammopathy of undetermined significance to plasma cell leukemia, as well as in human myeloma cell lines (HMCLs) compared with normal plasma cells, thus suggesting a positive correlation with disease progression. Next, expression levels of this signature were standardized using the z-score method, as previously reported39 (supplemental Figure 2). Importantly, by focusing on MM samples with available molecular data (n = 129; accession number GSE66293), we found that high z-score was most represented in patients carrying t(4;14), whereas t(11;14) was frequently observed among patients with a low-z score, suggesting ASNase as an exploitable therapeutic approach primarily for patients with poorer prognosis (Figure 1B). Next, we retrospectively analyzed the prognostic significance of baseline ASNase signature on the OS and PFS of 767 MM patients included in the MMRF CoMMpass Study (https://research.themmrf.org/). Remarkably, a significant inverse correlation between ASNase signature levels and clinical outcome was observed, with the high z-score group showing a significantly worse prognosis in comparison with the low z-score group, in terms of OS (P = .043) and PFS (P = .031) (Figure 1C). A recent comprehensive metabolomics analysis of the Cancer Cell Line Encyclopedia revealed that aberrant ASNS hypermethylation sensitizes subsets of cancers to ASNase therapy.40 To gain insights into MM cells, we examined DNA methylation status in published genome-wide methylation analyses performed on MM patients.27 As shown in Figure 1D, among the included ASNase signature genes, only ASNS and glutaminase 2 (GLS2) showed a significant inverse correlation between expression level and methylation status, suggesting that ASNase can suppress the growth of MM cell lines carrying low levels of ASNS and GLS2 mRNAs. To support this hypothesis, we evaluated the anti-MM activity of native E coli–derived ASNase and Erw-ASNase on a panel of MM cell lines with different genetic backgrounds. Importantly, both approaches resulted in reduced MM cell proliferation, although native E coli–derived ASNase had weaker activity than did Erw-ASNase (supplemental Figure 3). It is well known that ASNase treatment by depleting Gln (essential to maintain TCA cycle anaplerosis and support cell survival) leads to apoptosis of many cancer cells.41,42 Therefore, we measured Asn and Gln relative depletion following exposure to E coli–derived ASNase and Erw-ASNase. As shown in Figure 1E, both treatments resulted in substantial and immediate Asn depletion, whereas the effect on Gln levels was different. Indeed, although Erw-ASNase treatment resulted in its rapid depletion, minor changes in Gln levels were observed following exposure to E coli–derived ASNase. Collectively, these data are suggestive of drug-specific differences, leading us to hypothesize that dual Gln/Asn deprivation results in greater toxicity than single amino acid depletion. Indeed, withdrawal of each amino acid individually affected MM cell viability to a minimal extent, whereas Gln/Asn dual deprivation recapitulated Erw-ASNase anti-MM activity, thus supporting amino acid starvation as crucial for its activity (data not shown). To further enhance the clinical relevance of this observation, we performed an in vitro efficacy screening on several MM cell lines and primary tumor cells, confirming the antiproliferative activity of the investigated agent (Figure 1F), which, in line with other tumors,43 also resulted in c-Myc program impairment (cyclin downregulation and p21 activation) and cell cycle deregulation (with G0/G1 phase arrest) in MM cells (Figure 1G-H).

Metabolic landscape provides the biological rationale for amino acid–depletion therapies in MM. (A) Heat map showing expression levels for the probe sets corresponding to ASNase signature defined by Sugimoto et al36 in plasma cells from patients with monoclonal gammopathy of undetermined significance (MGUS), smoldering MM (SMM), active disease (MM), and plasma cell leukemia (PCL), as well as in HMCLs compared with normal plasma cells (accession numbers GSE66293 and GSE47552). The color scale spans the relative gene expression changes standardized on the variance. (B) Bar graph showing the frequency of primary patient MM samples included in GSE66293 with t(11;14) (left panel) and t(4;14) (right panel) displaying ASNase high vs low signature. The P value was calculated using Fisher’s exact test. (C) Kaplan-Meier survival curves on OS (left panel) and PFS (right panel) data for low and high z-scores of ASNase signature MM groups from CoMMpass study. Log-rank test P values and MM patients are stratified in each group, according to their risk at the time of diagnosis. (D) Waterfall plots showing ASNS and GLS2 mRNA levels related to their DNA methylation in MM patients.27 Each bar represents a tumor sample. The P values were calculated based on the Spearman correlations test (2-sided). Red indicates expression above the median, and blue indicates expression below the median. (E) Asn (upper panel) and Gln (lower panel) concentration, as measured in conditioned media collected at each time point from RPMI-8226 cells treated with 0.3 U/mL E coli ASNase or Erw-ASNase. Amino acid concentration was normalized to relative control. (F) Drug effects on the indicated MM cell lines treated with increasing doses of Erw-ASNase (0.1-3 U/mL for 48 hours). (G) MM.1S cells were treated with 0.5 U/mL Erw-ASNase at indicated time. Immunoblots for cMyc, CDK4, CDK6, and p21 are shown. γ-tubulin was used as loading control. (H) Cell cycle analysis of MM.1S cells at the indicated time points following Erw-ASNase treatment (0.5 U/mL), by flow cytometry. **P < .01, unpaired Student t test.
Metabolic landscape provides the biological rationale for amino acid–depletion therapies in MM. (A) Heat map showing expression levels for the probe sets corresponding to ASNase signature defined by Sugimoto et al36 in plasma cells from patients with monoclonal gammopathy of undetermined significance (MGUS), smoldering MM (SMM), active disease (MM), and plasma cell leukemia (PCL), as well as in HMCLs compared with normal plasma cells (accession numbers GSE66293 and GSE47552). The color scale spans the relative gene expression changes standardized on the variance. (B) Bar graph showing the frequency of primary patient MM samples included in GSE66293 with t(11;14) (left panel) and t(4;14) (right panel) displaying ASNase high vs low signature. The P value was calculated using Fisher’s exact test. (C) Kaplan-Meier survival curves on OS (left panel) and PFS (right panel) data for low and high z-scores of ASNase signature MM groups from CoMMpass study. Log-rank test P values and MM patients are stratified in each group, according to their risk at the time of diagnosis. (D) Waterfall plots showing ASNS and GLS2 mRNA levels related to their DNA methylation in MM patients.27 Each bar represents a tumor sample. The P values were calculated based on the Spearman correlations test (2-sided). Red indicates expression above the median, and blue indicates expression below the median. (E) Asn (upper panel) and Gln (lower panel) concentration, as measured in conditioned media collected at each time point from RPMI-8226 cells treated with 0.3 U/mL E coli ASNase or Erw-ASNase. Amino acid concentration was normalized to relative control. (F) Drug effects on the indicated MM cell lines treated with increasing doses of Erw-ASNase (0.1-3 U/mL for 48 hours). (G) MM.1S cells were treated with 0.5 U/mL Erw-ASNase at indicated time. Immunoblots for cMyc, CDK4, CDK6, and p21 are shown. γ-tubulin was used as loading control. (H) Cell cycle analysis of MM.1S cells at the indicated time points following Erw-ASNase treatment (0.5 U/mL), by flow cytometry. **P < .01, unpaired Student t test.
Dual Asn/Gln depletion plus low doses of Kar show potent synergistic anti-MM activity
It has been reported that PI resistance is associated with cellular bioenergetics changes that favor the increased use of mitochondrial respiration for energy production.18,44 Therefore, mitochondrial respiration may represent an innovative vulnerability for this setting. Considering that Gln fuels TCA-driver ATP synthesis in cancer cells, and mitochondria integrity is crucial for Erw-ASNase activity,45,46 we reasoned that its combination with PIs could be effective in MM cells. To test this hypothesis, gene expression profiles of NDMM samples with a high z-score (≥1; n = 36) were compared with those with a low z-score (≤−1; n = 33), using gene set enrichment analysis of a hallmark gene set collection.26 Several biological modules associated with oncogenic transcriptional programs (eg, unfolded protein response [UPR] stress, Myc, and glycolysis) were significantly enriched in the high z-score group. Among these pathways, UPR was the top ranked enriched (normalized enrichment score, 1.920; P < .0037; false discovery rate, 0.0081), suggesting an association between UPR and metabolism in MM (supplemental Figure 4). Expanding on this relationship, we investigated the therapeutic potential of Erw-ASNase in the presence of different doses of 4 PIs: bortezomib, Kar, ixazomib, and oprozomib (data not shown). Importantly, enhanced anti-MM activity of Erw-ASNase was observed with all PIs used, with Kar-based combinations showing the greatest efficacy, as revealed by isobologram and CI analyses (Figure 2A; supplemental Figure 5). A panel of primary tumor cells collected from newly diagnosed multiple myeloma (NDMM) and resistant/relapsed multiple myeloma (RRMM) (Kar resistant) patients further confirmed these data (Figure 2B). It is well known that the BM microenvironment has a role in promoting tumor growth, survival, and drug resistance.47,48 Thus, we studied the effect of the BM milieu on MM drug sensitivity by treating tumor cells in the presence of BM stromal cells (BMSCs) or their BM-derived cytokines (eg, interleukin-6 or IGF-1) (Figure 2C; supplemental Figure 6). As expected, the stromal cell compartment protected tumor cells from spontaneous apoptosis; however, more importantly, cotreatment also retained its efficacy in this context, with no significant effect on BMSC viability, further supporting the clinical relevance of this drug combination. Moreover, normal cells were largely unaffected by exposure to drug combinations at doses toxic for tumor cells, thus pointing to a favorable therapeutic index of such an approach (Figure 2D). Next, the molecular mechanism through which drug combinations trigger synergistic anti-MM cytotoxicity was investigated. An increased number of apoptotic and dead cells, as measured by annexin V and propidium iodide staining, was observed after cotreatment, together with several apoptotic features, including caspase-3, caspase-9, and poly (AD-ribose) polymerase cleavage (Figure 2E-F). To formally support the role of amino acid depletion in observed synergism, we challenged MM amino acid–starved cells with Kar at single dose. Remarkably, single amino acid depletion did not recapitulate the anti-MM effect observed with Erw-ASNase, whereas Asn/Gln dual–depleted MM cells were more vulnerable to PI treatment, as suggested by the appearance of apoptotic features (Figure 2G; supplemental Figure 7). Altogether, these data confirm the critical role played by dual amino acid depletion in the anti-MM activity of Erw-ASNase, as well as its potential to enhance the efficacy of Kar-based regimens.
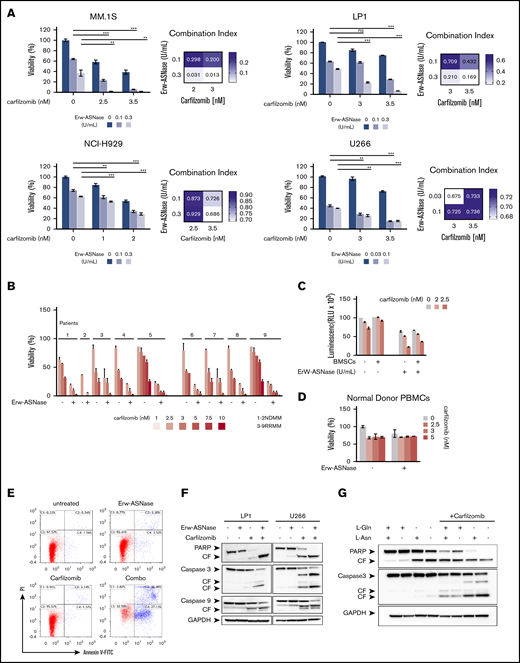
Anti-MM activity of dual Asn/Gln depletion plus Kar. MM cell lines (A) and primary CD138+ cells (NDMM and RRMM) (B) were treated with ASNase, Kar, or their combination. Cell viability was measured and presented as a percentage of control cells (untreated). Synergism was calculated by CI analysis, with heat maps depicting the CI values at increasing doses of Erw-ASNase and Kar. CIs were generated with CalcuSyn software for each drug combination. CI < 1, CI = 1, and CI > 1 denote synergism, additive effect, and antagonism, respectively. Data are mean ± SD (n = 3). (C) Viability of U266 NanoLuc+ cells treated with Erw-ASNase, Kar, or their combination for 48 hours, alone and in the presence of MM patient–derived BMSCs (gray), measured by luciferase-based luminescence assay. Data are mean ± SD in all graphs (n = 3). (D) Healthy donor PBMCs were exposed to increased doses of each drug, alone or in combination, and viability was measured using an MTS assay. (E) LP1 cells were treated with Erw-ASNase (0.5 U/mL), Kar (3 nM), or both. Apoptotic cell death was assessed by flow cytometry using annexin V and propidium iodide double staining after 48 hours. (F) Immunoblots for PARP1, caspase-3, caspase-9, and GAPDH on the indicated MM cell lines at 24 hours posttreatment with Erw-ASNase (0.5 U/mL), Kar (5 nM), or both. (G) Western blot showing that amino acid depletion recapitulates apoptotic features triggered by Erw-ASNase treatment on Kar-exposed U266 cells. Cleavage of PARP1, caspase-3, caspase-9, and GAPDH (loading control) was detected. One representative western blot of 3 is shown. **P < .01, ***P < .0001, unpaired Student t test. ns, not significant.
Anti-MM activity of dual Asn/Gln depletion plus Kar. MM cell lines (A) and primary CD138+ cells (NDMM and RRMM) (B) were treated with ASNase, Kar, or their combination. Cell viability was measured and presented as a percentage of control cells (untreated). Synergism was calculated by CI analysis, with heat maps depicting the CI values at increasing doses of Erw-ASNase and Kar. CIs were generated with CalcuSyn software for each drug combination. CI < 1, CI = 1, and CI > 1 denote synergism, additive effect, and antagonism, respectively. Data are mean ± SD (n = 3). (C) Viability of U266 NanoLuc+ cells treated with Erw-ASNase, Kar, or their combination for 48 hours, alone and in the presence of MM patient–derived BMSCs (gray), measured by luciferase-based luminescence assay. Data are mean ± SD in all graphs (n = 3). (D) Healthy donor PBMCs were exposed to increased doses of each drug, alone or in combination, and viability was measured using an MTS assay. (E) LP1 cells were treated with Erw-ASNase (0.5 U/mL), Kar (3 nM), or both. Apoptotic cell death was assessed by flow cytometry using annexin V and propidium iodide double staining after 48 hours. (F) Immunoblots for PARP1, caspase-3, caspase-9, and GAPDH on the indicated MM cell lines at 24 hours posttreatment with Erw-ASNase (0.5 U/mL), Kar (5 nM), or both. (G) Western blot showing that amino acid depletion recapitulates apoptotic features triggered by Erw-ASNase treatment on Kar-exposed U266 cells. Cleavage of PARP1, caspase-3, caspase-9, and GAPDH (loading control) was detected. One representative western blot of 3 is shown. **P < .01, ***P < .0001, unpaired Student t test. ns, not significant.
Combining Kar and Erw-ASNase results in intracellular energy shortage via substantial mitochondria impairment
To gain further insights into the specific mechanism of action in investigated combinations, we tested each drug target individually. Previous reports suggest the crucial role played by metabolic pathways in Myc-driven cancers,49 with this oncogene driving elements involved in glycolysis and glutaminolysis. Thus, we first explored the effects of nutrient deprivation on this oncogenic program. As shown in Figure 3A, the drug combination resulted in marked reduction of c-Myc, as well as its related proteins, compared with either agent alone, suggesting that this approach is able to switch off a crucial player in cancer cell survival.50 To confirm these findings, different models were used by choosing the U266 cell line, which expresses MYCL (L-Myc) and does not have a genomic rearrangement affecting the Myc locus or Myc overexpression.51,52 Unfortunately, despite its reported role in nutrient deprivation, cMyc overexpression did not rescue synergistic activity observed in MM cells (Figure 3B). Similarly, the addition of bromodomain inhibitor JQ1 did not impact the antitumor activity of this drug combination (supplemental Figure 8), suggesting the presence of different players. Overall, these data rule out the relevance of oncogenic c-Myc in the anti-MM activity of Kar and Erw-ASNase combination.
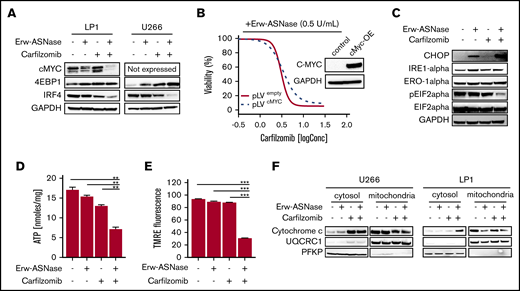
Kar combined with Erw-ASNase results in massive mitochondria impairment. (A) LP1 and U266 cells were treated with Erw-ASNase (0.5 U/mL), Kar (3 nM), or both for 48 hours. Then cells were harvested, and whole-cell lysates were subjected to immunoblot analysis using anti–c-Myc, anti-4EBP1, anti-IRF4, or anti-GAPDH (loading control). (B) Isogenic U266 cells (pLVempty) or c-Myc–overexpressing (pLVcMyc-OE) cells were treated with Erw-ASNase (0.5 U/mL), Kar (0-2 nM), or both for 48 hours. Cell viability was measured using an MTS assay and is presented as a percentage of control. Inset shows immunoblot for c-Myc protein levels in tested cell lines. (C) Western blot analysis of LP1 cells shows that 24-hour treatment with Erw-ASNase (0.5 U/mL), Kar (3 nM), or both results in ER stress pathway boosting. (D) LP1 cell line was treated with Erw-ASNase (0.5 U/mL), Kar (2 nM), or combined therapy for 48 hours. Then cells were harvested, and intracellular ATP levels were measured using a sensitive enzyme cyclic assay. All data are mean ± SD of 3 independent experiments. (E) TMRE peak M2 detects signal from polarized mitochondria upon 48 hours of drug exposure (used as single agents or in combination) in U266 cells. All data are mean ± SD of 3 independent experiments. (F) Cytochrome c release from mitochondria was assessed using western blot analysis of subcellular fractions of the indicated MM cells treated with Erw-ASNase (0.5 U/mL), Kar (3 nM), or their combination for 24 hours. Then cytoplasmic and mitochondria extracts were subjected to western blotting using the indicated antibodies. The quality check for each subcellular fraction was performed using specific cytosolic (PFKP) or mitochondrial (UQRC1) markers. **P < .01, ***P < .0001, unpaired Student t test.
Kar combined with Erw-ASNase results in massive mitochondria impairment. (A) LP1 and U266 cells were treated with Erw-ASNase (0.5 U/mL), Kar (3 nM), or both for 48 hours. Then cells were harvested, and whole-cell lysates were subjected to immunoblot analysis using anti–c-Myc, anti-4EBP1, anti-IRF4, or anti-GAPDH (loading control). (B) Isogenic U266 cells (pLVempty) or c-Myc–overexpressing (pLVcMyc-OE) cells were treated with Erw-ASNase (0.5 U/mL), Kar (0-2 nM), or both for 48 hours. Cell viability was measured using an MTS assay and is presented as a percentage of control. Inset shows immunoblot for c-Myc protein levels in tested cell lines. (C) Western blot analysis of LP1 cells shows that 24-hour treatment with Erw-ASNase (0.5 U/mL), Kar (3 nM), or both results in ER stress pathway boosting. (D) LP1 cell line was treated with Erw-ASNase (0.5 U/mL), Kar (2 nM), or combined therapy for 48 hours. Then cells were harvested, and intracellular ATP levels were measured using a sensitive enzyme cyclic assay. All data are mean ± SD of 3 independent experiments. (E) TMRE peak M2 detects signal from polarized mitochondria upon 48 hours of drug exposure (used as single agents or in combination) in U266 cells. All data are mean ± SD of 3 independent experiments. (F) Cytochrome c release from mitochondria was assessed using western blot analysis of subcellular fractions of the indicated MM cells treated with Erw-ASNase (0.5 U/mL), Kar (3 nM), or their combination for 24 hours. Then cytoplasmic and mitochondria extracts were subjected to western blotting using the indicated antibodies. The quality check for each subcellular fraction was performed using specific cytosolic (PFKP) or mitochondrial (UQRC1) markers. **P < .01, ***P < .0001, unpaired Student t test.
MM is a plasma cell tumor that is characterized by a high protein degradation burden and requires strict endoplasmic reticulum (ER) quality control. As result, ER and UPR targeting is a well-known therapeutic approach, as suggested by the clinical benefits of PI-based strategies.53
In keeping with these observations, we hypothesized that Erw-ASNase enhances the Kar anti-MM activity by boosting ER stress. ER was investigated by measuring IRE-1α, Ero1-α, and phosphorylation of translation initiation factor eIF2α levels by western blot analysis. As predicted, cotreatment resulted in a greater increase in CHOP with a dephosphorylated state of eIF2α levels compared with single-agent treatments (Figure 3C). Therefore, alterations in protein homeostasis and eIF2α phosphorylation status by cotreatment appear to contribute to MM cell death. Moreover, considerable misfolded protein accumulation, detected as high molecular weight adducts smear, was also observed in cells treated with Erw-ASNase plus Kar (data not shown). Collectively, these findings suggest a role for ER stress and unfolded protein accumulation in the anti-MM activity triggered by this drug combination.
It is well known that PI-mediated cytotoxicity largely relies on the depletion of intracellular energy stores of ATP and NAD, which, in turn, ultimately leads to the inhibition of proteasome activity.20 Using a cycling enzymatic assay, we monitored the metabolic changes occurring in MM cells following exposure to Erw-ASNase, Kar, and their combinations. In line with previous observations,54 single-agent treatment resulted in weak ATP and NAD intracellular content shortage, whereas cotreatment resulted in substantial energy depletion (Figure 3D; supplemental Figure 9A). Based on these results, we investigated the role of NAD depletion by rescuing its shortage with exogenous supplementation. Unfortunately, NAD supplementation failed to protect MM cells from drug-induced apoptosis (supplemental Figure 9B), ruling out a causative role for intracellular energy depletion in the anti-MM activity of the tested combination. Mitochondria are a primary source of energy and power; their targeting is emerging as an exciting approach, primarily in PI-resistant MM cells, which are reported to be enriched with mitochondrial biomarkers and respiratory rates.18 Accordingly, we reasoned that these organelles may have a role in synergism. To test this assumption, we sought to determine whether dual-drug exposure resulted in mitochondrial damage. As shown in Figure 3E and 3F, single-agent treatment did not affect the integrity of mitochondrial membranes; in contrast, the combination resulted in significant mitochondrial depolarization, as well as the release of mitochondria-resident proteins (cytochrome c). Overall, these data suggest that Erw-ASNase synergizes with Kar by disrupting the integrity of mitochondria MM cells.
Cotreatment impairs HR and triggers DNA damage accumulation in MM cells
Ongoing cross talk between cellular metabolism and the DNA damage repair pathway has been demonstrated, yielding opportunities to investigate these vulnerabilities in tumors.55,56 To test the impact of Erw-ASNase plus Kar on the genomic integrity of MM cells, we first evaluated whether these stimuli lead to accumulation of DNA damage. Importantly, this approach resulted in a marked accumulation of low molecular weight protein γH2A.X compared with specific controls, as assessed by western blotting (Figure 4A), as well as immunofluorescence analysis (Figure 4B). To evaluate whether a putative impairment in DNA repair processes was also involved, we screened several pathways associated with DNA repair. As shown in Figure 4C, Erw-ASNase plus Kar treatment resulted in significant inhibition of Fanconi anemia/BRCA pathway–related genes (FANCD2 and BRCA1 among others), as well as DNA damage response (DDR) genes (eg, RAD51). In line with these data, we also observed a reduction in RAD51, together with increased RPA32 and ATR phosphorylation, which are a DNA damage sensor protein and effector of DNA-repair mechanisms, respectively (Figure 4C). This effect was also accompanied by inefficient HR-mediated repair activity (Figure 4D). These data suggest that amino acid starvation makes MM cells more vulnerable to Kar activity, also by impairing the efficiency of DNA-repair mechanisms, which, in turn, results in a greater degree of DNA damage.

Cotreatment triggers DNA damage accumulation in MM cells. (A) Western blot analysis of γ-H2A.X in the indicated MM cell lines treated with Erw-ASNase (0.5 U/mL), Kar (3 nM), or their combination for 24 hours. GAPDH was used as loading control. (B) Immunofluorescence staining of γ-H2A.X in treated LP1 cells (left panels). The number of γH2AX foci per cell was quantified and is shown normalized to control (right panel). Magnification ×40. (C) Western blots showing DNA damage and DDR pathway deregulation of LP1 cells after drug treatment (left panels). Quantification of each signal is shown normalized to γ-tubulin as loading control (right panel). (D) HR activity of U266 after the indicated drug treatment. Cells were treated for 6 hours, nucleofected with dl1 and dl2 plasmids (250 ng each), and treated for an additional 20 hours. Next, DNA was extracted, and qPCR was performed. 2^DDCt was used to quantitate HR activity (assay vs universal mix, according to the manufacturer’s instructions). Data in panels B and D are mean ± SD of 3 independent experiments. *P < .05, ** P < .01, ***P < .0001, unpaired Student t test.
Cotreatment triggers DNA damage accumulation in MM cells. (A) Western blot analysis of γ-H2A.X in the indicated MM cell lines treated with Erw-ASNase (0.5 U/mL), Kar (3 nM), or their combination for 24 hours. GAPDH was used as loading control. (B) Immunofluorescence staining of γ-H2A.X in treated LP1 cells (left panels). The number of γH2AX foci per cell was quantified and is shown normalized to control (right panel). Magnification ×40. (C) Western blots showing DNA damage and DDR pathway deregulation of LP1 cells after drug treatment (left panels). Quantification of each signal is shown normalized to γ-tubulin as loading control (right panel). (D) HR activity of U266 after the indicated drug treatment. Cells were treated for 6 hours, nucleofected with dl1 and dl2 plasmids (250 ng each), and treated for an additional 20 hours. Next, DNA was extracted, and qPCR was performed. 2^DDCt was used to quantitate HR activity (assay vs universal mix, according to the manufacturer’s instructions). Data in panels B and D are mean ± SD of 3 independent experiments. *P < .05, ** P < .01, ***P < .0001, unpaired Student t test.
The anti-MM activity of Erw-ASNase plus Kar is mediated by oxidative stress and Nrf2 deregulation
One of the mechanisms by which DNA damage occurs is via induction of oxidative stress.56-58 Indeed, novel compounds exploiting reactive oxygen species (ROS) induction for cancer treatment have recently been described.59 To formally demonstrate the role played by oxidative stress in the observed synergism, we pretreated MM cells with an antioxidant reagent N-acetyl-l-cysteine (NAC), which scavenges ROS by replenishing glutathione stores. As shown in Figure 5A and B and supplemental Figure 10A and B, this approach resulted in a complete rescue in term of viability and apoptotic features of exposed cells; more importantly, it resulted in improved DNA stability and mitochondrial membrane integrity, as suggested by reduced γ-H2A.X levels and cytochrome c release, respectively, compared with control. Overall, these data suggest that oxidative stress mediates the cytotoxic effect of Erw-ASNase plus Kar combination by eliciting DNA damage, which, in turn, is further enhanced by impairment of the efficiency of DNA-repair mechanisms. Indeed, by using a qPCR-based strategy, we observed that cotreatment led to significant upregulation of oxidative stress–related genes (Figure 5C; supplemental Figure 10C). To directly assess whether increased ROS production is a causative or a secondary event in Erw-ASNase-induced sensitization to Kar, we evaluated the effect of different antioxidants on the observed synergism. NAC, as well as GSH (supplemental Figure 11A), was able to hamper the antitumor activity of cotreatment. Overall, these results indicate that mitochondrial ROS production and redox alterations represent a central mechanism through which the Erw-ASNase and Kar combination kills MM cells. Cellular ROS originates from peroxisomes, ER, and mitochondria, with mitochondria representing the predominant source.58 Therefore, we next sought to determine whether cotreatment triggered ROS via mitochondria. As observed, the drug combination significantly increased mitochondrial depolarization, suggesting a prominent role for these organelles as a source of the increased ROS triggered by the drug combination. Indeed, a significant increase in mitochondrial superoxide levels was similarly observed in Erw-ASNase–exposed, as well as Asp/Gln-depleted, MM cells following Kar treatment (Figure 5D-E; supplemental Figure 11B). Importantly, these results indicate that cotreatment regulates ROS levels by modulating mitochondria activity, as suggested by the weakened effects observed in MM cells overexpressing mitochondria-targeted catalase60 (Figure 5F; supplemental Figure 12).

ROS mediate sensitization of Erw-ASNase–treated MM cells to Kar. (A) U266 cells were incubated or not with NAC (5 mM) for 2 hours and treated, in the presence or absence, with Erw-ASNase (0.5 U/mL), Kar (2.5 nM), or both. Cell death was assessed by flow cytometry using annexin V (AV) and propidium iodide (PI) double staining after 48 hours. One representative experiment of 3 is shown. (B) Western blot showing that NAC pretreatment (5 mM) rescues proapoptotic features triggered by Erw-ASNase treatment on Kar-exposed U266 cells. Cleavage of PARP1, caspase-3, caspase-9, NRF2, IRF4, γ-H2A.X, and GAPDH (loading control) was assessed. One representative western blot of 3 is shown. (C) qPCR analysis for oxidative stress–induced genes in U266 cells treated with Erw-ASNase (0.5 U/mL), Kar (2.5 nM), or both. The dashed red line indicates the reference level of DMSO-treated cells. (D) MitoSOX staining on U266 cells upon Erw-ASNase treatment (0.5 U/mL), with or without Kar (5 nM) treatment, was evaluated by flow cytometry 28 hours posttreatment. All data are mean ± SD of 3 independent experiments. (E) U266 cells were incubated or not with NAC (5 mM) for 2 hours and then treated, in the presence or absence of NAC, with Erw-ASNase (0.5 U/mL), Kar (3 nM), or both. Mitochondrial superoxide levels were detected by immunofluorescence 24 hours later (left panels). Signals from MitoSOX staining were quantitated with ImageJ software and normalized to control (right panel). One representative experiment of 3 is shown. Magnification ×20. (F) Cell death of mitochondria-targeted catalase (mitoCat) and empty vector–overexpressing LP1 cells treated with the indicated stimuli (0.5 U/mL Erw-ASNase and 3 nM Kar). Cell death was assessed by flow cytometry using annexin V (AV) and propidium iodide (PI) double staining after 48 hours. The percentage of early apoptotic cells (AV+/PI−) are shown as white columns; late apoptotic cells (AV+/PI+) are shown as gray columns. One representative experiment of 3 is shown. *P < .05, **P < .01, ***P < .001, Student t test.
ROS mediate sensitization of Erw-ASNase–treated MM cells to Kar. (A) U266 cells were incubated or not with NAC (5 mM) for 2 hours and treated, in the presence or absence, with Erw-ASNase (0.5 U/mL), Kar (2.5 nM), or both. Cell death was assessed by flow cytometry using annexin V (AV) and propidium iodide (PI) double staining after 48 hours. One representative experiment of 3 is shown. (B) Western blot showing that NAC pretreatment (5 mM) rescues proapoptotic features triggered by Erw-ASNase treatment on Kar-exposed U266 cells. Cleavage of PARP1, caspase-3, caspase-9, NRF2, IRF4, γ-H2A.X, and GAPDH (loading control) was assessed. One representative western blot of 3 is shown. (C) qPCR analysis for oxidative stress–induced genes in U266 cells treated with Erw-ASNase (0.5 U/mL), Kar (2.5 nM), or both. The dashed red line indicates the reference level of DMSO-treated cells. (D) MitoSOX staining on U266 cells upon Erw-ASNase treatment (0.5 U/mL), with or without Kar (5 nM) treatment, was evaluated by flow cytometry 28 hours posttreatment. All data are mean ± SD of 3 independent experiments. (E) U266 cells were incubated or not with NAC (5 mM) for 2 hours and then treated, in the presence or absence of NAC, with Erw-ASNase (0.5 U/mL), Kar (3 nM), or both. Mitochondrial superoxide levels were detected by immunofluorescence 24 hours later (left panels). Signals from MitoSOX staining were quantitated with ImageJ software and normalized to control (right panel). One representative experiment of 3 is shown. Magnification ×20. (F) Cell death of mitochondria-targeted catalase (mitoCat) and empty vector–overexpressing LP1 cells treated with the indicated stimuli (0.5 U/mL Erw-ASNase and 3 nM Kar). Cell death was assessed by flow cytometry using annexin V (AV) and propidium iodide (PI) double staining after 48 hours. The percentage of early apoptotic cells (AV+/PI−) are shown as white columns; late apoptotic cells (AV+/PI+) are shown as gray columns. One representative experiment of 3 is shown. *P < .05, **P < .01, ***P < .001, Student t test.
Cancer cells tightly regulate ROS levels via various antioxidant pathways.61 Among these, nuclear factor erythroid 2-related factor 2 (Nrf2) represents a critical redox sensor and a master regulator of the cellular antioxidant system.62 Recent data suggest that the oxidative stress–protective transcription factor Nrf2 and its target genes play an important role in protection from endogenous and drug-induced oxidative stress in cancer cells.63-65 Thus, the activation of Nrf2 observed after cotreatment (Figure 5B) may represent an attempt by tumor cells to compensate for the oxidative stress triggered by this strategy. To support this hypothesis, we tested the effect of Nrf2 depletion on the anti-MM activity of Erw-ASNase plus Kar treatment. As shown in supplemental Figure 13, this strategy resulted in dampened anti-MM activity, implicating Nfr2 in the mitochondrial oxidative stress triggered by the drug exposure. Altogether, our data suggest that ROS-mediated apoptosis triggered by Erw-ASNase plus Kar treatment may represent a novel therapeutic strategy for MM patients.
Kar resistance elicits an unforeseen metabolic vulnerability in MM cells
A crucial goal for antitumor therapies is to enhance the efficacy of clinically used drugs. Therefore, the identification of a novel strategy to synergize with already used agents and avoid resistance remains a long-standing goal. Recently, it has been proposed that Kar-resistant MM cells exhibit a metabolic switch that could be targeted by affecting the mitochondrial apparatus.44,66 Therefore, we analyzed the expression levels of amino acid–related genes in paired Kar-sensitive and Kar-resistant MM cell lines. Interestingly, as shown in Figure 6A, AMO-1 Kar/R cells displayed lower GLS1, GLS2, ASCT2, ASNS, SNAT1, and GLUL expression compared with parental wild-type cells. A similar trend specific for GLS1 expression was observed in CD138+ cells from RRMM patients (Kar/R), in contrast with those collected from an NDMM patient (Kar/S), suggesting differences in these subsets (Figure 6B). Consistent with these data, Erw-ASNase treatment resulted in significantly greater toxicity for resistant cells compared with isogenic cells, suggesting that this approach is able to affect the response of MM cells to Kar (Figure 6C). Based on previous observations,40 we next examined the DNA methylation status of these genes in Kar-resistant and Kar-sensitive cell lines; surprisingly, no correlation with gene expression level was observed, suggesting alternative epigenetic modulations (data not shown). Collectively, these results, beyond supporting the high energy demand of Kar-resistant MM cells,66 support amino acid depletion as a promising approach to eradicate Kar-refractory MM cells.

Kar resistance elicits an unforeseen metabolic vulnerability in MM cells. (A) qPCR analysis of the indicated genes in AMO-1 cells was performed by comparing isogenic wild-type (Kar/S) and Kar-resistant (Kar/R) cells. (B) Violin plot representing GLS1 expression level in tumor cells derived from NDMM (Kar/S) and RRMM (Kar/R) patients. (C) Dose-response curves of AMO-1 Kar/S and Kar/R cells to increasing doses of Erw-ASNase (0.1-0.5 U/mL for 48 hours). All data are mean ± SD of 3 independent experiments. **P < .01, ***P < .001, Student t test.
Kar resistance elicits an unforeseen metabolic vulnerability in MM cells. (A) qPCR analysis of the indicated genes in AMO-1 cells was performed by comparing isogenic wild-type (Kar/S) and Kar-resistant (Kar/R) cells. (B) Violin plot representing GLS1 expression level in tumor cells derived from NDMM (Kar/S) and RRMM (Kar/R) patients. (C) Dose-response curves of AMO-1 Kar/S and Kar/R cells to increasing doses of Erw-ASNase (0.1-0.5 U/mL for 48 hours). All data are mean ± SD of 3 independent experiments. **P < .01, ***P < .001, Student t test.
Discussion
During last decade, significant advances have been achieved in the management of MM patients, also thanks to the introduction of novel therapies. However, current strategies face the challenges of significant side effects, frequent relapses, and drug resistance, making MM still difficult to treat.1-3,67 As a result, the introduction of novel strategies to improve treatment efficacy and reduce toxicity remains an unmet medical need.
It is well known that cancer cells carry several changes to support their growth and proliferation, including metabolic reprogramming, which represents a human cancer hallmark.68 As a result, targeting metabolic tumor-specific mechanisms represents an intriguing strategy, as suggested by inhibitors targeting IDH1, as well as folate and thymidine metabolism.69 In such a scenario, MM cells reprogram their own metabolism by leveraging glucose and Gln to sustain proliferation and survival, thus making their depletion an attractive novel approach in this setting as well.15,70,71 ASNase is a bacterial-derived enzyme that induces serum amino acid depletion by L-Asn and L-Gln hydrolysis. ASNase is a cornerstone drug in the modern treatment of acute lymphoblastic leukemia and also has been used in other malignancies with significant clinical results.13,72,73 However, toxicity and resistance represent challenges associated with this therapy, thus encouraging alternative strategies. A comprehensive metabolome screen on Cancer Cell Line Encyclopedia has recently revealed the landscape of cancer metabolism, showing that aberrant ASNS hypermethylation sensitizes subsets of cancers to ASNase therapy.40 In support of this notion, we observed that DNA methylation status is significantly associated with reduced expression of ASNase signature–related genes in MM cells, suggesting high ASNase sensitivity also in this context. Based on these findings, an in vitro efficacy screening revealed potent anti-MM activity of Erw-ASNase with cell-cycle deregulation and c-Myc program impairment, as reported for other Gln depletion–based strategies.74 Of note, metabolic reprogramming achieved by Erw-ASNase resulted in significant increment of Kar anti-MM activity but spared normal PBMCs. Although previous reports suggest that cMyc regulates the transcriptional program involved in amino acid–depletion strategies,75,76 inhibition or cMyc overexpression did not modify the anti-MM activity of these drug combination, indicating that additional mechanisms are accountable for the observed synergism. Indeed, we identified an increased mitochondrial ROS generation, compounded mitochondrial damage and antioxidant system Nrf2 deregulation as key events. Therefore, metabolic reprogramming targeting with Erw-ASNase makes MM cells more vulnerable to proteasome inhibition by increasing oxidative stress related-pathways and ROS levels (Figure 7).
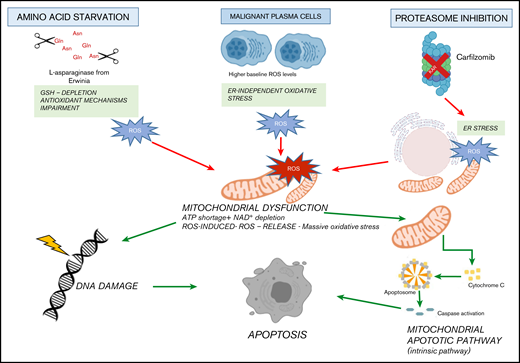
Proposed model. Amino acid starvation induced by Erw-ASNase primes MM cell vulnerability to proteasome inhibition. Mechanistically, the combination of proteasome inhibition and amino acid starvation affects the mitochondrial compartment, resulting in metabolic failure and significant ROS generation. Moreover, by leading to DNA damage, these events result in substantial MM cell death.
Proposed model. Amino acid starvation induced by Erw-ASNase primes MM cell vulnerability to proteasome inhibition. Mechanistically, the combination of proteasome inhibition and amino acid starvation affects the mitochondrial compartment, resulting in metabolic failure and significant ROS generation. Moreover, by leading to DNA damage, these events result in substantial MM cell death.
Based on previous data,40 parallel methylation and gene expression analyses were performed on Kar-sensitive and Kar-resistant MM cell lines (data not shown). Surprisingly, although resistant cells exhibited reduced ASNS mRNA expression, no differences were observed in gene promoter methylation suggesting alternative epigenetic modulations responsible for higher Erw-ASNase sensitivity observed in Kar-resistant cells. MM patients’ resistant to bortezomib-based treatment regimen are found to express higher levels of mitochondrial biomarkers compared with responders, thus suggesting mitochondrial respiration as a novel target for therapeutic advances. Indeed, glutaminase inhibitor CB-839 has recently been shown to resensitize PI-resistant MM cells in preclinical models.18 As a result, our strategy to combine already-used clinical drugs, both with favorable therapeutic indices, appears to assure a clinical benefit for RRMM patients who have previously been exposed to different lines of therapies, including Kar-based regimens. Ongoing genetic instability is a feature of clonal plasma cell neoplasms, resulting in complex genetic changes associated with disease progression. The mechanisms causing this instability are largely unknown, but a correlation between metabolic abnormalities and DNA damage response dysfunction has recently been demonstrated.56,62-64 In line with these observations, high genomic instability and impaired DNA repair were observed in MM cells treated with Erw-ASNase plus Kar, further supporting the synergistic activity of this drug combination.
Overall, we demonstrate that Erw-ASNase treatment, by deregulating the amino acid metabolic program, makes MM cells more vulnerable to Kar and we provide proof of concept for this combination as a novel strategy in the clinical setting. Notably, because each drug has already been evaluated in clinical trials, our results can be rapidly translated into potential clinical benefits for RRMM patients, thus supporting a bench-to-bedside strategy.
Data sharing requests should be sent to Michele Cea (michele.cea@unige.it).
Acknowledgments
The authors thank Jazz Pharmaceuticals for generously providing Erw-ASNase for this study.
This work was supported in part by Fondazione Associazione Italiana per la Ricerca sul Cancro (IG #23438 [M.C.] and MYFG #21552 [A.C.]), the Italian Ministry of Health (GR-2016-02361523) (A.C.), Associazione Italiana Leucemie Linfomi e Mieloma (AIL sezione di Genova), and the University of Genoa.
Authorship
Contribution: D.S., P.M. and M.C. designed the research, performed experiments, analyzed the data, and wrote the manuscript; S.B., M.Z., and T.C., performed experiments and analyzed the data; V.F., C.M., F.G., P.C., M.M., G.R., S.A., A.D., P.B., and A.C. performed experiments; A. Neri, K.T., and G.C. performed genomic analyses; M.P. performed immunofluorescence analysis; A. Nencioni provided patient samples; and R.M.L. revised the manuscript.
Conflict-of-interest disclosure: The authors declare no competing financial interests.
Correspondence: Michele Cea, Department of Internal Medicine and Specialities (DiMI), University of Genoa, Viale Benedetto XV n.6, 16132 Genoa, Italy; e-mail: michele.cea@unige.it.

