

Key Points
Characteristic clinical, electroencephalographic, and radiological features are observed in patients with LBCL who develop ICANS.
Survival outcomes are worse for patients with LBCL who develop high-grade ICANS.

Abstract
Neurotoxicity or immune effector cell-associated neurotoxicity syndrome (ICANS) is the second most common acute toxicity after chimeric antigen receptor (CAR) T-cell therapy. However, there are limited data on the clinical and radiologic correlates of ICANS. We conducted a cohort analysis of 100 consecutive patients with relapsed or refractory large B-cell lymphoma (LBCL) treated with standard of care axicabtagene ciloleucel (axi-cel). ICANS was graded according to an objective grading system. Neuroimaging studies and electroencephalograms (EEGs) were reviewed by an expert neuroradiologist and neurologist. Of 100 patients included in the study, 68 (68%) developed ICANS of any grade and 41 (41%) had grade ≥3. Median time to ICANS onset was 5 days, and median duration was 6 days. ICANS grade ≥3 was associated with high peak ferritin (P = .03) and C-reactive protein (P = .001) levels and a low peak monocyte count (P = .001) within the 30 days after axi-cel infusion. Magnetic resonance imaging was performed in 38 patients with ICANS and revealed 4 imaging patterns with features of encephalitis (n = 7), stroke (n = 3), leptomeningeal disease (n = 2), and posterior reversible encephalopathy syndrome (n = 2). Abnormalities noted on EEG included diffuse slowing (n = 49), epileptiform discharges (n = 6), and nonconvulsive status epilepticus (n = 8). Although reversible, grade ≥3 ICANS was associated with significantly shorter progression-free (P = .02) and overall survival (progression being the most common cause of death; P = .001). Our results suggest that imaging and EEG abnormalities are common in patients with ICANS, and high-grade ICANS is associated with worse outcome after CAR T-cell therapy in LBCL patients.
Introduction
Anti-CD19 chimeric antigen receptor (CAR) T-cell therapies, such as axicabtagene ciloleucel (axi-cel) and tisagenlecleucel, can induce durable remissions in patients with refractory B-cell malignancies, including large B-cell lymphoma (LBCL) and B-cell acute lymphoblastic leukemia (B-ALL).1-3 However, they are also associated with acute toxicities, such as cytokine release syndrome (CRS) and neurotoxicity, the latter also referred to as immune effector cell-associated neurotoxicity syndrome (ICANS).4 Although CRS is the most common acute toxicity after CAR T-cell therapy, neurotoxicity is also frequently observed. Neurotoxicity typically presents as toxic encephalopathy, with word-finding difficulty, aphasia, altered level of consciousness, and impairment of cognitive skills, and in more severe cases, motor weakness, seizures, and cerebral edema. In the pivotal ZUMA-1 trial, in patients with LBCL treated with axi-cel, neurotoxicity of any grade was reported in 64% of patients and grade ≥3 in 32% as per the common terminology criteria for adverse events (CTCAE) v4.03.1,5 Using the same toxicity grading system, in the JULIET trial, the pivotal phase 2 study investigating the efficacy of tisagenlecleucel for the treatment of patients with LBCL, neurotoxicity of any grade was reported in 21% of patients and grade ≥3 in 12%.2 Although the clinical features of CRS have been well characterized, limited data exist for neurotoxicity.6-8
Low-grade neurotoxicity associated with CAR T-cell therapy is typically managed conservatively with supportive care; high-grade neurotoxicity may be treated with corticosteroids to mitigate the function of CAR T cells and other bystander immune cells, such as myeloid cells, that are likely activated after CAR T-cell infusion.9 Diagnostic workup, such as neuroimaging with computed tomography (CT) and/or magnetic resonance imaging (MRI) of the brain and electroencephalogram (EEG), is also frequently performed in patients with ICANS. However, there is very limited information available on the radiologic and electroencephalographic features associated with ICANS in patients with LBCL treated with axi-cel; the majority of data derives from studies including different cancer types and CAR T-cell products.6,10 Here, we report the results from a cohort analysis of 100 patients with relapsed or refractory LBCL treated at our institution with standard of care axi-cel, and describe the clinical, neuroradiologic, and electroencephalographic correlates of ICANS.
Methods
Patient selection
This is a cohort analysis of 100 consecutive patients with relapsed or refractory LBCL treated with standard of care axi-cel at our institution, The University of Texas MD Anderson Cancer Center, between January 2018 and May 2019. Standard of care was defined as administration of commercial product outside of a clinical trial. Data cutoff was 31 December 2019. Patients received lympho-depleting chemotherapy with cyclophosphamide (500 mg/m2) and fludarabine (30 mg/m2) administered IV on days −5, −4, and −3, followed by axi-cel infusion (2 × 10⁶/kg) on day 0. Antiseizure prophylaxis with levetiracetam was administered for all patients starting on day 0. The study was approved by the Institutional Review Board of MD Anderson Cancer Center and conducted in accordance with our institutional guidelines and the principles of the Declaration of Helsinki.
Serum studies, toxicity, and response assessment
The clinical characteristics before conditioning and laboratory features before conditioning and for 30 days after axi-cel infusion were confirmed by review of the medical records. Medical history of neurologic and/or psychiatric disease was based on the International Classification of Disease version 10, and all codes were included. CRS and ICANS were prospectively graded for up to 60 days after axi-cel infusion, according to the CAR toxicity (CARTOX) grading system. The latter assesses neurocognitive function based on a 10-point score, named CARTOX-10, and it attributes grade 3 or higher neurotoxicity also based on evidence of raised intracranial pressure either by ophthalmologic evaluation, cerebral spinal fluid opening pressure, and/or imaging evidence of cerebral edema; and based on onset of clinical or nonclinical seizure or focal motor weakness.9
Performance status was defined according to the Eastern Cooperative Oncology Group (ECOG).11 The international prognostic index (IPI) was calculated as previously described.12 All patients had preconditioning brain imaging, either by CT or MRI. All EEG and neuroimaging studies were reviewed by an expert neurologist and neuroradiologist, respectively. Performed EEG were standard 30-minute studies, except for patients noted to be in status epilepticus (in whom the duration was longer, to allow and monitor treatment). Nonconvulsive status epilepticus (NCSE) was defined according to Salzburg criteria.13 MRI of the brain with gadolinium contrast was performed according to institutional protocols. Accuracy of neuro-radiological findings was determined based on the availability of pretreatment scans for comparison and quality of images, to account for changes secondary to comorbid health conditions existing before axi-cel infusion. Response status was determined by Lugano 2014 classification.14 The neurologist and neuroradiologist were aware of the patient receiving CAR T-cell therapy but not of the CRS/ICANS scores at the time of interpretation. The neurologist was present to assess the clinical and EEG response to benzodiazepine in NCSE. Each study was read by 2 physicians specializing in neurology and/or neuroradiology.
Statistical methods
The association between categorical variables was evaluated using the χ2 test or Fisher’s exact test. The difference in a continuous variable between patient groups was evaluated by the Mann-Whitney U test. Only factors significant (P ≤ .05) on univariate analysis were included in multivariate models. The unpaired Student t test was used for median peak comparison. Association between continuous variables was assessed using the bivariate Pearson correlation.
Progression-free survival (PFS) was defined as the time from the start of axi-cel infusion to progression of disease, death, or last follow-up (whichever occurred first). Overall survival (OS) was defined as the time from the start of axi-cel infusion to death or last follow-up. Attribution of cause of death was determined by a multidisciplinary cellular therapy committee and reviewed and confirmed according to guidelines provided by the Foundation for Accreditation of Cellular therapy. PFS and OS were calculated for all patients in the study and for subgroups of patients using Kaplan-Meier estimates, and were compared between subgroups using the Gehan-Breslow-Wilcoxon test (to weight more for early events). Multivariable Cox regression analysis was performed to assess the associations between patient characteristics and PFS or OS. P ≤ .05 (2-tailed) was considered statistically significant. Statistical analyses were completed using SPSS 24 (IBM) and GraphPad Prism 8.
Results
Patient baseline characteristics and association with high-grade ICANS
One hundred patients with relapsed or refractory LBCL were included in the study, with a median age of 60 years (range, 18-85 years). Patients were heavily pretreated, with a median number of 4 previous lines of therapy (range, 2-15); 89 (89%) were refractory to at least 1 prior systemic treatment. Additional preconditioning baseline characteristics and laboratory values are shown in Table 1. Of interest, no patients had clinically active central nervous system (CNS) disease at time of axi-cel infusion.
Patient baseline characteristics before conditioning therapy and association with high-grade ICANS
| Baseline characteristics | Total (N = 100) | Grade 0-2 ICANS (n = 59) | Grade ≥3 ICANS (n = 41) | P |
|---|---|---|---|---|
| Age, median [range], y | 60 [18-85] | 60 [18-85] | 60 [24-85] | .94 |
| Male | 74 (74) | 46 (78) | 28 (68) | .36 |
| ECOG performance status >0 | 69 (69) | 36 (61) | 33 (80) | .05 |
| Diffuse LBCL* | 77 (77) | 47 (80) | 30 (73) | .70 |
| Ann Arbor stage III-IV | 84 (84) | 50 (85) | 34 (83) | 1 |
| IPI score 3-4 | 55 (55) | 28 (47) | 27 (66) | .10 |
| Prior neuro-psychiatric disease | 41 (41) | 26 (44) | 15 (37) | .54 |
| Disease site | ||||
| Head and neck involvement | 40 (40) | 22 (37) | 18 (44) | .54 |
| Bone marrow biopsy involvement | 22 (22) | 17 (29) | 5 (12) | .05 |
| Prior CNS lymphoma | 8 (8) | 3 (5) | 5 (12) | .27 |
| Previous treatment | ||||
| Previous therapies, median [range], n | 4 [2-15] | 4 [2-15] | 4 [2-11] | |
| Refractory disease | 89 (89) | 53 (90) | 36 (88) | .76 |
| Previous autologous SCT | 29 (29) | 16 (27) | 13 (32) | .66 |
| Previous CAR T therapy | 5 (5) | 4 (7) | 1 (2) | .65 |
| Blood counts, median [range] | ||||
| Absolute neutrophil count, ×109/L | 2.8 [0-20] | 2.8 [0-20] | 2.9 [0-18] | .86 |
| Absolute lymphocyte count, ×109/L | 0.6 [0-2] | 0.6 [0-2] | 0.5 [0-1.4] | .54 |
| Absolute monocyte count, ×109/L | 0.5 [0.02-2] | 0.6 [0.06-2] | 0.4 [0.02-1.4] | .22 |
| Hemoglobin, g/dL | 10 [5-16] | 10 [5-16] | 10 [6-14] | .59 |
| Platelet count, ×109/L | 141 [9-391] | 140 [9-391] | 141 [9-389] | .88 |
| Inflammatory markers, median [range] | ||||
| C-reactive protein, mg/L | 33 [0.3-284] | 23 [0.7-275] | 37 [0.3-284] | .44 |
| Ferritin, mg/L | 812 [13-38 964] | 690 [13-4395] | 1 088 [187-38 964] | .23 |
| Albumin, g/dL | 3.8 [2.4-4.9] | 3.9 [2.5-4.9] | 3.7 [2.4-4.6] | .04 |
| Disease burden markers, median [range] | ||||
| LDH fold increase above ULN | 1.4 [0-17.4] | 1.3 [0-8.4] | 1.6 [0.3-17.4] | .09 |
| LDH > ULN | 74 (74) | 41 (69) | 33 (80) | .25 |
| Renal function and electrolytes, median [range] | ||||
| Creatinine clearance, mL/min | 84 [35-152] | 86 [36-135] | 83 [35-152] | .57 |
| Magnesium, mg/dL | 2 [1-3.3] | 2 [1-2.7] | 1.9 [1.5-3.3] | .40 |
Values are n (%) except as noted. Range of normal for LDH was 313 to 618 U/L for the first 16 patients and 135 to 215 U/L for the subsequent 84. P value reflects comparison of grade 0-2 ICANS to grade ≥3 ICANS. Bold numbers indicate significant P values.
SCT, stem cell transplant; ULN, upper limit of normal.
Includes high-grade B-cell lymphoma compared with transformed follicular lymphoma and primary mediastinal B-cell lymphoma.
Ninety-seven (97%) patients had CRS of any grade, and 9 (9%) had grade ≥3; 68 (68%) patients had ICANS of any grade and 41 (41%) had grade ≥3 (high grade). ECOG performance status >0 (80% vs 61%, P = .05), low albumin levels (3.7 vs 3.9 g/dL, P = .04), and lack of bone marrow involvement by biopsy (12% vs 29%, P = .05) associated with a higher frequency of grade 3-4 ICANS compared with grade 0-2 ICANS (Table 1). None of the other baseline characteristics and preconditioning laboratory values shown in Table 1 were associated with a higher incidence of high-grade ICANS, including prior central nervous system lymphomatous involvement, prior neurologic and/or psychiatric disorder, and inflammatory markers (such as ferritin and C-reactive protein levels [CRP]).
Thirty-day ICANS trend and association with laboratory values
Median time to ICANS onset was 5 days (range, 0-25 days), and median ICANS duration was 6 days (range, 0-52 days; Figure 1A). Only 4 patients with ICANS had symptoms that persisted beyond day 30; no new cases developed after day 30. All ICANS events were reversible, except for 1 case of grade 5 status epilepticus occurring on day 51. A weak positive association between ICANS and CRS was observed (r = +0.36; P < .001).
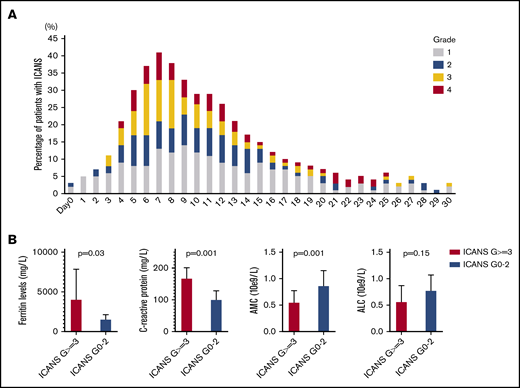
ICANS trends. (A) ICANS grade trend for all 100 patients for 30 days after axi-cel infusion. (B) Association between high-grade ICANS and 30-day peak of ferritin, C-reactive protein, absolute monocyte count, and absolute lymphocyte count.
ICANS trends. (A) ICANS grade trend for all 100 patients for 30 days after axi-cel infusion. (B) Association between high-grade ICANS and 30-day peak of ferritin, C-reactive protein, absolute monocyte count, and absolute lymphocyte count.
Given the general lack of association between high-grade ICANS and preconditioning laboratory values, their association with 30-day peak was evaluated for the following: ferritin and CRP as inflammatory markers, absolute monocyte count as myeloid cell marker, and absolute lymphocyte count (ALC), the latter representing a weak surrogate marker of CAR T-cell expansion. Compared with patients with grade 0-2 ICANS (n = 59), high-grade ICANS was associated with a higher median peak ferritin (4074 vs 1567 mg/L, P = .03), CRP (178 vs 101 mg/L, P = .001), and a lower median peak absolute monocyte count (0.55 vs 0.87 × 10⁹/L, P = .001), whereas no difference was observed in median peak ALC (0.57 vs 0.78 × 10⁹/L, P = .15; Figure 1B).
Neuroimaging findings
Brain imaging was performed before conditioning therapy in all patients: CT in 83 patients and MRI in 17. Of 68 patients who developed ICANS, 38 had MRIs of the brain at the time of symptoms, 30 of whom had grade ≥3 ICANS. Among the 38 available studies, 5 were negative, 10 were probably negative (evaluation being limited by image quality), 8 showed findings already present before axi-cel infusion, 1 showed nonconclusive findings, and 14 were positive. The most common imaging pattern, observed in 7 patients, was characterized by T2-weighted fluid-attenuated inversion recovery (T2/FLAIR) hyperintensity affecting the limbic system, with or without extralimbic involvement, reminiscent of limbic encephalitis. T2/FLAIR signal change was most often seen, either unilateral or bilateral, in the hippocampus (Figure 2A), insular cortex, thalamus, cingulate gyrus, and the brainstem. All 7 patients had altered mental status (AMS). MRI of brain was repeated in 4 of the patients: in 1 patient, the pattern and symptoms completely resolved 10 days later; in 1 patient with worsening AMS, the imaging findings progressed on multiple scans obtained in the subsequent 20 days; in 2 patients, no change was observed either on neurologic examination or in neuroradiologic findings. The second most common imaging finding was a stroke pattern characterized by focal cortical-based or deep white matter hyperintensity on diffusion-weighted imaging with restricted diffusion (Figure 2B) observed in 3 patients (1 of whom had a known preinfusion diagnosis of atrial fibrillation). All 3 patients presented with AMS. MRI brain was repeated in 2 and showed normal stroke evolution in both. Leptomeningeal enhancement was observed in 2 patients (Figure 2C), 1 of whom had previous CNS disease and was characterized by sulcal enhancement. Both had AMS, and neither had a lumbar puncture nor a repeat imaging study, but corticosteroids induced complete resolution of neurologic symptoms in both patients. Two other patients with AMS had MRI findings consistent with posterior reversible encephalopathy syndrome (PRES; Figure 2D), characterized by posterior bilateral and symmetrical subcortical edema. Repeat imaging in one of the patients showed worsening findings. Among the above-described 14 patients with AMS, 12 had complete resolution of symptoms, 1 with bilateral involvement of the medial temporal lobes died because of status epilepticus on day 51, and 1 with leptomeningeal disease pattern died from progressive lymphoma.
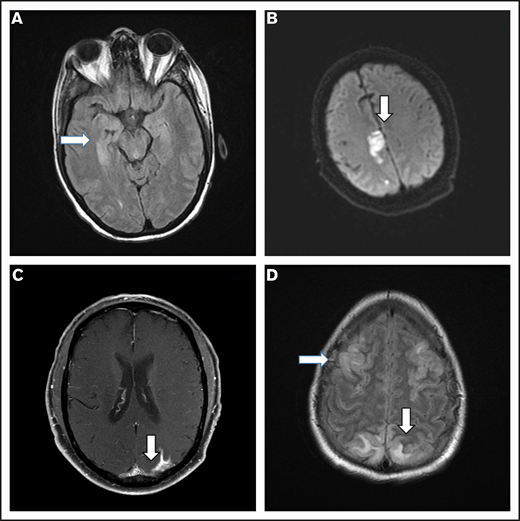
Representative MRI imaging features. (A) Encephalitis (T2/FLAIR axial image). (B) Stroke (diffusion-weighted axial image). (C) Leptomeningeal disease (postcontrast T1-weighted axial image). (D) PRES (T2/FLAIR axial image).
Representative MRI imaging features. (A) Encephalitis (T2/FLAIR axial image). (B) Stroke (diffusion-weighted axial image). (C) Leptomeningeal disease (postcontrast T1-weighted axial image). (D) PRES (T2/FLAIR axial image).
Electroencephalographic findings
Of 68 patients with ICANS, 55 had an EEG performed (41 of whom had grade ≥3 ICANS), several times per patient (132 EEGs overall), and 50 were abnormal. The most common finding was diffuse slowing, observed in 49 patients (Figure 3A), whereas focal slowing was observed in only 3 patients (Figure 3B). Six patients had EEG findings with intermittent interictal epileptiform discharges (Figure 3B), and 8 had an NCSE pattern (Figure 3C-D). Clinical improvement to benzodiazepine challenge along with EEG improvement was observed in 7 of 8 patients (Figure 3C-D). In 1 of 8, there was good electrographic improvement with resolution of 3-Hz repetitive periodic complexes.

Representative patterns observed on EEGs. (A) Diffuse slowing and cardiac arrythmia. (B) Focal slowing indicated by boxes and epileptiform discharges indicated by arrow. (C-D) Nonconvulsive status epilepticus (C) and response to 2 mg IV lorazepam (D). Montage shown: longitudinal bipolar, left central/right central, left temporal/right temporal chain: 70 µV/cm voltage, 30 mm/s.
Representative patterns observed on EEGs. (A) Diffuse slowing and cardiac arrythmia. (B) Focal slowing indicated by boxes and epileptiform discharges indicated by arrow. (C-D) Nonconvulsive status epilepticus (C) and response to 2 mg IV lorazepam (D). Montage shown: longitudinal bipolar, left central/right central, left temporal/right temporal chain: 70 µV/cm voltage, 30 mm/s.
Management of ICANS
All 68 patients who developed ICANS received supportive care including IV hydration and aspiration precautions. Antiseizure treatment, in addition to prophylactic levetiracetam, including phenobarbital and/or lacosamide, was required in 12 patients, 7 of whom had NCSE. Forty-four patients were treated with low-dose corticosteroids (dexamethasone, 10-20 mg IV every 6 hours or equivalent) and 12 (8 of whom had grade 4 ICANS) with high-dose corticosteroids (methylprednisolone 1 g IV daily or equivalent). Median cumulative dexamethasone-equivalent dose temporally associated with decrease in ICANS from grade 3-4 to 1-2 was 94 mg (range, 20-1156 mg), and the median time to decrease was 3 days (range, 1-11 days). Sixty-four patients received tocilizumab, because of previous or concomitant CRS. Fifty-two patients received tocilizumab alone (without corticosteroids) for the treatment of CRS. When comparing these 52 patients with the 48 who either did not receive tocilizumab or who received it along with corticosteroids, a trend for a higher rate of ICANS of any grade (77% vs 58%, P = .06), but not in grade 3-4 ICANS (42% vs 40%, P = .84), was observed. None of the patients required hypertonic saline and/or mannitol, hyperventilation, or a ventricular shunt.
High-grade ICANS and survival
After a median follow-up of 10 months (95% confidence interval, 8-10 months), 54 patients progressed and/or died, and PFS was significantly shorter among patients with high-grade ICANS compared with those with grade 0-2 ICANS (6-month PFS rate, 40% vs 60%; P = .02; Figure 4A). At most recent follow-up, 36 patients have died: 31 of progressive disease, 2 of hemophagocytic lymphohistiocytosis, 1 of ICANS (uncontrollable seizure), and 2 of other complications; the latter included thrombocytopenia-related intracranial hemorrhage and methicillin-resistant Staphylococcus aureus pneumonia and septic shock, both within the first 30 days after axi-cel infusion. High-grade ICANS was associated with a significantly shorter OS (6-month OS rate, 50% vs 78%; P = .001; Figure 4B). The association between high-grade ICANS and shorter OS (hazard ratio, 0.5; 95% confidence interval, 0.2-0.9; P = .02) was maintained in a multivariable analysis including elevated IPI and lactate dehydrogenase (LDH) above upper limit of normal (only baseline characteristics significantly associated with shorter survival on univariable analysis were included in the model; Table 2).
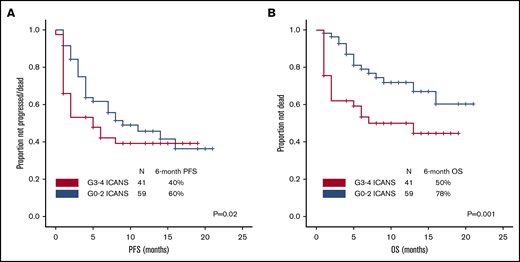
Association between high-grade ICANS and survival. (A) Progression-free survival. (B) Overall survival.
Association between high-grade ICANS and survival. (A) Progression-free survival. (B) Overall survival.
Multivariable model of factors associated with survival
| Factor | Progression-free survival | Overall survival | ||||
|---|---|---|---|---|---|---|
| P for uni | HR [95% CI] | P for multi | P for uni | HR [95% CI] | P for multi | |
| Stage III-IV | .04 | 0.8 [0.3-2.2] | .69 | — | — | — |
| IPI 3-4 | .002 | 0.8 [0.4-1.6] | .76 | .001 | 0.6 [0.3-1.4] | .03 |
| LDH > ULN | <.001 | 0.3 [0.1-0.7] | .007 | <.001 | 0.1 [0.03-0.7] | .01 |
| Grade ≥ 3 ICANS | .02 | 0.7 [0.4-1.3] | .29 | .001 | 0.5 [0.2-0.9] | .02 |
Only factors significantly associated in univariable analysis were included in the model. Bold numbers indicate significant P values.
CI, confidence internal; HR, hazard ratio; multi, multivariable; uni, univariable.
Discussion
Here, we describe the clinical, EEG, and radiologic correlates of ICANS in a large population of patients with relapsed or refractory LBCL treated with standard of care axi-cel. We used the CARTOX grading system, which differs only slightly from the Lee 2014 criteria used to grade CRS on ZUMA-1.14 In our study, the incidence of CRS of any grade (97%) or of grade ≥3 (9%) in our standard of care population was comparable to that reported in the pivotal ZUMA-1 trial (92% and 11%, respectively).1 The incidence of ICANS of any grade (68% and 67%, respectively) and the median time to ICANS onset (both 5 days) were also comparable to that reported in the ZUMA-1 trial. However, a higher rate of grade ≥3 ICANS was observed in our study compared with ZUMA-1 (41% vs 32%).1 It is important to remember that in the ZUMA-1 trial neurotoxicity was graded according to the CTCAE v4.03, whereas the CARTOX criteria were used in our study. Events such as convulsive seizure and focal motor weakness are upgraded to grade 4 in the CARTOX system compared with the CTCAE v4.03.9 In addition, elements such as nonconvulsive electrical seizures noted on EEG and cerebral spinal fluid opening pressure are not graded in the CTCAE v4.03, whereas they represent grade 3 or 4 events in the CARTOX system.15 As a consequence, the CARTOX system is more likely to upgrade ICANS compared with the CTCAE v4.03, likely explaining the higher rate of high-grade ICANS observed in this study compared with the ZUMA-1 trial. Moving forward, most centers administering CAR-T cell therapy will use the American Society for Transplantation and Cellular Therapy grading system4 to facilitate the ability to compare toxicities among trials and standard of care cohorts.
Similar to what was observed in the ZUMA-1 trial, our study showed that high peak ferritin and CRP levels after axi-cel infusion are associated with an increased risk of high-grade ICANS.1 Neurotoxicity was also associated with CAR T-cell expansion in vivo1 ; however, the latter was not directly assessed in this study. The ALC was not associated with ICANS in our study, suggesting it may represent a poor and not reliable surrogate marker for CAR T-cell expansion. Of interest, in our study, a low peak monocyte count after axi-cel infusion is associated with a higher incidence of high-grade ICANS. Norelli et al15 recently demonstrated that a greater number of monocytes in humanized mice was associated with a higher incidence of CRS and ICANS after CAR T-cell infusion. Complete depletion of monocytes abrogated all toxicities but also partially impaired CAR T-cell efficacy in these mice. In contrast, blockade of interleukin-1β, a macrophage-produced inflammatory cytokine, prevented both CRS and ICANS, without affecting the antitumoral activity of infused CAR T cells.15 It is possible that the inverse relationship between circulating monocytes and risk of high-grade ICANS observed in our study may be reflective of migration of circulating monocytes from the peripheral blood into the tissues such as the CNS. To this regard, in cohort 3 of the ZUMA-1 study, analysis of paired cerebral spinal fluid (CSF) samples from baseline and day +5 after axi-cel infusion showed that patients with grade 3-4 ICANS had a 17-fold increase in myeloid cells in CSF compared with those with grade 0-2 ICANS.16 Taken together with the prior publications in mouse models,15,17 our data suggest that systematic assessment of CSF samples in patients with ICANS, and further evaluation on the role of macrophages may help shed light on the mechanisms of ICANS and help identify more effective and less toxic therapeutic and potentially prophylactic strategies.
In our study, the most common abnormal finding on MRI was characterized by T2/FLAIR hyperintensity involving parts of the limbic system, typically the hippocampus, thalamus, cingulate gyrus, and extralimbic structures to include the brainstem. Santomasso et al18 reported on 53 patients with B-ALL treated with anti-CD19 CAR T-cell therapy with CD28 costimulatory domain: 33 developed neurotoxicity of any grade, an MRI brain scan was performed in 19, and was abnormal in 5 patients. Similar to what was observed in our study, the most common abnormal finding was hyperintensity of the bilateral thalami and brainstem. Gust et al6 reported findings from 133 patients with B-ALL and B-cell non-Hodgkin lymphoma treated with anti-CD19 CAR T-cell product with 4-1BB costimulatory domain, 53 of whom had neurotoxicity: 23 had an MRI brain scan (mostly patients with severe neurotoxicity), and it was abnormal in 7. The most common finding was cortical swelling and vasogenic edema, prevalent in the basal ganglia, thalami, and brainstem. Although the precise pathophysiology of these MRI findings remains unknown, bilateral involvement of the temporal lobes may be reminiscent of limbic encephalitis, the latter reflecting a general pattern of response to various insults rather than a specific etiology. In this regard, infiltration with inflammatory cells and cytokines have been proposed as a common pathway of brain damage in patients with encephalitis, irrespective of its etiology (autoimmune, paraneoplastic, infectious).19-23
The overlapping radiologic presentation of these different etiologies may support the concept of excitotoxic mechanisms as a potential end pathway to brain injury.24 In this regard, the pattern of involvement on MRI (ie, hippocampi, other limbic structures, and corpus callosum) is in support of the extracellular glutamate excitotoxicity hypothesis, because these locations correlate with increased number of N-methyl-d-aspartate–type glutamate receptors.24 Given its prevalence in our analysis and its consistent report in other studies, this pattern could be CAR T-cell therapy mediated, and functional analysis is warranted to better understand its biologic mechanisms in the contest of cellular therapies, including endothelial dysfunction. In contrast, the other 3 patterns observed (stroke-like, leptomeningeal disease–like, and PRES-like) all represent conditions that may either precede or coexist with axi-cel infusion, and the few cases reported in this study are not sufficient to provide further insights. Systematic evaluation with brain MRIs before CAR T-cell infusion and at time of neurotoxicity onset is needed, to better understand their prevalence and clinical significance.25,26 In addition, consistent CSF assessments at time of neurotoxicity onset may help shed light on their biologic correlates. To this regard, it is unclear whether the stroke-like pattern is reflective of endothelial dysfunction or cardiac arrhythmia. Cytokine-induced endothelial dysfunction could in fact be the primary etiology of multiple imaging patterns, as suggested by vascular and metabolic studies recently reported in these patients.10
The most common EEG finding of diffuse slowing observed in our study was also similar to prior reports with anti-CD19 CAR T-cell therapy in B-ALL.6,18 This is consistent with a toxic-metabolic encephalopathy and likely is CAR T cell induced.6,18 We also noted NCSE in 8% of patients, highlighting the importance of performing an EEG in all patients with ICANS, independent of clinical seizures.
Finally, in our study, high-grade ICANS was associated with a significantly shorter PFS and OS. This is an interesting finding, because all ICANS events (except for 1) were reversible, suggesting that their effect on survival was not direct. Despite the lack of evidence that they may alter the course of ICANS, the current treatment of ICANS, in the absence of CRS, is primarily represented by corticosteroids, along with supportive care and antiseizure medication. It is reasonable to hypothesize that high doses of corticosteroid may affect CAR T-cell expansion and function and therefore efficacy. However, it is also possible that other factors may be contributing to the poor outcome in patients with high-grade ICANS such as high tumor burden and high-risk disease. Preconditioning LDH was used as surrogate marker of tumor burden in this study. Although the latter has been shown to be associated with CAR T-cell therapy efficacy and toxicity, total metabolic tumor volume on positron emission tomography may be a more robust predictor.27 Systematic measurement of total metabolic tumor volume will help to better assess in the future the influence of tumor burden on ICANS in these patients.
Additionally, we currently do not know whether the CAR T-cell product profile and host factors, such as immune polymorphisms and gut microbiome, are different in patients with high-grade vs low-grade ICANS. Novel strategies targeting the underlying pathophysiology of ICANS rather than corticosteroids (that cause global immune suppression) are highly needed to treat these patients. Peak levels of multiple chemokines have been associated with increased risk of ICANS in patients with LBCL treated with axi-cel.28 The above outlined preclinical data show that blockade of interleukin-1β, a macrophage-produced cytokine, with anakinra may be a potential prophylactic and/or therapeutic strategy in this setting.15,17,29 Similarly, promising data have been published with lenzilumab, a neutralizing antibody against granulocyte-macrophage colony-stimulating factor, another cytokine that activates macrophages.30
We acknowledge as a major limitation of our analysis its retrospective nature, and the need for future prospective studies aimed at confirming the hypotheses generated from our data.
In conclusion, ICANS is a common complication observed after axi-cel infusion in patients with LBCL. Imaging and electroencephalographic abnormalities are common in patients with ICANS, and high-grade ICANS is associated with worse outcome after CAR T-cell therapy in LBCL patients. Systematic evaluation with MRI and EEG is encouraged to better characterize this adverse event observed with most CAR T-cell therapy products. Strategies targeting the pathophysiology of ICANS may further improve outcomes in these patients.
Data may be requested from the corresponding authors at the following e-mails: sneelapu@mdanderson.org, stummala@mdanderson.org, and linda.chi@mdanderson.org.
Acknowledgments
This research is supported in part by Anderson Cancer Center Support Grant P30 CA016672 (from the National Institutes of Health, National Cancer Institute). P. Strati’s salary is supported by the Lymphoma Research Foundation Career Development Award.
Authorship
Contribution: P. Strati designed the study, analyzed data, and wrote the paper; L.J.N., J.W., L.E.F., S. Ahmed, N.H.F., F.B.H., H.J.L., S.P.I., R.N., S.P., M.A.R., F.S., R.E.S., M.W., C.C.P., P.K., and E.J.S. provided clinical care to patients and coauthored the paper; S. Adkins, C.M.C., C.S.M., M.C.H., N.A.J., P. Singh, H.E.M., S.H., and S.G. collected clinical data and coauthored the paper; L.F. reviewed the statistical analysis and coauthored the paper; S.S.N. designed the study, analyzed the data, provided clinical care to patients, and wrote the paper; S.T. designed the study, reviewed EEG, provided clinical care to patients, and coauthored the paper; and T.L.C. designed the study, reviewed neuro-radiological imaging, provided clinical care to patients, and coauthored the paper.
Conflict-of-interest disclosure: L.J.N. reports honoraria from Celgene, Genentech, Gilead, Janssen, Juno, Novartis, Spectrum, and TG Therapeutics and research support from Celgene, Genentech, Janssen, Karus Therapeutics, and Merck. N.H.F. reports honoraria from Celgene, Gilead Sciences, Pharmacyclics, and Roche Pharma AG; research support from Celgene, Gilead Sciences, Pharmacyclics, and Roche Pharma AG; and served as advisory board member for Novartis and Gilead Sciences. M.C.H. served as advisory board member for Novartis. F.S. reports honoraria from Celgene. S.S.N. has received research support from Kite/Gilead, Cellectis, Poseida, Merck, Acerta, Karus, Bristol-Myers Squibb, Unum Therapeutics, Allogene, and Precision Biosciences; served as consultant and advisory board member for Kite/Gilead, Celgene, Novartis, Bristol-Myers Squibb, Unum Therapeutics, Pfizer, Merck, Precision Biosciences, Cell Medica, Incyte, Allogene, Calibr, and Legend Biotech; and has patents related to cell therapy. The remaining authors declare no competing financial interests.
Correspondence: Sattva S. Neelapu, The University of Texas MD Anderson Cancer Center, 1515 Holcombe Blvd, Unit 429, Houston, TX 77030; e-mail: sneelapu@mdanderson.org; Sudhakar Tummala, The University of Texas MD Anderson Cancer Center, 1515 Holcombe Blvd, Unit 429, Houston, TX 77030; e-mail: stummala@mdanderson.org; and T. Linda Chi, The University of Texas MD Anderson Cancer Center, 1515 Holcombe Blvd, Unit 429, Houston, TX 77030; e-mail: linda.chi@mdanderson.org.

