

Key Points
Nearly one-quarter of patients with MM have C1As at diagnosis.
C1As are associated with inferior survival, independent of other high-risk chromosomal abnormalities, despite therapy with novel agents.

Abstract
Chromosome 1 abnormalities (C1As) are common genetic aberrations among patients with multiple myeloma (MM). We aimed to evaluate the significance of C1As among a contemporary cohort of patients with MM in the United States. We used electronic health records from the Flatiron Health database to select patients newly diagnosed with MM from January 2011 to March 2018 who were tested using fluorescence in situ hybridization within 90 days of diagnosis. We characterized patients as having documented C1As or other high-risk chromosomal abnormalities (HRCAs) as defined by the Revised-International Staging System (R-ISS) such as del(17p), t(14;16), and t(4;14). We used Kaplan-Meier methods to compare overall survival (OS) of patients with or without C1As and stratified log-rank tests (with the presence of HRCAs as a stratifying variable). We used Cox proportional hazards regression models to compare OS, adjusting for age, sex, stage, HRCAs, and type of first-line therapy. Of 3578 eligible patients, 844 (24%) had documented C1As. Compared with patients without C1As, patients with C1As were more likely to have higher stage (R-ISS stage III; 18% vs 12%), to have HRCAs (27% vs 14%), and to receive combinations of proteasome inhibitors and immunomodulatory agents (41% vs 34%). Median OS was lower for patients with C1As (46.6 vs 70.1 months; log-rank P < .001). C1As were independently associated with worse OS (adjusted hazard ratio, 1.42; 95% confidence interval, 1.19-2.69; P < .001), as were older age, higher R-ISS stage, HRCAs, and immunoglobulin A isotype. C1As were associated with inferior OS, independent of other HRCAs, despite greater use of novel therapies. Clinical trials testing newer therapies for high-risk MM should incorporate patients with C1As.
Introduction
Each year, more than 30 000 individuals are diagnosed with multiple myeloma (MM) in the United States.1 The disease trajectory for these patients is highly variable, with survival ranging from a few months to more than 10 years.2 The number of treatment options is increasing, and patients may receive multiple lines of therapy. Prognostic markers that stratify patients with varying clinical outcomes are essential for developing appropriately tailored therapeutic strategies.
Several markers of high-risk disease have already been identified and were incorporated into the Revised-International Staging System (R-ISS) in 2015.3 The R-ISS incorporates information on albumin, β-2 microglobulin, and lactate dehydrogenase levels as well as 3 high-risk chromosome abnormalities (HRCAs): del(17p), t(4;14), and t(14;16). Patients with newly diagnosed MM can be classified according to 3 distinct R-ISS stages (I-III) with reported 5-year overall survival (OS) of 82%, 62%, and 40%, respectively.4 However, recent research has identified additional cytogenetic abnormalities that may predict worse outcomes among MM patients independent of the R-ISS risk factors.5
Chromosome 1 abnormalities (C1As) are among the most common recurrent chromosomal aberrations observed in patients with MM.6 A variety of abnormalities involving both short and long arms of chromosome 1 have been described, including gains, deletions, and balanced or jumping translocations; patients with relapsed MM have a greater prevalence of these abnormalities compared with newly diagnosed patients.6 Previous studies of C1As indicate an association with poor prognosis, although there is uncertainty about the magnitude of the effects of C1As relative to other HRCAs.7-11 Many of these studies involve highly selected and often younger patients enrolled in clinical trials that are not representative of real-world populations.7,11-13 Meanwhile, studies of patients treated outside of clinical trials are limited by either small sample size14,15 or the inclusion of very few patients treated with combinations of immunomodulatory drugs (IMiDs) and proteasome inhibitors (PIs).16,17 It remains unclear whether combination regimens using novel agents can ameliorate the adverse prognostic impact of C1As.
To address this important knowledge gap, we used clinical and genomic data from a large, unselected group of real-world patients with MM to examine the prevalence of C1As in those patients as well as the pattern of care and survival of those with C1As compared with those of other cytogenetic risk subgroups.
Methods
Data source
We used electronic health records (EHRs) from the Flatiron Health database, a nationwide database comprising de-identified, longitudinal patient-level demographic, clinical, and outcomes data extracted from the source EHR system.18 The database includes structured data as well as data elements that were abstracted from unstructured data and processed according to internal protocols. Structured data (including demographics, performance status, laboratory results, and medication administrations) are harmonized and normalized to a standard ontology across different source systems. Experienced oncology nurses and tumor registrars (with oncologist oversight) process unstructured data (eg, clinical data, pathology reports, treatment history, reason for treatment discontinuation, and adverse events) according to a modular, technology-enabled chart abstraction methodology supplemented by a manual review. Meanwhile, dates of death are obtained from a composite mortality variable generated from multiple data sources that include EHR data supplemented with external commercial and US Social Security Death Index data.19 At the time of our analysis, the database comprised data from >2 million patients with cancer seen at more than 265 cancer clinics in the United States (at ∼800 sites of care), both academic and community-based, in both urban and rural areas. Our study cohort comprised 194 unique practice sites from 42 different states including Hawaii and from US territories such as Puerto Rico. Within the continental United States, the geographic distributions of the practices were 41.9% from the Southern region, 23.5% from the Northeast, 16.6% from the Midwest, and 18% from the Western region. Institutional Review Board approval with a waiver of informed consent was obtained before the study started.
Study cohort
Our primary study cohort included patients age 18 years or older with a histologically confirmed diagnosis of MM between January 2011 and March 2018. Eligible patients were required to have at least 2 clinic encounters on or after their date of diagnosis (defined as the first day of month in which patient was diagnosed), known first-line therapy, and fluorescence in situ hybridization (FISH) testing from 30 days before to 90 days after the date of diagnosis. All patients were observed until death (defined as first day of month in which patient was deceased) or the end of study period (31 March 2018).
Definition of outcome
OS was defined as the time from date of diagnosis until death. Patients were censored if they were alive at the end of study period (31 March 2018); patients without any visits or therapy in the 6 months before the end of the study period were censored at the time of their last recorded activity.
Key variables
The primary variable of interest was documentation of the presence of C1As as identified by FISH. We created an indicator for the documented presence of other HRCAs that are incorporated into the R-ISS. Because patients with C1As are also more likely to have HRCAs, we also created a 4-level measure that combined the 2 entities: neither C1As nor HRCAs; HRCAs present but no C1As; C1As present but no HRCAs; and both C1As and HRCAs present. Additional variables of interest included socio-demographic characteristics (age, sex, race/ethnicity), clinical characteristics (type of M-protein, performance status, and disease stage), and treatment characteristics (first-line treatment regimen and receipt of autologous stem cell transplantation [ASCT]). We used a composite variable for self-reported race/ethnicity, classified as Hispanic, non-Hispanic white, non-Hispanic African American, and other (Pacific Islander, American-Indian, or Alaska Native).20 Baseline performance status was measured by using the Eastern Cooperative Oncology Group (ECOG) performance score that was recorded closest to the date of MM diagnosis. ECOG performance scores were grouped into 0-2 and 3-4; because of the large number of missing values, we created an indicator for missing values. Information on comorbidity was not available. We used R-ISS to measure disease stage at the time of initial diagnosis, based on either an abstracted R-ISS report or constructed by using laboratory results (albumin and β-2 microglobulin) within 90 days of diagnosis. Lack of data on lactate dehydrogenase levels limited our ability to construct the R-ISS. First-line therapy was defined on the basis of the first episode of anti-myeloma therapy initiated up to 14 days before or after the diagnosis date and after the initial visit. First-line therapy was further categorized into PI- or IMiD-based therapy or therapy using only older agents. Information on the receipt and timing of ASCT was also incorporated into the characterization of lines of therapy.
Statistical analysis
We compared baseline characteristics between patients with and without documented C1As using appropriate bivariate statistics (χ2 test for categorical variables and independent sample Student t test for continuous variables). We used the Kaplan-Meier method to compare the survival distribution of patients stratified by presence of either C1As and/or HRCAs. The difference between survival distribution of MM patients with and without C1As was then compared using stratified log-rank tests (with the presence of HRCAs as a stratifying variable). We performed multivariable analysis using Cox proportional hazards regression to examine the association of C1As with OS, adjusting for potential confounders including age, sex, race/ethnicity, type of first-line therapy, and use of ASCT. The proportional hazards assumption was confirmed by using evaluation of Cox Snell’s residuals. Furthermore, we tested for interactions between C1As and type of first-line therapy. Because there were several missing values for R-ISS stages and ECOG scores, they were not included in our primary regression models; however, we controlled for these potential confounders in a separate sensitivity analysis. Similarly, because many practice sites may not have adopted C1A testing, particularly during the early study period, we conducted a sensitivity analysis by running separate Cox regression models, limiting our study cohort to the second half of the study period (ie, 2015 and after). All statistical tests were 2-sided with an α of 0.05. All analyses used STATA 13.0 (STATA, College Station, TX).
Results
A total of 7780 patients with MM were identified, and 3578 patients from 194 practice sites met the eligibility criteria for inclusion in this analysis (Figure 1). The median age of the overall cohort was 69 years (interquartile range, 31-85 years) with 54% males and 60% non-Hispanic whites; 24% had documented C1As. Patients with C1As were more likely to have other high-risk indicators compared with patients without C1As. For example, higher prevalence of R-ISS stage III disease (18% vs 12%), presence of any HRCA (27% vs 14%), and individual HRCAs such as del(17p), 14% vs 8%; t(4;14), 10% vs 5%; and t(14;16), 5% vs 2%, all significantly different at P < .001. However, patients with C1As were less likely to harbor t(11;14) compared with those without C1As (9% vs 15%; P < .001). Patients with C1As were more likely to receive therapy with PI and IMiD combinations compared with those without C1As (41% vs 34%; P < .001). The use of ASCT was similar in the 2 groups (26% vs 28%; P = .14) (Table 1).

Cohort selection process. Eligible patients were required to have undergone FISH testing of their bone marrow aspirate within 90 days of diagnosis and have known first-line therapy.
Cohort selection process. Eligible patients were required to have undergone FISH testing of their bone marrow aspirate within 90 days of diagnosis and have known first-line therapy.
Characteristics of patients with MM with or without documented C1As
| Variable | With C1As | Without C1As | P | ||
|---|---|---|---|---|---|
| No. | % | No. | % | ||
| No. of patients | 844 | 2734 | |||
| Median age (IQR), y | 69 (62-77) | 68 (60-76) | .002 | ||
| Female | 406 | 48.1 | 1237 | 45.2 | .150 |
| Race/ethnicity | .496 | ||||
| Non-Hispanic white | 493 | 58.4 | 1656 | 60.6 | |
| Non-Hispanic African American | 131 | 15.5 | 437 | 15.9 | |
| Hispanic | 65 | 7.7 | 183 | 6.7 | |
| Other | 75 | 8.9 | 241 | 8.8 | |
| Missing | 80 | 9.5 | 217 | 7.9 | |
| Practice type | .511 | ||||
| Academic | 80 | 9.5 | 239 | 8.7 | |
| Community | 764 | 90.5 | 2495 | 91.3 | |
| M-protein type | <.001 | ||||
| IgG | 386 | 49.2 | 1511 | 58.8 | |
| IgA | 219 | 27.9 | 505 | 19.7 | |
| Light chain | 171 | 21.8 | 515 | 20.1 | |
| Other | 9 | 1.1 | 37 | 1.4 | |
| Missing | 59 | 7 | 166 | 6.1 | |
| R-ISS stage | <.001 | ||||
| I | 140 | 16.6 | 435 | 15.9 | |
| II | 129 | 15.3 | 437 | 15.9 | |
| III | 148 | 17.5 | 322 | 11.8 | |
| Missing | 427 | 50.6 | 1540 | 56.3 | |
| ECOG PS | .903 | ||||
| 0-2 | 534 | 63.3 | 1713 | 62.6 | |
| 3-4 | 22 | 2.6 | 78 | 2.8 | |
| Missing | 288 | 34.1 | 943 | 34.5 | |
| HRCA | |||||
| Any HRCA | 227 | 26.9 | 376 | 13.8 | <.001 |
| del(17 p) | 121 | 14.3 | 231 | 8.4 | <.001 |
| t(4;14) | 87 | 10.3 | 130 | 4.8 | <.001 |
| t(14;16) | 41 | 4.9 | 47 | 1.7 | <.001 |
| Non-HRCA | |||||
| del(13q) | 414 | 49.1 | 768 | 28.1 | <.001 |
| t(11;14) | 78 | 9.2 | 411 | 15 | <.001 |
| First-line therapy | <.001 | ||||
| PI + IMiD combination | 342 | 40.5 | 916 | 33.5 | |
| PI-based | 151 | 17.9 | 615 | 22.5 | |
| IMiD-based | 284 | 33.6 | 871 | 31.9 | |
| Other | 67 | 7.9 | 332 | 12.1 | |
| ASCT | 215 | 25.5 | 768 | 28.1 | .140 |
HRCA is defined as the presence of 1 of the following: del (17p), t4;14, or t14;16).
IgG, immunoglobulin G; IQR, interquartile range; PS, performance status.
During a median follow-up of 29.3 months (95% confidence interval [CI], 28.4-31.4 months), 958 patients (27%) had died. The median OS of the overall cohort was 66.9 months (95% CI, 60.9-73.1 months). The median OS for each of the 4 cytogenetic categories was 75.1 months for no documented C1As or HRCAs; 59.9 months for HRCAs present/no C1As; 46.7 months for C1As present/no HRCAs; and 46.7 months for both C1As and HRCAs present. The median OS was significantly lower for patients with C1As compared with the median OS for those without C1As (46.7 vs 70.1 months) after adjusting for presence of other HRCAs (stratified log-rank P < .001) (Figure 2).
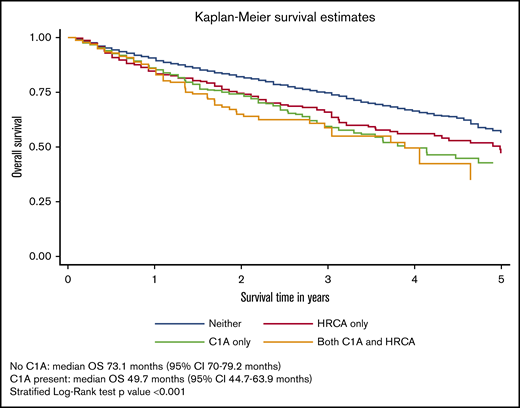
OS of patients with MM and with or without C1As. Survival distributions were plotted using Kaplan-Meier methods. Because patients with C1As were also more likely to have HRCAs, we created a 4-level measure that combined them: neither C1As nor HRCAs, HRCAs present/no C1As, C1As present/no HRCAs, and C1As and HRCAs present. Differences in survival distributions between those with and without C1As were tested with log-rank statistics, accounting for HRCAs as a stratifying variable, and the results were statistically significant (P < .001).
OS of patients with MM and with or without C1As. Survival distributions were plotted using Kaplan-Meier methods. Because patients with C1As were also more likely to have HRCAs, we created a 4-level measure that combined them: neither C1As nor HRCAs, HRCAs present/no C1As, C1As present/no HRCAs, and C1As and HRCAs present. Differences in survival distributions between those with and without C1As were tested with log-rank statistics, accounting for HRCAs as a stratifying variable, and the results were statistically significant (P < .001).
In multivariable analysis, compared with patients without either type of chromosomal abnormality, those with C1As had an increased risk of mortality regardless of the presence of HRCAs (hazard ratio [HR], 1.84; 95% CI, 1.42-2.39; P < .001 for those with HRCAs; HR, 1.42; 95% CI, 1.19-1.69; P < .001 for those without HRCAs). C1As remained an independent predictor of worse survival after adjusting for multiple covariates, including age, sex, race/ethnicity, M-protein subtype, type of first-line therapy, and use of ASCT. As detailed in Table 2, the HRs are quite similar between patients with C1As only and patients with HRCAs only, with nearly identical CIs. Furthermore, we tested the interaction between documented C1As and type of first-line therapy (IMiD plus PI vs other) as well as C1As and the use of ASCT in our multivariable models and found no evidence of a statistically significant interaction (Table 2). Sensitivity analyses incorporating R-ISS stage and ECOG performance status as additional covariates showed similar results, with C1As remaining an independent predictor of worse survival (HR, 1.45; 95% CI, 1.22-1.73; P < .001) (Table 3). Similarly, C1As remained an independent predictor of worse survival (HR, 1.34; 95% CI, 1.03-1.74; P = .029), even after limiting our study cohort to years 2015 and after (Table 4).
Predictors of OS in patients with MM (n = 3353)
| Variable | HR* | 95% CI* | P |
|---|---|---|---|
| Cytogenetic group | |||
| Neither C1A nor HRCA | Ref | — | |
| HRCA present/no C1A | 1.57 | 1.30-1.91 | <.001 |
| C1A present/no HRCA | 1.42 | 1.19-1.69 | <.001 |
| Both C1A and HRCA present | 1.84 | 1.42-2.38 | <.001 |
| Age, y | 1.03 | 1.02-1.03 | <.001 |
| Male | 1.26 | 1.11-1.44 | <.001 |
| Race/ethnicity | |||
| Non-Hispanic white | Ref | — | |
| Hispanic or Latino | 0.65 | 0.47-0.88 | .006 |
| Non-Hispanic African American | 0.85 | 0.70-1.02 | .084 |
| Other | 0.91 | 0.72-1.15 | .446 |
| Unknown | 1.27 | 1.00-1.61 | .046 |
| M-protein subtype | |||
| IgG | Ref | 1.18-1.63 | <.001 |
| IgA | 1.38 | 1.13-1.58 | .001 |
| Other | 1.33 | 2.04-3.25 | <.001 |
| Unknown | 2.57 | ||
| First-line therapy | |||
| IMiD + PI based | Ref | 0.84-1.24 | .866 |
| IMiD based | 1.02 | 1.25-1.75 | <.001 |
| PI based | 1.48 | 0.90-1.39 | .314 |
| Non-IMiD/PI | 1.12 | ||
| ASCT | 0.33 | 0.26-0.40 | <.001 |
HRCA is defined as presence of 1 of the following: del(17p), t4;14, or t14;16).
Ref, reference.
HRs and 95% CIs were derived from a multivariable Cox proportional hazards regression model; all variables in the table were included in the same model simultaneously. The interaction terms between first-line treatment and cytogenetic group as well as ASCT and cytogenetic group were not statistically significant (results not shown).
Multivariable Cox regression model for OS incorporating R-ISS stage and ECOG PS as potential confounders
| Variable | HR* | 95% CI* | P |
|---|---|---|---|
| Cytogenetic group | |||
| Neither C1A nor HRCA | Ref | — | <.001 |
| HRCA present/no C1A | 1.48 | 1.23-181 | <.001 |
| C1A present/no HRCA | 1.45 | 1.22-1.73 | <.001 |
| Both C1A and HRCA present | 1.70 | 1.32-2.21 | |
| Age, y | 1.02 | 1.01-1.03 | <.001 |
| Male | 1.23 | 1.08-1.40 | .002 |
| Race/ethnicity | |||
| Non-Hispanic white | Ref | — | .002 |
| Hispanic or Latino | 0.61 | 0.45-0.84 | .125 |
| Non-Hispanic African American | 0.86 | 0.71-1.04 | .341 |
| Other | 0.89 | 0.71-1.13 | .036 |
| Unknown | 1.29 | 1.02-1.63 | |
| M-protein subtype | |||
| IgG | Ref | — | .003 |
| IgA | 1.28 | 1.08-1.50 | .001 |
| Other | 1.33 | 1.12-1.57 | <.001 |
| Unknown | 2.56 | 2.03-3.23 | |
| R-ISS stage | |||
| Ι | Ref | 1.16-2.01 | .003 |
| ΙΙ | 1.52 | 1.87-3.20 | <.001 |
| ΙΙΙ | 2.45 | 1.29-2.07 | <.001 |
| Unknown | 1.63 | ||
| ECOG PS | |||
| 0-2 | Ref | 2.30-4.12 | <.001 |
| 3-4 | 3.07 | 1.48-1.94 | <.001 |
| Unknown | 1.69 | ||
| First-line therapy | |||
| IMiD + PI based | Ref | 0.81-1.21 | .939 |
| IMiD based | 0.99 | 1.08-1.53 | .004 |
| PI based | 1.29 | 0.82-1.29 | .797 |
| Non-novel | 1.03 | ||
| ASCT | 0.33 | 0.27-0.41 | <.001 |
HRs and 95% CIs were derived from a multivariable Cox proportional hazards regression model; all variables in the table were included in the same model simultaneously. The interaction terms between first-line treatment and cytogenetic group as well as stem cell transplantation and cytogenetic group were not statistically significant (results not shown).
Multivariable Cox regression model for overall survival limiting cases diagnosed from 2015 or later (n = 2033)
| Variable | HR* | 95% CI* | P |
|---|---|---|---|
| Cytogenetic group | |||
| Neither C1A nor HRCA | Ref | — | .094 |
| HRCA present/no C1A | 1.35 | 0.95-1.92 | .029 |
| C1A present/no HRCA | 1.34 | 1.03-1.75 | <.001 |
| Both C1A and HRCA present | 2.08 | 1.47-2.94 | |
| Age, y | 1.02 | 1.01-1.03 | .006 |
| Male | 1.12 | 0.90-1.38 | .304 |
| Race/ethnicity | |||
| Non-Hispanic white | Ref | — | .132 |
| Hispanic or Latino | 0.67 | 0.40-1.12 | .399 |
| Non-Hispanic African American | 1.14 | 0.84-1.53 | .944 |
| Other | 1.01 | 0.71-1.45 | .281 |
| Unknown | 1.21 | 0.85-1.72 | |
| M-protein subtype | |||
| IgG | Ref | 1.27-2.18 | <.001 |
| IgA | 1.67 | 1.21-2.09 | .001 |
| Other | 1.59 | 1.50-3.22 | <.001 |
| Unknown | 2.20 | ||
| First-line therapy | |||
| IMiD + PI based | Ref | 0.88-1.67 | .239 |
| IMiD based | 1.21 | 1.25-2.09 | <.001 |
| PI based | 1.61 | 0.78-1.92 | .378 |
| Non-IMiD/PI | 1.23 | ||
| ASCT | 0.23 | 0.15-0.35 | <.001 |
HRCA is defined as presence of 1 of the following: del(17p), t4;14, or t14;16).
HRs and 95% CIs were derived from a multivariable Cox proportional hazards regression model; all variables in the table were included in the same model simultaneously.
Discussion
In this large retrospective study with a contemporary, real-world cohort of adult patients with MM, we found that patients with documented C1As had worse survival compared with those without C1As, independent of previously identified HRCAs. Furthermore, this adverse impact does not seem to be ameliorated by the use of combinations of PIs and IMiDs, with or without ASCT as first-line therapy. To our knowledge, this is the first large-scale, real-world study that shows the prognostic significance of C1As in a cohort of unselected patients, treated predominantly with novel therapies as first-line agents.
We observed important differences in clinical characteristics between patients with and without C1As. Patients with C1As were more likely to have immunoglobulin A (IgA) subtype, higher R-ISS stage, and HRCAs, all of which are associated with inferior outcomes among patients with MM.4,21 This is consistent with previous observations,15,16 suggesting that clustering of high-risk features among patients with C1As may account for inferior outcomes seen among those patients. In fact, C1As and HRCAs were independent predictors of inferior survival. When we considered joint indicators for C1As and HRCAs, we found very similar hazards of death associated with C1As or HRCAs alone, compared with having neither, whereas patients with both C1As and HRCAs had the worst OS. These findings underscore the importance of incorporating C1As into future risk stratification models for MM.
Our results provide important real-world evidence of inferior outcomes for patients with C1As despite treatment regimens that include novel therapies. Most previous studies of C1As included patients treated with first- and second-generation drugs.12,13,16,17,22,23 Only a few small single-institution studies have evaluated the prognostic impact of C1As among a more contemporary cohort of MM patients treated with newer treatment combinations.14,15,24,25 In a series of 95 patients with MM, Shah et al15 showed that gain of chromosome 1q independently predicted worse progression-free survival (PFS) and OS, despite receiving an ASCT. In another series of 201 MM patients treated at Emory University with first-line therapy based on lenalidomide, bortezomib, and dexamethasone, patients with +1q (vs those without) had a shorter median PFS and worse OS.24 Varma et al25 reported similar results among a cohort of 100 patients with +1q and/or del(1p) treated with high-dose therapy and ASCT. In an analysis of the CoMMpass study, Christofferson et al26 showed that gain of chromosome 1q exhibited poor PFS and OS regardless of hyperdiploid status. Finally, Biran et al14 analyzed 28 MM patients with gain of chromosome 1q and reported a median OS of only 37 months, despite use of combination therapies with novel agents. Aside from small sample sizes,14,15,24,25 the study by Shah et al15 lacked comparison groups, and the study by Biran et al14 did not account for concomitant HRCAs. Although our findings are generally consistent with these previous studies, our study has a substantially larger cohort of more than 3500 patients, most of whom were treated with novel agents, and we accounted for covariates, including the presence of HRCAs.
Previous studies have suggested that certain novel therapies may ameliorate the adverse impact of high-risk cytogenetics. In several clinical trials, bortezomib has been shown to partly overcome the adverse effect of t(4;14) and del(17p).5,27,28 In another open-label study of lenalidomide and dexamethasone, patients with t(4;14) experienced a median OS similar to that of patients without any cytogenetic abnormalities, suggesting that lenalidomide may overcome the adverse impact of t(4;14).29 However, it is less clear how these novel agents impact the prognosis of patients with C1As. In a series of 290 patients with newly diagnosed MM, gain of 1q21 had no impact on survival in patients receiving thalidomide-based treatment, suggesting that IMiDs could overcome resistance to thalidomide.30 However, several subsequent studies reported inferior survival among patients with C1As who received therapy with combinations of novel agents or ASCT.14,15,23 Consistent with these observations, we did not see a significant interaction between C1As and type of first-line treatment or ASCT with OS, suggesting that neither novel agent combinations nor ASCT can mitigate the adverse impact of C1As.
In our study, patients with Hispanic ethnicity seemed to have better outcomes on multivariable analysis after controlling for disease- and treatment-related risk factors. This is in contrast to previous reports of worse survival among Hispanic patients with MM compared with non-Hispanic whites,31,32 largely attributed to limited access to novel therapeutics and clinical trials and lower rates of stem cell use33,34 rather than disease biology.35 Recent studies have shown that with equal access to novel therapies and transplantation, Hispanics may have a comparable or even better survival compared with non-Hispanic whites.36 In our study, we found a comparable use of stem cell transplantation (28.6% vs 27.9%) and triplet combinations based on PIs plus IMiDs (33.5% vs 35.1%) among Hispanic patients compared with non-Hispanic white patients, which may partially explain superior survival seen among Hispanic patients.
Our study used a relatively new EHR database, Flatiron Health database, as a source, which has both strengths and limitations. The database is large and covers a broad geographic cross section of oncology patients cared for in the United States; our study population comprised MM patients seen in 198 cancer clinics across 44 states. Although the data set is not designed to generate nationally representative estimates, this should not bias study estimates of the association between C1As and clinical outcomes. The data set captured critical information on the results of FISH testing, which allowed us to identify patients with documented C1As. Unfortunately, the data do not allow for further categorization of patients on the basis of a specific subtype of C1A such as del(1p), +1q, copy number variations, or size of clones in this group. Although both del(1p) and +1q have been linked to an inferior prognosis, the magnitude of this impact may vary; our study results represent an average effect of C1As on outcomes. We also note that there may be some patients for whom C1A or HRCA status was not assessed, but we cannot distinguish between negative and missing results. It is possible that some laboratories may not uniformly evaluate C1As or even HRCAs as part of a standard myeloma diagnostic panel, although this would be quite rare in modern-day practices. Notably, nearly 80% of treatment centers (152 of 194) detected at least 1 patient with C1As, suggesting broad use of C1A testing; the remaining clinic practice sites (n = 42) contributed to less than 5% (n = 169) of total sample size (N = 3578). Thus, even if they were not including C1A in their FISH panel, that would be unlikely to influence the overall results. Nevertheless, the inclusion of very few patients from many sites may be associated with testing quality, data completeness, and selection bias for patients with less high-risk disease. Some sites may not have adopted routine C1A testing during the earlier study period; however, our results were largely unchanged even after restricting the study cohort to those diagnosed in 2015 and after. Despite these limitations, our data set provided a contemporary cohort of patients with robust clinical and treatment information, including the presence of HRCAs, number of lines of therapy, and OS, which were often lacking in other real-world claims databases, which make it a unique resource for this study. Although extensive missing data for R-ISS stage and ECOG performance status precluded inclusion of these variables in our primary multivariable models, we were able to incorporate these measures during sensitivity analyses which yielded similar findings for other covariates.
In conclusion, C1As are seen in almost a quarter of patients with newly diagnosed MM and seem to be much more common than other traditional HRCAs. The presence of C1As has an adverse impact on survival among patients with MM, similar in magnitude to that with other HRCAs. Our findings suggest the need to incorporate C1As into MM risk stratification tools, as recently proposed by the Mayo clinic group,37 and highlight the need for development and testing of new therapies or regimens targeting patients with C1As.
Presented in part at the Annual Meeting of the American Society of Clinical Oncology, Chicago, IL, 31 May to 4 June 2019.
Requests for data may be sent to Smith Giri (smithgiri@uabmc.edu).
Authorship
Contribution: S.G., A.J.D., and N.N. conceptualized the study, the study design, and the methodology, curated and analyzed the data, and performed the analyses; A.J.D. and N.N. supervised and administered the project; and S.G., S.F.H., R.W., A.M.Z., N.P., S.D.G., X.M., C.P.G., A.J.D. and N.N. perform the investigation, wrote the original draft of the article, and reviewed and edited it.
Conflict-of-interest disclosure: A.J.D. and X.M. received research funding from Celgene. A.M.Z. received research funding (institutional) from Celgene, Acceleron, AbbVie, Otsuka, Pfizer, Medimmune/AstraZeneca, Boehringer-Ingelheim, Trovagene, Incyte, Takeda, and ADC Therapeutics; and served as a consultant for and received honoraria from AbbVie, Otsuka, Pfizer, Celgene, Ariad, Incyte, Agios, Boehringer-Ingelheim, Novartis, Acceleron, Astellas, Daiichi Sankyo, Cardinal Health, Seattle Genetics, BeyondSpring, and Takeda. N.P. served as a consultant for and received honoraria from Alexion, Pfizer, Agios Pharmaceuticals, Blueprint Medicines, Incyte, Novartis, and Celgene; and received research funding (all to the institution) from Boehringer Ingelheim, Astellas Pharma, Daiichi Sankyo, Sunesis Pharmaceuticals, Jazz Pharmaceuticals, Pfizer, Astex Pharmaceuticals, CTI biopharma, Celgene, Genentech, AI Therapeutics, Samus Therapeutics, Arog Pharmaceuticals, and Kartos Therapeutics. C.P.G. received research funding from the National Comprehensive Cancer Network (through Pfizer and AstraZeneca grants), from Johnson & Johnson for developing new approaches to data sharing, and from Flatiron Health for travel to and speaking at a scientific conference. The remaining authors declare no competing financial interests.
Correspondence: Smith Giri, Division of Hematology-Oncology, Institute for Cancer Outcomes and Survivorship, University of Alabama at Birmingham, 1600 7th Ave South, Lowder 500, Birmingham, AL 35233; e-mail: smithgiri@uabmc.edu.

