

Key Points
Impaired MK distribution may be mediated by an altered CXCL12/ CXCR4/VEGF signaling pathway in ITP.
Sympathetic neuropathy and nestin+ MSC apoptosis may have an effect on alterations of BM CXCL12 in ITP.

Abstract
Impaired megakaryocyte (MK) maturation and reduced platelet production are important causes of immune thrombocytopenia (ITP). However, MK distribution and bone marrow (BM) niche alteration in ITP are unclear. To investigate the maturation and distribution of MKs in the BM niche and examine the components of BM niche regulation of MK migration, BM and peripheral blood were obtained from 30 ITP patients and 28 healthy donors. Nestin+ mesenchymal stem cells (MSCs) and CD41+ MKs were sorted by fluorescence-activated cell sorting. The components of the BM niche and related signaling were analyzed via immunofluorescence, flow cytometry, enzyme-linked immunosorbent assay, reverse transcription polymerase chain reaction, and western blot analysis. The number of MKs in the BM vascular niche was reduced in ITP. Moreover, the concentrations of CXCL12 and CXCR4+ MKs in the BM were decreased in ITP. Further investigation demonstrated that nestin+ MSCs and CXCL12 messenger RNA (mRNA) in nestin+ MSCs were both reduced whereas the apoptosis of nestin+ MSCs was significantly increased in ITP. Sympathetic nerves, Schwann cells, the proportion of β3-adrenoreceptor (β3-AR)+ nestin+ MSCs, and β3-AR mRNA in nestin+ MSCs were all markedly reduced in ITP. Moreover, matrix metalloproteinase 9, vascular endothelial growth factor (VEGF), and VEGF receptor 1 were significantly reduced in ITP. Our data show that impaired MK distribution mediated by an abnormal CXCL12/CXCR4 axis is partially involved in reduced platelet production in ITP. Moreover, sympathetic neuropathy and nestin+ MSC apoptosis may have an effect on the alterations of BM CXCL12 in ITP.
Introduction
Reduced platelet production is an important cause of immune thrombocytopenia (ITP). In patients with ITP, the number of megakaryocytes (MKs) has been reported to be normal or increased, and MKs display impaired maturation.1,2 The hematopoietic microenvironment or “niche” was first proposed by Schofield in 1978 to describe areas in which hematopoietic stem cells (HSCs) reside.3 Previous studies have reported that the specialized region within the bone marrow (BM) in which HSCs dwell can been classified into 2 types: the osteoblastic niche and the BM vascular niche.4,5 Megakaryopoiesis is regulated and supported by the BM niche, and the parasinusoidal location of MKs in the BM is essential for platelet production and release.6 However, no information is available regarding MK distribution in ITP, and the role of the BM niche in ITP is not well understood. MKs are derived from HSCs in the BM. MK maturation and thrombopoiesis are related to the vascular niche in the BM. On the other hand, MK niches may also regulate HSC fate, because MK deletion reprograms myeloid-biased HSCs to balanced-lineage contributions.7 MKs are derived from HSCs in the endosteal niche, whereas terminal MK maturation and thrombopoiesis occur in the vascular niche6 ; therefore, MKs are required to migrate to the vascular niche to generate platelets.8 It has been reported that CXCL12 is the most potent physiological chemotactant for MKs,9,10 and the migration of MKs is mediated by the CXCL12/CXCR4 interaction.9,11
Thrombopoietin (TPO) and c-MPL knockout mice continue to produce morphologically and functionally normal platelets. MK-active chemokine CXCL12 promotes thrombopoiesis in Tpo−/− and Mpl−/− mice by enhancing the migration of MKs to the vascular niche.9 MK migration is proportional to the concentration gradient of CXCL12.9,10 In ITP, it is not established whether the chemotactic CXCL12/CXCR4 axis is abnormal.
CXCL12 can be expressed by different cells. CXCL12 production by different cell populations has distinct effects.9,12 CXCL12 production by MSCs and, to a lesser extent, endothelial cells is required for the maintenance of HSC repopulating activity and quiescence.13 Nestin is an intermediate filament protein. In the BM of humans and mice, nestin+ MSCs are localized to the perivascular site. Nestin-expressing MSCs are important in the perivascular space.14 Nestin+ MSCs are an important subset of MSCs.15 MSCs are abnormal in ITP, and our previous work showed that MSCs exhibited increased apoptosis and senescence and a lower capacity of suppressing immunity.16 However, it is not clear whether nestin+ MSCs are abnormal in ITP or whether nestin+ MSCs are involved in the pathogenesis of ITP.
Several studies have shown that nestin+ MSCs are spatially associated with sympathetic nerves (SNs) in the BM niche, and the expression of CXCL12 by nestin+ MSCs is strictly modulated by SNs.15,17-19 In addition, SNs have been reported to have the capacity to confine nestin+ MSCs to the vascular niche and protect nestin+ MSCs from apoptosis.17,18,20 Moreover, it has recently been reported that sympathetic stimulation can promote MK migration and platelet production.21 Nevertheless, it is not yet established whether BM SNs are disrupted in ITP. Whether the neural regulation of hematopoiesis plays any role in ITP, and whether there is any difference in SNs between ITP and healthy controls, remain unknown.
Our findings show that the nestin+ MSC-mediated CXCL12/CXCR4 axis abnormalities are associated with an impaired MK distribution in ITP, which results in reduced platelet production. Moreover, sympathetic neuropathy may be related to the apoptosis of nestin+ MSCs and may be responsible for impaired MK distribution.
Methods
Patients
Thirty newly diagnosed ITP patients and 28 healthy donors were consecutively enrolled in this prospective study from 1 August 2015 to 30 June 2017. ITP patients were diagnosed according to established practical guidelines.22 Controls were BM donors who originated from the HSC transplantation centers in Peking University People’s Hospital. All ITP patients and healthy donors volunteered to undergo BM biopsy at the time of BM aspiration in support of our study. Written informed consent was obtained from every patient and healthy donor in accordance with the Declaration of Helsinki. The ethics committee of Peking University People’s Hospital approved the protocols, and the study was conducted in accordance with the Declaration of Helsinki. Details regarding eligibility criteria can be found in supplemental Methods.
Preparation of BM cells
Ten milliliters of fresh BM, which had been collected in EDTA tubes, was processed within 6 hours after collection and stored at 4°C. Nucleated BM cells were separated over a discontinuous Percoll gradient.
Isolation and analysis of nestin+ MSCs
Nucleated BM cells were stained with CD31-fluorescein isothiocyanate (FITC), CD45-PerCP-Cy5.5, CD235a-allophycocyanin (APC), and nestin-phycoerythrin, and CD31− CD45− CD235a− nestin+ cells were separated as nestin+ MSCs using a FACSAria cell sorter (BD Biosciences). The purity of MSCs was analyzed, and the phenotype of MSCs was confirmed with CD105-APC using fluorescence-activated cell sorting (FACS). For further analysis, the samples were washed with phosphate-buffered saline (PBS) after surface antibody staining and subsequently stained with Annexin V-FITC and propidium iodide to assess apoptosis. Cells were fixed and permeabilized for intracellular staining of nestin and CXCL12.23,24 Additional information is available in the supplemental Methods.
MK lineage analysis
MKs were analyzed in the fractionated marrow as previously described.25 After centrifugation and washing, cells were stained with anti-CD41a-APC (559777; BD Biosciences) and anti-CXCR4-FITC (FAB170F; R&D Systems) antibodies. Additional information is available in the supplemental Methods.
ELISA
CXCL12 protein levels were assessed in the BM supernatant and peripheral blood (PB) plasma, and levels of matrix metalloproteinase 9 (MMP-9), vascular endothelial growth factor (VEGF), and TPO in the BM supernatant were assessed. The BM supernatant was separated for enzyme-linked immunosorbent assay (ELISA) analysis after Percoll gradient centrifugation. The PB was centrifuged at 2500 rpm for 5 minutes, and the plasma was subsequently collected and used for CXCL12 evaluation. All tests were processed with ELISA kits (R&D Systems) according to the manufacturer’s instructions.
Western blot
Western blots were performed as described in our previous work.16 Magnetically selected MKs were analyzed by western blotting for VEGF receptor 1 (VEGFR1) levels. Monoclonal antibodies against VEGFR1 (ab32152; Abcam) were used. The ratios of VEGFR1 proteins to β-actin were calculated. Data are presented as mean ± standard deviation (SD).
RT-PCR analysis
FACS-sorted nestin+ MSCs and magnetically selected MKs were analyzed by reverse transcription polymerase chain reaction (RT-PCR) for the expression of target genes. Total RNA was extracted from the purified MKs with TRN reagent (DP405-02; Tiangen Biotech). A carefully optimized method was used to prepare high-quality RNA by flow sorting formaldehyde-fixed senescent cells immunostained for nestin; complimentary DNAs were synthesized using the PrimeScript RT reagent kit with the gDNA Eraser kit (RR047B; TaKaRa Bio), and PCR was performed using SYBR Premix Ex Taq II (TliRnaseH Plus) and ROX plus (RR82LR; TaKaRa Bio).26 The primers are listed in the supporting Table SII. The specificity of all RT-PCR products was confirmed by DNA sequencing after the products were extracted from agarose gels. The delta-delta Ct method was used to calculate the fold change in gene expression between the 2 groups.
Histological analyses, immunohistochemistry, and immunofluorescence
Tissue collection was performed on the posterior superior iliac crest, which is normally used to obtain BM biopsies from patients. All BM aspirates and biopsies were performed using the same technique and the same method of slide preparation.27-29 Additional information is available in the supplemental Methods and supplemental Table SI.
Immunofluorescently stained BM biopsy sections were blocked/permeabilized in PBS containing 20% normal goat serum and 0.5% Triton X-100 and then stained with primary antibodies for 1 to 3 days. The tissues were incubated with secondary antibodies for 2 hours. Images were acquired using a Zeiss AXIO examiner D1 microscope with a confocal scanner unit (CSUX1C; Yokogawa) and reconstructed in 3 dimensions using Slide Book software (Intelligent Imaging Innovations) or Volocity software (PerkinElmer).30
All primary and secondary antibodies and reagents used in this study are listed in supplemental Tables SI and SII. The Tyramide Signal Amplification method was applied to enhance the antigen signals according to the manufacturer’s instructions. The antibodies were classified into 5 groups: CD41, CD31, and 4′,6-diamidino-2-phenylindole (DAPI); CD41, CD34, and DAPI; nestin, CD34, and DAPI; nestin, tyrosine hydroxylase, and DAPI; and glial fibrillary acidic protein (GFAP) and DAPI. The primary antibodies in each group were sequentially stained in one section. The fluorescyl-tyramide–based immunostaining method, while retaining specificity, is highly sensitive and provides optimal staining results for a broad panel of antibodies commonly used for the routine diagnosis and classification of hematological disorders.31
Animal study
The active mouse model of ITP was established as previously described with minor modifications.32,33 Eight- to 10-week-old female BALB/c mice were used as controls. Both ITP and control mice were divided into 4 groups according to different treatments, with 5 mice in each group. Group 1 was administered PBS plus PBS, group 2 received VEGF-A (murine isoform VEGF-A165; PeproTech) plus PBS, group 3 was administered CXCR4 antagonist (AMD3100) plus PBS, and group 4 received VEGF-A plus AMD3100. The dosage of VEGF-A was 2.5 µg/mouse intraperitoneally daily for 4 consecutive days, the dosage of AMD3100 was 5 mg/kg intraperitoneally twice daily for 4 consecutive days, and the control group received PBS. Twenty-four hours after the last injection, the mice were culled and the blood was collected via cardiac puncture for the enumeration of the circulating platelet levels. The femurs were dissected for histologic analysis.
Statistical analysis
All data are presented as the mean ± SD for continuous variables, median and interquartile range for skewed continuous variables, or number and percentage for categorical variables. The data were analyzed using the statistical software package SPSS, version 23.0 (SPSS, Chicago, IL). The Mann-Whitney U test was used to compare unpaired data, where indicated. For comparing the distribution of MKs adjacent to the vascular between groups, we used the Kolmogorov-Smirnov test for differences in the MK distribution between groups. Statistical significance was defined as 2-tailed P < .05 for all tests.
Results
Baseline characteristics
The demographics and characteristics of 30 patients with ITP and 28 controls are outlined in Table 1. The platelet counts of the ITP patients were significantly lower than those of the controls (18.5 × 10⁹/L vs 224 × 109/L, respectively; P < .001). Other baseline characteristics were comparable between ITP patients and controls (Table 1).
Demographics and characteristics of ITP patients
| ITP (n = 30) | Control (n = 28) | P | |
|---|---|---|---|
| Age, median (range), y | 36 (26-51) | 40 (23-47) | .648 |
| Sex, male/female | 8/22 | 11/17 | .529 |
| PLT count, median (range), ×109/L | 18.50 (6-75) | 224 (189-264) | <.001 |
| WBC count, median (range), ×109/L | 8.31 (4.29-10.23) | 7.95 (5.27-9.92) | .161 |
| Hemoglobin, median (range), g/L | 139.5 (115-166) | 141 (112-162) | .286 |
| A-RP, median (range), ×109/L | 9.12 (2.59-18.92) | 35.87 (15.33-48.95) | <.001 |
| P-RP, median (range), % | 22.13 (8.23-34.7) | 15.16 (7.33-27.28) | <.001 |
A-RP, absolute number of reticulated platelets; PLT, platelet; P-RP, percentage of reticulated platelets; WBC, white blood cell.
Distribution of MKs in the BM niche
A-RP was significantly reduced in ITP patients compared with controls (9.12 ± 3.58 × 10⁹/L vs 35.87 ± 8.67 × 10⁹/L, respectively; P < .001; Table 1), whereas P-RP was markedly increased in the ITP patients (22.13% × 7.44% vs 15.16% ± 4.53%, respectively; P < .001; Table 1). Most A-RP values in the ITP group were <15 × 109/L, whereas most A-RP values in the control group were >15 × 109/L.
There were no significant differences in the total number of CD41+ MKs per low-power field between ITP patients and controls (3.69 ± 1.16 vs 2.83 ± 0.93, respectively; P = .2; Figure 1A); however, the number of CD41+ MKs in the vascular niche per low-power field was markedly reduced in the ITP group (0.97 ± 0.40 vs 3.66 ± 0.73, respectively; P < .001; Figure 1B-D). In addition, compared with the control group, CD41+ MKs in the BM vascular niche of ITP patients were smaller (Figure 1E-H). By immunohistochemical staining, the diameter of MKs located adjacent to the sinusoidal endothelium in the ITP group was 21.2 ± 5.3 µm, while the MK diameter in the control group was 49.3 ± 8.5 µm (Figure 1I; P = .003). This analysis confirmed that the MKs adjacent to the sinusoidal endothelium were smaller in the ITP group than the control group. An in situ histological analysis of the BM from patients with ITP and controls was performed to further characterize the human BM microenvironment. The median number of CD31+ microvessels per trabecular bone (6 vs 5; P > .05) did not significantly differ between patients with ITP and controls. There was no significant difference in the number of colony-forming unit MKs between ITP patients and controls (100.30 ± 6.13/5 × 104 vs 100.12 ± 6.04/5 × 104, respectively; P = .914; supplemental Figure S1).
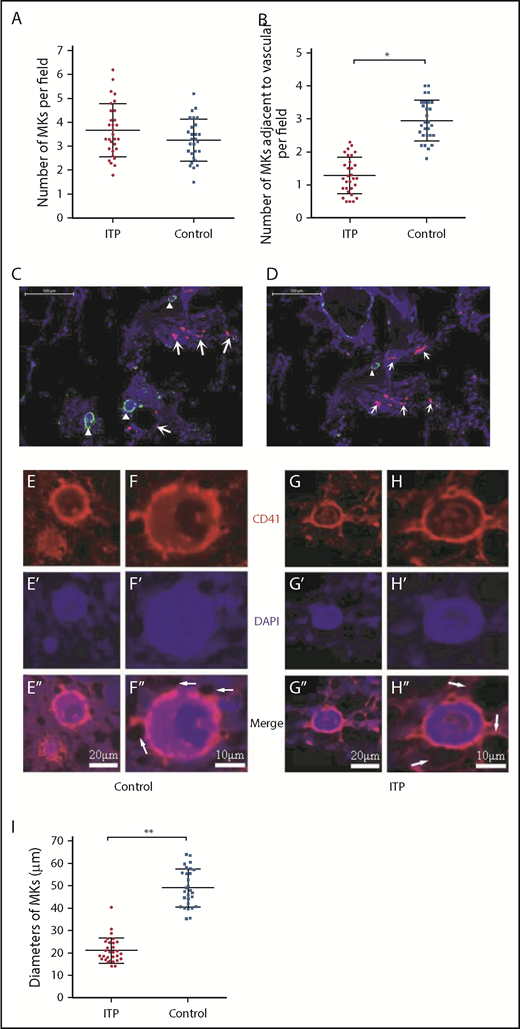
Reduced platelet production and impaired MK distribution and maturation. Scatter dot plots show the total number of MKs per low-power field (A) and the number of MKs adjacent to the vasculature in each low-power field (B) in the ITP group (n = 30) and control group (n = 28). (C) Representative graph of BM stained with anti-CD31 (red), anti-CD41 (green), and DAPI (blue) showing the distribution of vascular cells and MKs in the BM niche in the control group (scale bar, 100 μm). (D) Representative graph of BM stained with anti-CD31 (red), anti-CD41 (green), and DAPI (blue) showing the distribution of vascular cells and MKs in the BM niche in the ITP group (scale bar, 100 μm). Arrowheads in panels C-D indicate MKs near the sinusoids in the BM. Arrows in panels C-D indicate the endothelial cells in the BM. (E-E″) Representative graph of MKs in the vascular niche of the control group showing the size of MKs (scale bar, 20 μm). (F-F″) High-power magnification of MKs in the vascular niche of the control group showing the size of MKs (scale bar, 10 μm). (G-G″) Representative graph of MKs in the vascular niche of the ITP group showing the size of MKs (scale bar, 20 μm). (H-H″) High-power magnification of MKs in the vascular niche of the ITP group showing the size of MKs (scale bar, 10 μm). The white arrows in panels F″ and H″ refer to the sinusoids. (I) Scatter dot plots show the diameters of MKs located adjacent to the sinusoidal endothelium in the ITP group (n = 30) and the control group (n = 28). Data shown in panels A-B are pooled from 10 independent experiments with 4 to 8 samples per experiment. Data are shown as mean ± SD. Each point represents the mean adjusted value of 3 replicates for each individual patient. P values were calculated using the Mann-Whitney U test (A,I) or the Kolmogorov-Smirnov test (B). *P < .001, **P = .003.
Reduced platelet production and impaired MK distribution and maturation. Scatter dot plots show the total number of MKs per low-power field (A) and the number of MKs adjacent to the vasculature in each low-power field (B) in the ITP group (n = 30) and control group (n = 28). (C) Representative graph of BM stained with anti-CD31 (red), anti-CD41 (green), and DAPI (blue) showing the distribution of vascular cells and MKs in the BM niche in the control group (scale bar, 100 μm). (D) Representative graph of BM stained with anti-CD31 (red), anti-CD41 (green), and DAPI (blue) showing the distribution of vascular cells and MKs in the BM niche in the ITP group (scale bar, 100 μm). Arrowheads in panels C-D indicate MKs near the sinusoids in the BM. Arrows in panels C-D indicate the endothelial cells in the BM. (E-E″) Representative graph of MKs in the vascular niche of the control group showing the size of MKs (scale bar, 20 μm). (F-F″) High-power magnification of MKs in the vascular niche of the control group showing the size of MKs (scale bar, 10 μm). (G-G″) Representative graph of MKs in the vascular niche of the ITP group showing the size of MKs (scale bar, 20 μm). (H-H″) High-power magnification of MKs in the vascular niche of the ITP group showing the size of MKs (scale bar, 10 μm). The white arrows in panels F″ and H″ refer to the sinusoids. (I) Scatter dot plots show the diameters of MKs located adjacent to the sinusoidal endothelium in the ITP group (n = 30) and the control group (n = 28). Data shown in panels A-B are pooled from 10 independent experiments with 4 to 8 samples per experiment. Data are shown as mean ± SD. Each point represents the mean adjusted value of 3 replicates for each individual patient. P values were calculated using the Mann-Whitney U test (A,I) or the Kolmogorov-Smirnov test (B). *P < .001, **P = .003.
Impaired MK distribution is associated with alterations in the BM CXCL12/CXCR4 axis in ITP patients
The concentration of CXCL12 in the BM of ITP patients was markedly lower than that of controls (1879.43 ± 404.53 pg/mL vs 3671.86 ± 936.37 pg/mL, respectively; P < .001; Figure 2A), whereas the concentration of CXCL12 in the PB plasma was comparable between the 2 groups (774.37 ± 153.5 pg/mL vs 722.14 ± 184.7 pg/mL, respectively; P = .354; Figure 2B). The concentrations of TPO were not significantly different between ITP patients and controls (96.3 ± 7.99 pg/mL vs 98.34 ± 11.4 pg/mL, respectively; P = .586; Figure 2C). The TPO concentration in PB plasma was approximately equivalent to that in the BM plasma. The TPO concentration in PB plasma was 97.3 ± 9.3 pg/mL in the ITP group and 95.4 ± 10.7 pg/mL in the control group. No difference was found in the PB plasma TPO concentrations between the ITP and control groups (P = .154).
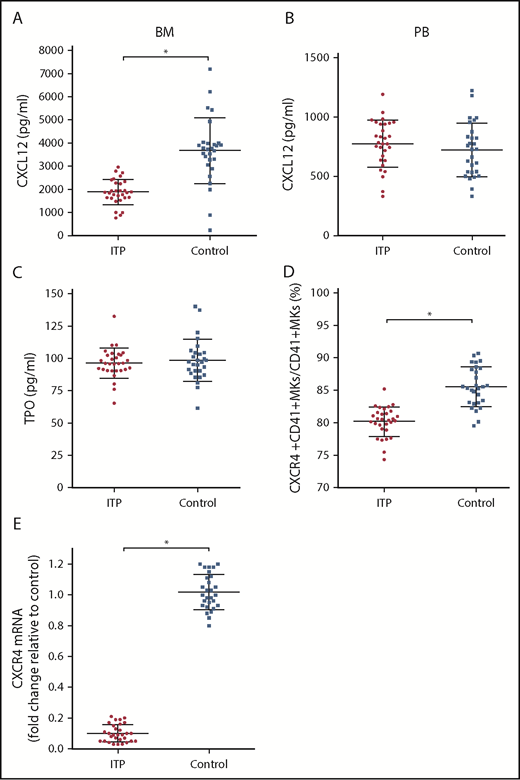
Alterations in the CXCL12/CXCR4 axis in ITP patients. (A) BM CXCL12 concentration analyzed by ELISA in the ITP group (n = 30) and control group (n = 28). (B) PB CXCL12 concentration analyzed by ELISA in the ITP group (n = 30) and control group (n = 28). (C) BM TPO concentration analyzed by ELISA in the ITP group (n = 30) and control group (n = 28). (D) Percentage of CXCR4+ CD41+ MKs analyzed by FACS in the ITP group (n = 30) and control group (n = 28). (E) CXCR4 mRNA in BM MKs in the ITP group (n = 30) and control group (n = 28) analyzed by PCR. Data are pooled from 10 independent experiments with 4 to 8 samples per experiment. Data are shown as mean ± SD. Each point represents the mean adjusted value of 3 replicates for each individual patient. P values were calculated using the Mann-Whitney U test. *P < .001.
Alterations in the CXCL12/CXCR4 axis in ITP patients. (A) BM CXCL12 concentration analyzed by ELISA in the ITP group (n = 30) and control group (n = 28). (B) PB CXCL12 concentration analyzed by ELISA in the ITP group (n = 30) and control group (n = 28). (C) BM TPO concentration analyzed by ELISA in the ITP group (n = 30) and control group (n = 28). (D) Percentage of CXCR4+ CD41+ MKs analyzed by FACS in the ITP group (n = 30) and control group (n = 28). (E) CXCR4 mRNA in BM MKs in the ITP group (n = 30) and control group (n = 28) analyzed by PCR. Data are pooled from 10 independent experiments with 4 to 8 samples per experiment. Data are shown as mean ± SD. Each point represents the mean adjusted value of 3 replicates for each individual patient. P values were calculated using the Mann-Whitney U test. *P < .001.
Using FACS analysis, we determined that the percentage of CXCR4+ CD41+ MKs in CD41+ MKs in the BM from the ITP patients was markedly lower than that of the controls (80.16% ± 1.66% vs 85.51% ± 2.46%, respectively; P < .001; Figure 2D). Furthermore, CXCR4 messenger RNA (mRNA) levels in MKs were reduced more than 10-fold in ITP patients relative to those in controls (Figure 2E), which indicates that a decrease in the amount of CD41+ CXCR4+ MKs may be a consequence of decreased CXCR4 transcription within MKs.
Reduced BM CXCL12 concentrations are associated with impaired nestin+ MSCs
Given that nestin+ MSCs have been reported to be the main source of CXCL12 in the BM niche, it is reasonable to infer that nestin+ MSCs are likely to be compromised in ITP, which also raises the issue of how nestin+ MSC function is impaired in ITP. We determined that the CXCL12 mRNA level in nestin+ MSCs was reduced more than 40-fold in ITP patients compared with controls (Figure 3A), and there was also a decrease in the proportion of CXCL12+ nestin+ MSCs by FACS (11.16% ± 2.78% vs 22.87% ± 2.71%, respectively; P < .001; Figure 3B).

Reduced expression of CXCL12 by impaired BM nestin+MSCs. (A) Expression of the CXCL12 mRNA in nestin+ MSCs analyzed by PCR in the ITP group (n = 30) and control group (n = 28). (B) Proportion of CXCL12+ nestin+ MSCs in nestin+ MSCs analyzed by FACS in the ITP group (n = 30) and control group (n = 28). (C) Proportion of nestin+ MSCs among CD45− CD31− CD235a− stromal cells analyzed by FACS in the ITP group (n = 30) and control group (n = 28). (D) Proportion of CD45− CD31− CD235a− stromal cells among mononuclear cells analyzed by FACS in the ITP group (n = 30) and control group (n = 28) (see supplemental Figure S3 for the gating strategy used). (E) Representative merge image of BM biopsy tissues immunofluorescently stained with CD34 (green), nestin (red), and DAPI (blue) antibodies in the ITP group (scale bar, 50 μm). (F) Representative image of BM biopsy tissue immunofluorescently stained with CD34 (green), nestin (red), and DAPI (blue) antibodies in the control group (scale bar, 50 μm). (G) Number of nestin+ MSCs per square millimeter of BM biopsy tissue analyzed by immunofluorescence in the ITP group (n = 30) and control group (n = 28). (H) Nestin mRNA in nestin+ MSCs analyzed by PCR in the ITP group (n = 30) and control group (n = 28). Data are pooled from 10 independent experiments with 4 to 8 samples per experiment (A-D,G,H). Data are shown as mean ± SD. Each point represents the mean adjusted value of 3 replicates for each individual patient. P values were calculated using the Mann-Whitney U test. *P < .001.
Reduced expression of CXCL12 by impaired BM nestin+MSCs. (A) Expression of the CXCL12 mRNA in nestin+ MSCs analyzed by PCR in the ITP group (n = 30) and control group (n = 28). (B) Proportion of CXCL12+ nestin+ MSCs in nestin+ MSCs analyzed by FACS in the ITP group (n = 30) and control group (n = 28). (C) Proportion of nestin+ MSCs among CD45− CD31− CD235a− stromal cells analyzed by FACS in the ITP group (n = 30) and control group (n = 28). (D) Proportion of CD45− CD31− CD235a− stromal cells among mononuclear cells analyzed by FACS in the ITP group (n = 30) and control group (n = 28) (see supplemental Figure S3 for the gating strategy used). (E) Representative merge image of BM biopsy tissues immunofluorescently stained with CD34 (green), nestin (red), and DAPI (blue) antibodies in the ITP group (scale bar, 50 μm). (F) Representative image of BM biopsy tissue immunofluorescently stained with CD34 (green), nestin (red), and DAPI (blue) antibodies in the control group (scale bar, 50 μm). (G) Number of nestin+ MSCs per square millimeter of BM biopsy tissue analyzed by immunofluorescence in the ITP group (n = 30) and control group (n = 28). (H) Nestin mRNA in nestin+ MSCs analyzed by PCR in the ITP group (n = 30) and control group (n = 28). Data are pooled from 10 independent experiments with 4 to 8 samples per experiment (A-D,G,H). Data are shown as mean ± SD. Each point represents the mean adjusted value of 3 replicates for each individual patient. P values were calculated using the Mann-Whitney U test. *P < .001.
Among the CD45− CD31− CD235a− BM stromal cells, the fraction of nestin+ MSCs in ITP patients was significantly reduced compared with that in controls (3.67% ± 1.24% vs 12.83% ± 3.80%, respectively; P < .001; Figure 3C), whereas the proportion of BM stromal cells in mononuclear cells was comparable between ITP patients and controls (2.34% ± 0.56% vs 2.51% ± 0.66%, respectively; P = .439; Figure 3D). Immunofluorescence analysis of BM tissues showed that nestin+ MSCs were distributed adjacent to CD34+ endothelial cells and that the number of nestin+ cells was significantly reduced in ITP patients (1.6 ± 0.17 cells/mm2 vs 3.5 ± 0.54 cells/mm2, respectively; P < .001; Figure 3E-G). Furthermore, the nestin mRNA level was also markedly reduced in nestin+ MSCs in ITP patients compared with that in controls (Figure 3H).
Impaired nestin+ MSCs are associated with decreased sympathetic innervation
As shown in Figure 4A, apoptosis of nestin+ MSCs was dramatically increased in ITP patients compared with controls (22.88% ± 2.67% vs 11.42% ± 3.94%, respectively; P < .001).
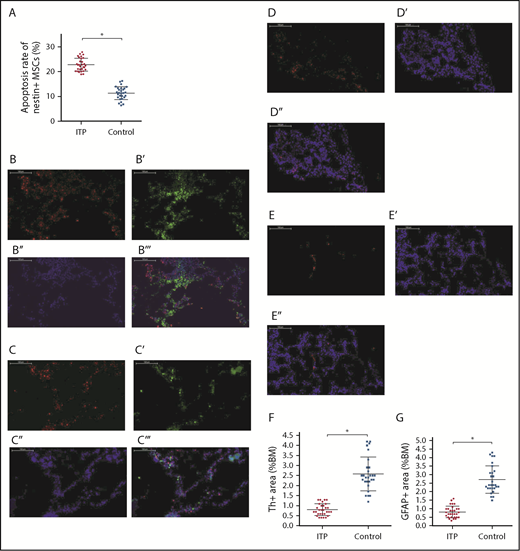
Increased apoptosis rate of BM nestin+MSCs and reduced sympathetic innervation of BM nestin+MSCs in ITP patients. (A) Apoptosis rate of nestin+ MSCs analyzed by FACS in the ITP group (n = 30) and control group (n = 28). (B-B′′′) Representative images of BM biopsy tissues immunofluorescently stained with anti-nestin (red), anti-tyrosine hydroxylase (green), and DAPI (blue); merged image indicates the distribution and quantity of nestin+ MSCs and SNs in the control group (scale bar, 100 μm). (C-C′′′) Representative images of BM biopsy tissue immunofluorescently stained with anti-nestin (red), anti-tyrosine hydroxylase (green), and DAPI (blue); merged image shows the distribution and quantity of nestin+ MSCs and SNs in the ITP group (scale bars, 100 μm). (D-D″) Representative images of the BM biopsy tissue from the control group stained with anti-GFAP (red) and DAPI (blue) showing the distribution and quantity of Schwann cells (scale bars, 100 μm). (E-E″) Representative images of BM biopsy tissue from the ITP group stained with anti-GFAP (red) and DAPI (blue) showing the distribution and quantity of Schwann cells (scale bars, 100 μm). (F) Quantification of tyrosine hydroxylase+ (Th+) fibers in the BM from controls (n = 28) and ITP patients (n = 30). (G) Quantification of GFAP+ cells in the BM from controls (n = 28) and ITP patients (n = 30). Data are pooled from 10 independent experiments with 4 to 8 samples per experiment (A,F-G). Data are shown as mean ± SD. Each point represents the mean adjusted value of 3 replicates for each individual patient. P values were calculated using the Mann-Whitney U test. *P < .001.
Increased apoptosis rate of BM nestin+MSCs and reduced sympathetic innervation of BM nestin+MSCs in ITP patients. (A) Apoptosis rate of nestin+ MSCs analyzed by FACS in the ITP group (n = 30) and control group (n = 28). (B-B′′′) Representative images of BM biopsy tissues immunofluorescently stained with anti-nestin (red), anti-tyrosine hydroxylase (green), and DAPI (blue); merged image indicates the distribution and quantity of nestin+ MSCs and SNs in the control group (scale bar, 100 μm). (C-C′′′) Representative images of BM biopsy tissue immunofluorescently stained with anti-nestin (red), anti-tyrosine hydroxylase (green), and DAPI (blue); merged image shows the distribution and quantity of nestin+ MSCs and SNs in the ITP group (scale bars, 100 μm). (D-D″) Representative images of the BM biopsy tissue from the control group stained with anti-GFAP (red) and DAPI (blue) showing the distribution and quantity of Schwann cells (scale bars, 100 μm). (E-E″) Representative images of BM biopsy tissue from the ITP group stained with anti-GFAP (red) and DAPI (blue) showing the distribution and quantity of Schwann cells (scale bars, 100 μm). (F) Quantification of tyrosine hydroxylase+ (Th+) fibers in the BM from controls (n = 28) and ITP patients (n = 30). (G) Quantification of GFAP+ cells in the BM from controls (n = 28) and ITP patients (n = 30). Data are pooled from 10 independent experiments with 4 to 8 samples per experiment (A,F-G). Data are shown as mean ± SD. Each point represents the mean adjusted value of 3 replicates for each individual patient. P values were calculated using the Mann-Whitney U test. *P < .001.
Immunofluorescence staining of BM tissue showed a high degree of overlap between SN and nestin+ MSCs in both ITP patients and controls (Figure 4B-B″,C-C″) and demonstrated a reduced number of Schwann cells in ITP patients (Figure 4D-E). Quantitative analysis indicated that the number of SN fibers and Schwann cells was also significantly decreased in ITP patients compared with controls (Figure 4F-G).
We further examined the expression of the sympathetic neurotransmitter norepinephrine (NE) and its receptor, β3-adrenoreceptor (β3-AR), on nestin+ MSCs to elucidate whether the sympathetic innervation of nestin+ MSCs was reduced in ITP patients. The immunohistochemical analysis showed that the NE levels were significantly reduced in the BM of ITP patients compared with that in the controls (Figure 5A-A′,B-B′). The integral optical density of NE immunostaining in ITP patients was markedly decreased (Figure 5 C). Similarly, β3-AR expression on nestin+ MSCs was substantially less pronounced in ITP patients than in controls (Figure 5D-E).
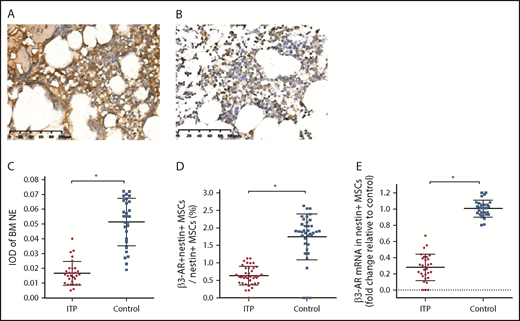
Reduced sympathetic innervation of BM nestin+MSCs in ITP patients. (A) Representative pictures of BM biopsy tissue from the control group immunohistochemically stained with an anti-NE antibody and hematoxylin and eosin. Scale bar, 100 μm. (B) Representative pictures of BM biopsy tissue from the ITP group immunohistochemically stained with an anti-NE antibody and hematoxylin and eosin. Scale bar, 100 μm. (C) Integral optical densities (IODs) of BM NE staining in the ITP group (n = 30) and control group (n = 28). (D) Percentage of β3-AR+ nestin+ MSCs in nestin+ MSCs analyzed by FACS in the ITP group (n = 30) and control group (n = 28). (E) β3-AR mRNA level in nestin+ MSCs in the ITP group (n = 30) and control group (n = 28). Data are pooled from 10 independent experiments with 4 to 8 samples per experiment (C-E). Data are shown as mean ± SD. Each point represents the mean adjusted value of 3 replicates for each individual patient. P values were calculated using the Mann-Whitney U test. *P < .001.
Reduced sympathetic innervation of BM nestin+MSCs in ITP patients. (A) Representative pictures of BM biopsy tissue from the control group immunohistochemically stained with an anti-NE antibody and hematoxylin and eosin. Scale bar, 100 μm. (B) Representative pictures of BM biopsy tissue from the ITP group immunohistochemically stained with an anti-NE antibody and hematoxylin and eosin. Scale bar, 100 μm. (C) Integral optical densities (IODs) of BM NE staining in the ITP group (n = 30) and control group (n = 28). (D) Percentage of β3-AR+ nestin+ MSCs in nestin+ MSCs analyzed by FACS in the ITP group (n = 30) and control group (n = 28). (E) β3-AR mRNA level in nestin+ MSCs in the ITP group (n = 30) and control group (n = 28). Data are pooled from 10 independent experiments with 4 to 8 samples per experiment (C-E). Data are shown as mean ± SD. Each point represents the mean adjusted value of 3 replicates for each individual patient. P values were calculated using the Mann-Whitney U test. *P < .001.
Impaired MK distribution is potentially mediated by alteration of the CXCL12/CXCR4/VEGFR1 signaling pathway
It has been reported that the expression of VEGF and MMP-9 in MKs may be upregulated when CXCL12 acts on CXCR4.34 VEGF acting on VEGFR1 may upregulate the expression of CXCR4 in MKs, which may promote the migration of MKs under the chemotaxis of CXCL12. Because the MK distribution in the BM of the ITP patients was abnormal, we investigated whether the CXCR4- and VEGFR1-mediated signaling pathway was disrupted. The results showed that the concentrations of both MMP-9 and VEGF in the BM of ITP patients were significantly reduced compared with those in controls (338.77 ± 73.08 vs 822.57 ± 166.10, respectively; P < .001; 95.8 ± 22.42 vs 207.93 ± 51.05, respectively; P < .001; Figure 6A-B). Moreover, MMP-9 mRNA and VEGF mRNA levels were also decreased in ITP patients compared with controls (Figure 6C-D). In addition, levels of VEGFR1 mRNA and protein were significantly reduced in MKs from ITP patients (Figure 6E-F). Expression of VEGFR1 protein was significantly decreased in the ITP group compared with the control group (0.22 ± 0.05 vs 0.43 ± 0.06; P < .05).
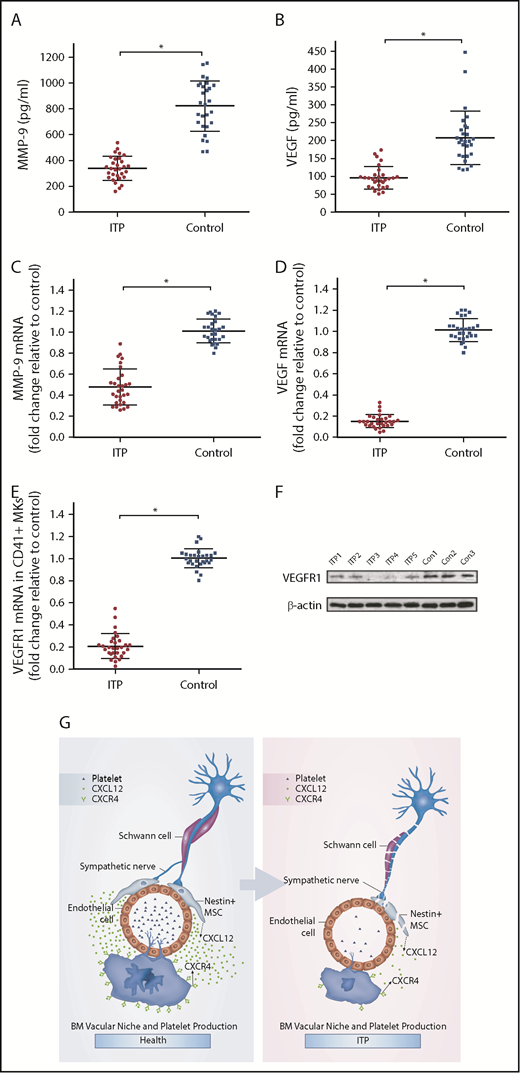
CXCR4 and VEGFR1 mediated impaired MK distribution. (A) Concentration of MMP-9 in the BM analyzed by ELISA in the ITP group (n = 30) and control group (n = 28). (B) Concentration of VEGF in the BM analyzed by ELISA in the ITP group (n = 30) and control group (n = 28). (C) Expression of MMP-9 mRNA in CD41+ MKs analyzed by RT-PCR in the ITP group (n = 30) and control group (n = 28). (D) Expression of VEGF mRNA in CD41+ MKs analyzed by RT-PCR in the ITP group (n = 30) and control group (n = 28). (E) Expression of VEGFR1 mRNA in CD41+ MKs analyzed by RT-PCR in the ITP group (n = 30) and control group (n = 28). (F) VEGFR1 protein levels in CD41+ MKs analyzed by western blot analysis in the ITP group (n = 30) and control group (n = 28). (G) Model illustrating the BM vascular niche alterations, disrupted MK distribution, and reduced platelet production in ITP patients. Data are pooled from 10 independent experiments with 4 to 8 samples per experiment (A-E). Data are shown as mean ± SD. Each point represents the mean adjusted value of 3 replicates for each individual patient. P values were calculated using the Mann-Whitney U test. *P < .001.
CXCR4 and VEGFR1 mediated impaired MK distribution. (A) Concentration of MMP-9 in the BM analyzed by ELISA in the ITP group (n = 30) and control group (n = 28). (B) Concentration of VEGF in the BM analyzed by ELISA in the ITP group (n = 30) and control group (n = 28). (C) Expression of MMP-9 mRNA in CD41+ MKs analyzed by RT-PCR in the ITP group (n = 30) and control group (n = 28). (D) Expression of VEGF mRNA in CD41+ MKs analyzed by RT-PCR in the ITP group (n = 30) and control group (n = 28). (E) Expression of VEGFR1 mRNA in CD41+ MKs analyzed by RT-PCR in the ITP group (n = 30) and control group (n = 28). (F) VEGFR1 protein levels in CD41+ MKs analyzed by western blot analysis in the ITP group (n = 30) and control group (n = 28). (G) Model illustrating the BM vascular niche alterations, disrupted MK distribution, and reduced platelet production in ITP patients. Data are pooled from 10 independent experiments with 4 to 8 samples per experiment (A-E). Data are shown as mean ± SD. Each point represents the mean adjusted value of 3 replicates for each individual patient. P values were calculated using the Mann-Whitney U test. *P < .001.
Administration of VEGF-A increases MK migration to the vascular niche, stimulates platelet production, and is dependent on CXCR4 activity
Circulating platelet counts were 66 ± 28 × 109/L in the ITP model group and 117 ± 43 × 109/L in the control group (Figure 7A; P < .05; n = 5) .
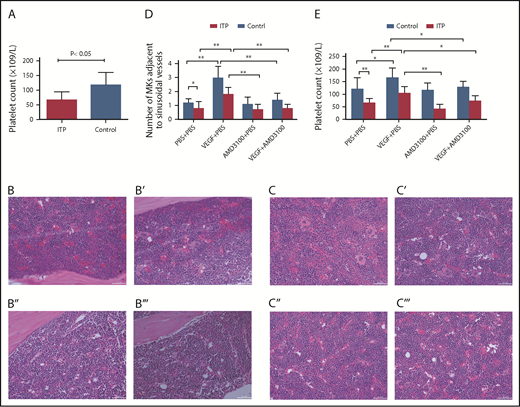
Platelet counts and MKs adjacent to sinusoidal vessels in mice treated with or without VEGF and/or AMD3100. (A) Platelet counts in the ITP model mice. Platelet counts were lower in the ITP model group than in the control group (66 ± 28 × 109/L vs 117 ± 43 ×109/L, respectively; P < .05; n = 5). Visualization of MKs in BM sections from ITP mice (B-B′′′) or from control mice (C-C′′′) treated with PBS + PBS (B,C), VEGF-A165 + PBS (B′,C′), AMD3100+PBS (B″,C″), or VEGF-A165 + AMD3100 (B′′′,C′′′) (scale bars, 100 μm). (D) Data are expressed as mean ± SEM. (E) Circulating platelet numbers were enumerated 24 hours after the last growth factor administration. Data are expressed as mean ± SEM. n = 5 mice per group. *P < .01; **P < .001.
Platelet counts and MKs adjacent to sinusoidal vessels in mice treated with or without VEGF and/or AMD3100. (A) Platelet counts in the ITP model mice. Platelet counts were lower in the ITP model group than in the control group (66 ± 28 × 109/L vs 117 ± 43 ×109/L, respectively; P < .05; n = 5). Visualization of MKs in BM sections from ITP mice (B-B′′′) or from control mice (C-C′′′) treated with PBS + PBS (B,C), VEGF-A165 + PBS (B′,C′), AMD3100+PBS (B″,C″), or VEGF-A165 + AMD3100 (B′′′,C′′′) (scale bars, 100 μm). (D) Data are expressed as mean ± SEM. (E) Circulating platelet numbers were enumerated 24 hours after the last growth factor administration. Data are expressed as mean ± SEM. n = 5 mice per group. *P < .01; **P < .001.
VEGF-A can induce MK clustering around the sinusoidal vessels in both ITP mice and control mice (Figure 7B-C). Importantly, we show here that VEGF-A–induced relocalization of MKs to the vascular niche was significantly suppressed by treatment with AMD3100 in both groups. In ITP mice, the numbers of MKs adjacent to sinusoids/field were 1.8 ± 0.5 in the VEGF plus PBS group and 0.8 ± 0.3 in the VEGF-A plus AMD3100 group. In control mice, the numbers of MKs adjacent to sinusoids/field were 3.0 ± 0.8 in the VEGF-A plus PBS group and 1.4 ± 0.5 in the VEGF plus AMD3100 group (P < .01; Figure 7D).
Here, we also show that VEGF-A can increase platelet counts in mice in both the ITP and control groups. Moreover, the effect of VEGF-A on platelet counts can be completely abrogated in mice treated with AMD3100. In ITP mice, the platelet counts were 104 ± 27 in the VEGF plus PBS group and 73 ± 21 in the VEGF-A plus AMD3100 group (P < .01). In control mice, the numbers of MKs adjacent to the sinusoids/field were 167 ± 37 in the VEGF-A plus PBS group and 128 ± 22 in the VEGF plus AMD3100 group (P < .01; Figure 7E).
Discussion
Our results suggest that BM sympathetic neuropathy and nestin+ MSC apoptosis could potentially have an effect on the aberrant BM CXCL12/CXCR4 axis, which may be associated with abnormal MK distribution in the BM niche in ITP patients, and result in reduced platelet production (Figure 6G).
Consistent with previous studies,35 we also determined that P-RP was increased whereas A-RP was markedly reduced in patients with ITP, which indicates that platelet production was decreased in our sample of ITP patients. A previous study from our team about the microenvironment of ITP patients found that defects in CD34+ cells and BM vessels are not involved in the occurrence of ITP.36 In the current study, we determined that the distribution of MKs was abnormal in ITP patients, who exhibited reduced numbers of MKs in the BM vascular niche. However, the total number of MKs and MK progenitors was not significantly different between ITP patients and controls.
Previous studies have shown that MKs in ITP patients display impaired maturation, as manifested by a reduction in high-ploidy MKs and granularity.1,37 Tomer et al38 showed that the increase in high-ploidy cells in ITP is associated with a decrease in 16N cells, but not in ≤8N cells. Rivière et al39 found no difference in proliferation, ploidy, or expression of surface markers. In our study, we did not see a shift of MK ploidy in ITP patients when compared with healthy controls (data not shown), which indicates that there is no difference in MK polyploidization between newly diagnosed ITP patients and controls. The reason for the abnormal distribution of MKs in the BM niche may be that MK migration was interrupted in ITP patients because the concentration of CXCL12 (which is the most potent chemokine for MKs) and the expression of its physiological receptor, CXCR4, by MKs were markedly reduced.9,10 It has been reported that CXCL12 can induce CXCR4 promoter activity.40 In addition, CXCL12/CXCR4 signaling in MKs induces VEGF production, which, in turn, may increase the expression of CXCR4 on MKs by acting on VEGFR1.34,41 Therefore, the reduced expression of CXCR4 in MKs was consistent with reduced CXCL12 and VEGF concentrations in the BM plasma of ITP patients.
Research on CXCL12 in ITP has indicated a potential role of CXCL12 in the occurrence and prognosis of ITP.42 Our previous study on prolonged thrombocytopenia after allogeneic HSC transplantation showed a decreased CXCL12 concentration in the BM plasma of prolonged thrombocytopenia patients.43 The present study illustrates the important role of the CXCL12/CXCR4 axis in ITP from a novel point of view.
Niswander et al10 found that CXCL12 regulates the maturational movement of MKs toward the vasculature during megakaryopoiesis. Here, we measured the concentration of CXCL12 in the BM and PB. The concentration of CXCL12 in the BM of was markedly lower ITP patients than in controls, whereas the concentration of CXCL12 in the PB plasma was comparable between the 2 groups. This finding corroborates our hypothesis that impaired MK distribution is associated with alterations in the BM CXCL12/CXCR4 axis in ITP patients.
CXCL12 is expressed by several types of cells, such as osteoblasts, endothelial cells, and MSCs.13,15 Nestin+ MSCs have been reported to be the main source of CXCL12 in the BM and express substantially more abundant CXCL12 mRNA compared with that of the nestin- MSCs.13,17,18,20,44 Nestin+ MSCs are relatively rare nonhematopoietic perivascular cells that are innervated by SNs; they exhibit all colony-forming unit fibroblastic activities and are an essential cellular component of the BM niche.15,18,45 As an important subset of MSCs and the major source of CXCL12 in the BM, nestin+ MSCs are likely damaged in ITP. Not surprisingly, our results showed that nestin+ MSCs displayed increased apoptosis and reduced numbers in ITP patients, and levels of CXCL12 mRNA and protein were both significantly reduced in nestin+ MSCs from ITP patients compared with those from controls. Our results suggest that nestin+ MSCs may be the functional portion of MSCs and a more specific target for therapy. However, additional experiments are required to determine whether the immunosuppressive property of MSCs also resides in nestin+ MSCs.
Studies have shown that BM SNs are indispensable for the normal function of nestin+ MSCs17-19,46 and have direct effects on thrombocytopoiesis.21 By performing an immunofluorescence analysis of BM tissues, we determined that the number of SN fibers and Schwann cells was reduced in ITP patients. In patients with type 1 autoimmune diabetes, peri-islet Schwann cells were impaired by an antibody against Schwann cells.47 Kwa et al48 determined that there were circulating anti-S100β (Schwann cell marker) immunoglobulin G autoantibodies against proliferating, nonmyelinating human Schwann cells in autoimmune inflammatory neuropathies.
By interacting with CXCR4, CXCL12 can increase the expression of VEGF and MMP-9 in MKs.49 VEGF can upregulate the expression of CXCR4 on MKs,34,50 and MMP-9 is able to degenerate the basement membrane; therefore, VEGF and MMP-9 may further promote the migration of MKs. Consistent with the reduced BM CXCL12 concentrations in ITP patients, both MMP-9 and VEGF mRNA in MKs and MMP-9 and VEGF proteins in BM plasma were significantly decreased in ITP patients, which further contributed to the disrupted distribution of MKs in ITP patients.
Taken together, our data help to characterize the pathogenesis of ITP. Reduced SN innervation of nestin+ MSCs is potentially associated with increased apoptosis and abnormal function of nestin+ MSCs, thus leading to reduced expression of the chemokine CXCL12. Moreover, the reduced BM CXCL12 concentration contributes to impaired MK distribution via CXCR4- and VEGFR1-mediated pathways. Although additional in vivo studies are required to verify our findings, these data may provide clues to explore potentially novel treatment approaches for ITP.
The full-text version of this article contains a data supplement.
Acknowledgments
The authors thank Hui-xin Liu from the research department of Peking University People’s Hospital for her statistical assistance.
This work was supported by the National Natural Science Foundation of China (grants 81470343 and 81670116), the National Natural Science Foundation for Young Scholars of China (grant 81600132), the Key Program of National Natural Science Foundation of China (grant 81730004), the Natural Science Foundation of Beijing Municipality (grant 7171013), the Beijing Municipal Science and Technology Commission (grant Z171100001017084), and the National Key Research and Development Program of China (grant 2017YFA0105503)
Authorship
Contribution: M.W. and R.F. designed and performed experiments, analyzed and interpreted data, and wrote the manuscript; J.-m.Z. and L.-l.X. performed experiments and analyzed and interpreted data; F.-e.F., C.-c.W., Q.-m.W., X.-l.Z., Y.H., J.X., and Y.K. collected samples and performed experiments; H.-x.F., M.L., and Y.-j.C. provided samples and clinical data; L.-p.X., K.-y.L. and X.-j.H. contributed to the study design; X.-h.Z. supervised and coordinated the studies, designed research, analyzed and interpreted data, and wrote the manuscript; and all authors critically read and contributed to the final version of the manuscript.
Conflict-of-interest disclosure: The authors declare no competing financial interests.
Correspondence: Xiao-hui Zhang, Peking University People's Hospital, Peking University Institute of Hematology, 11 Xizhimen South St, Xicheng District, Beijing 100044, China; e-mail: zhangxh100@sina.com.

