

Key Points
Outcomes for patients with BL in Malawi are poor with 1-year OS of 40%.
Most deaths are from progressive BL, and outcomes seem to be improved with more intense chemotherapy regimens.

Abstract
Burkitt lymphoma (BL) is common in sub-Saharan Africa (SSA). In high-income countries, BL is highly curable with chemotherapy. However, there are few prospective studies from SSA describing nonpediatric BL and no regional standard of care. Thirty-five participants age 15 years or older with newly diagnosed BL were enrolled in Malawi from 2013 to 2018. Chemotherapy was administered according to institutional guidelines, with concurrent antiretroviral therapy if HIV infected. Median age was 21 years (range, 15-61) and 15 participants (43%) were HIV infected. Twenty-seven participants (77%) had stage III to IV disease, and 19 (54%) had Eastern Cooperative Oncology Group performance status >1. Among HIV-infected participants, median CD4 count was 130 (range, 29-605) and 10 (67%) had suppressed HIV viral load. Four participants (11%) died before receiving chemotherapy. First-line chemotherapy consisted of: cyclophosphamide, doxorubicin, vincristine, and prednisone (CHOP) (n = 22 [71%]); infusional etoposide, prednisolone, vincristine, cyclophosphamide, and doxorubicin (n = 4 [13%]); high-dose methotrexate-based chemotherapy (n = 4 [13%]); and rituximab plus CHOP (n = 1 [3%]). Among 28 evaluable participants, 14 (50%) achieved a complete response. Median overall survival (OS) was 7 months; 1-year OS was 40% (95% confidence interval [CI], 24%-56%). Sixteen (73%) of 22 deaths were a result of disease progression. Compared with CHOP, more intensive chemotherapy was associated with decreased mortality (hazard ratio, 0.24; 95% CI, 0.05-1.02; P = .05). This is among the best characterized prospective cohorts of nonpediatric BL in SSA. Most deaths resulted from progressive BL. Patients who received more intensive therapy seemed to have better outcomes. Defining optimal approaches is an urgent priority in SSA.
Introduction
Burkitt lymphoma (BL) is the commonest cancer among children in sub-Saharan Africa (SSA).1-3 BL is less common in adults, but the incidence of BL is estimated to be at least 50 times higher in HIV-positive adults than in HIV-negative adults.4
In high-income countries, pediatric BL can be cured in >90% of cases with high-intensity chemotherapy, including high-dose methotrexate.5 Outcomes have improved for children in SSA who are treated with chemotherapy regimens appropriately tailored to the setting, but outcomes remain inferior to those in high-income countries.6 In published literature from the region, 1-year overall survival (OS) has ranged from 40% to 73%, with substantial variation based on patient characteristics, treatment regimens, and completeness of follow-up.7
As in children, the prognosis for adolescents and adults with BL in high-income countries has improved dramatically. Improvements in therapy include application of high-dose methotrexate-based chemotherapy,8,9 addition of rituximab,10 and more recently, use of lower-intensity continuous infusion regimens.11 Furthermore, regardless of HIV status, outcomes are similar.12,13
However, little is known about outcomes in adolescents and adults with BL in SSA. In SSA, rituximab remains prohibitively expensive in most settings, and because of the weak cancer care infrastructure, high-intensity chemotherapy regimens are not easily applied. Most previous reports on BL from SSA have focused on children and have often been limited in several ways. Limitations mentioned in the literature include nonstandardized treatment, loss to follow-up, and limited diagnostic pathology to reliably distinguish non-Hodgkin lymphoma subtypes.7
In this manuscript, we describe the results of a prospective cohort of adolescents and adults with BL from the Kamuzu Central Hospital (KCH) Lymphoma Study cohort in Malawi.14 Malawi is a low-income country in SSA with a high prevalence of HIV and Epstein-Barr virus (EBV). To our knowledge, this is the first detailed prospective description of nonpediatric BL from SSA.
Methods
Study design and participants
The KCH Lymphoma Study is a prospective, observational cohort of pathologically confirmed lymphoproliferative disorders diagnosed and treated at KCH in Lilongwe, the capital of Malawi. KCH is the referral hospital for the central and northern regions of Malawi, serving a population of approximately 9 million people. For this analysis, participants were included if they were age 15 years or older and were newly diagnosed with BL from May 2013 to March 2018. All participants were followed until death, lost to follow-up, or administrative censoring on 30 June 2018. The full study protocol has been described in detail previously.14 Briefly, all diagnoses were pathologically confirmed using tissue biopsy and immunohistochemistry (IHC) with real-time evaluation in once-per-week interdisciplinary telepathology conferences. The telepathology conferences involved clinicians and 2 to 5 pathologists in the United States and Malawi who rendered a consensus diagnosis.15,16 The diagnosis of BL was made on the basis of the combination of typical morphologic features (eg, starry sky appearance, tingible body macrophages, high mitotic rate) along with typical IHC findings of CD20+, CD3–, BCL2–, TdT–, and Ki67 proliferation rate >95% (Figure 1). The real-time diagnostic workflow in Malawi has resulted in excellent concordance between locally rendered diagnoses and subsequent review in the United States.15 Additional characterization included additional IHC and in situ hybridization (ISH) for EBV-encoded RNA (EBER) at the University of North Carolina (UNC) in the United States.15 Cytogenetics and fluorescence in situ hybridization to detect MYC translocations are not available in Malawi. We prioritized sequencing investigations in the United States rather than cytogenetics or fluorescence in situ hybridization because of limited specimens. These sequencing investigations have included using RNA sequencing–based classifiers for distinguishing BL from diffuse large B-cell lymphoma and have confirmed the validity of the locally rendered diagnoses in Malawi.15
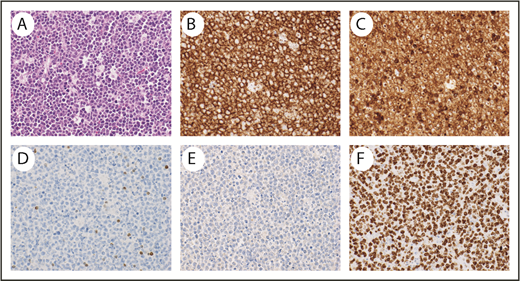
Representative pathology from a patient with BL. Hematoxylin and eosin stain demonstrates typical starry-sky appearance with a diffuse infiltrate of medium-sized lymphocytes and tingible-body macrophages (A), CD20 stains the malignant cells (B), CD10 stains the malignant cells (C), BCL2 is negative in the malignant cells and stains positive in background T lymphocytes (D), TdT is negative (E), and Ki67 is positive (F) in >95% of malignant cells. Magnification ×40 for all images.
Representative pathology from a patient with BL. Hematoxylin and eosin stain demonstrates typical starry-sky appearance with a diffuse infiltrate of medium-sized lymphocytes and tingible-body macrophages (A), CD20 stains the malignant cells (B), CD10 stains the malignant cells (C), BCL2 is negative in the malignant cells and stains positive in background T lymphocytes (D), TdT is negative (E), and Ki67 is positive (F) in >95% of malignant cells. Magnification ×40 for all images.
Written informed consent was obtained from all participants. If a participant was age 18 years or younger, guardian consent and child assent were obtained. This study was approved by the UNC Institutional Review Board and Malawi National Health Sciences Research Committee in accordance with the Declaration of Helsinki.
Patients underwent comprehensive baseline clinical and laboratory evaluation, as described previously.14,17 Ann Arbor stage was assessed by using physical examination, chest radiography, abdominal ultrasound, bone marrow biopsy, and lumbar puncture. Central nervous system involvement was defined as confirmed involvement of BL in the cerebrospinal fluid.
Treatment
Dosing and schedule for chemotherapy regimens used during the study period are described in supplemental Table 1. Per institutional standards of care, from May 2013 to July 2016, cyclophosphamide, doxorubicin, vincristine, and prednisone (CHOP) was routinely administered as first-line chemotherapy. Beginning in August 2016, standard first-line chemotherapy was changed after it became clear that response rates were poor with CHOP.
In the adult clinic, first-line chemotherapy was changed to a modified version of the infusional dose-adjusted etoposide, prednisolone, vincristine, cyclophosphamide, and doxorubicin (EPOCH) regimen.11 Twenty-four–hour infusions were administered over 8 hours on successive days because of logistical constraints prohibiting overnight infusion. Dose adjustments were made according to the National Cancer Institute protocol. However, instead of using nadir blood counts to make dose adjustments, they were made using the neutrophil and platelet counts at the start of each cycle.
In the pediatric clinic, first-line chemotherapy was changed to a modified version of the French-American-British 96 (FAB-96) protocol.18 The FAB-96 protocol in our clinic included a cyclophosphamide, vincristine, and prednisone (COP) prephase, followed by a cyclophosphamide, vincristine, prednisone, doxorubicin, and methotrexate (COPADM) induction phase and a cytarabine and methotrexate (CYM) consolidation phase. Methotrexate was dosed at 1 g/m2, a reduced dose compared with the original FAB-96 protocol. To prevent complications of methotrexate, pediatric patients were given continuous intravenous hyperhydration with alkalinized fluids and folinic acid rescue.
Other supportive care was administered similarly in both adults and pediatric patients. With each cycle, patients routinely received intrathecal methotrexate and hydrocortisone. Granulocyte colony-stimulating factor was not routinely available. Ciprofloxacin was given on days 8 to 21 of each cycle for anti-infective prophylaxis, especially if the patient was HIV positive or receiving more myelosuppressive non-CHOP regimens. All HIV-infected patients received antiretroviral therapy (ART) concurrently with chemotherapy. HIV-infected patients also typically were given fluconazole and cotrimoxazole prophylaxis. A chemotherapy regimen of etoposide, ifosfamide, and platinum was administered for relapsed disease in both adult and pediatric patients, although the administration schedules differed.19
Outcomes
The primary outcome was OS from the date of enrollment. Secondary outcomes were complete response, partial response, and progression-free survival (PFS). Response was assessed as described previously.14 We also attempted to identify cause of death. However, assessing the cause of death was not always straightforward because deaths frequently occurred at home or in remote hospitals; furthermore, there is no national death registry. Cause of death was therefore centrally adjudicated by at least 2 study clinicians on the basis of available clinical information, BL response status at last visit, and temporal relationship between date of death and last chemotherapy dose.
Statistical analysis
Differences in baseline characteristics between HIV-infected and HIV-negative patients were assessed by using Fisher’s exact tests for categorical data, Student t tests for normally distributed data, or Kruskal-Wallis tests for nonnormally distributed data. Kaplan-Meier curves were used to estimate OS and PFS. The log-rank test was used to assess differences in survival curves between groups. Cox proportional hazards were used to estimate hazard ratios (HRs) for OS. All analyses were conducted using STATA version 15.1 (STATA, College Station, TX). A 2-sided α of 0.05 was considered statistically significant. M.S.P. conducted the primary data analysis, and all authors had access to the primary clinical data. Deidentified data from this study will be made available with a data dictionary at the time of publication through Mendeley Data.
Results
Baseline characteristics and treatment
We identified 35 adolescents and adults with BL during the study period. Median age was 21 years (range, 15-61 years) (Table 1). Fifteen participants (43%) were HIV infected and 25 (71%) were men. Twenty-seven participants (77%) presented with stage III to IV disease, 25 (78%) of 32 had elevated lactate dehydrogenase (LDH), and 25 (76%) of 33 presented with aaIPI >1. BL involved the bone marrow in 4 (18%) of 22 patients and the central nervous system in 5 (14%). BL presented as primary abdominal disease in 23 participants (66%). Of participants with measurable tumors, 16 (66%) of 24 had bulky disease ≥10 cm.
Baseline characteristics of adolescents and adults with newly diagnosed BL in Lilongwe, Malawi, from 2013 to 2018
| Total no. of patients | All | HIV-positive (n = 15) | HIV-negative (n = 20) | P | ||||||||||||||||
|---|---|---|---|---|---|---|---|---|---|---|---|---|---|---|---|---|---|---|---|---|
| No. | % | Median | Range | Mean | SD | No. | % | Median | Range | Mean | SD | No. | % | Median | Range | Mean | SD | |||
| Male sex | 35 | 25 | 71 | 10 | 67 | 15 | 75 | .71 | ||||||||||||
| Age, y | 35 | 21 | 15-61 | 40 | 21-61 | 15 | 15-41 | <.001 | ||||||||||||
| Body mass index, kg/m2 | 30 | 19.1 | 4.5 | 21.8 | 3.1 | 16.2 | 3.9 | <.001 | ||||||||||||
| B symptoms | 35 | 24 | 69 | 10 | 67 | 14 | 70 | 1 | ||||||||||||
| Ann Arbor stage III to IV | 35 | 27 | 77 | 9 | 60 | 18 | 90 | .05 | ||||||||||||
| ECOG PS ≥2 | 35 | 19 | 54 | 5 | 33 | 14 | 70 | .04 | ||||||||||||
| aaIPI | 32 | .28 | ||||||||||||||||||
| 0 | 1 | 3 | 1 | 7 | 0 | 0 | ||||||||||||||
| 1 | 7 | 22 | 5 | 33 | 2 | 12 | ||||||||||||||
| 2 | 12 | 38 | 5 | 33 | 7 | 41 | ||||||||||||||
| 3 | 12 | 38 | 4 | 27 | 8 | 47 | ||||||||||||||
| Central nervous system involvement | 35 | 5 | 14 | 1 | 7 | 4 | 20 | .36 | ||||||||||||
| Bone marrow involvement | 22 | 4 | 18 | 2 | 50 | 2 | 15 | 1.00 | ||||||||||||
| Abdominal disease | 35 | 23 | 66 | 7 | 47 | 16 | 80 | .07 | ||||||||||||
| Bulky disease (>10 cm) | 24 | 16 | 66 | 9 | 60 | 7 | 78 | .66 | ||||||||||||
| HIV diagnosis known prior to Burkitt diagnosis | 15 | ― | 9 | 60 | ― | ― | ||||||||||||||
| Time since HIV diagnosis, years | 9 | ― | 1.4 | 0.4-9.4 | ― | ― | ||||||||||||||
| Receiving ART at BL diagnosis | 15 | ― | 8 | 53 | ― | ― | ||||||||||||||
| Duration of ART at BL diagnosis, years | 8 | ― | 1.1 | 0.4-2.6 | ― | ― | ||||||||||||||
| CD4 count, cells per μL | 15 | ― | 130 | 29-605 | ― | ― | ||||||||||||||
| HIV viral load, log10 copies per μL | 15 | ― | 1.6 | 0-6.0 | ― | ― | ||||||||||||||
| HIV viral load, detectable >400 copies per μL | 15 | ― | 5 | 33 | ― | ― | ||||||||||||||
| White blood cells, ×109/L | 35 | 7.2 | 2.1-20.3 | 4.8 | 2.1-12.0 | 8.3 | 3.6-20.3 | .005 | ||||||||||||
| Hemoglobin, g/dL | 35 | 10.8 | 1.6-14.8 | 11.0 | 7.7-14.8 | 9.8 | 1.6-14.3 | .17 | ||||||||||||
| Platelets, ×109/L | 35 | 365 | 77-859 | 312 | 77-791 | 382 | 139-859 | .44 | ||||||||||||
| Creatinine, mg/dL | 33 | 0.6 | 0.3-28.0 | 0.8 | 0.6-28.0 | 0.5 | 0.3-11.4 | .002 | ||||||||||||
| Bilirubin, mg/dL | 32 | 0.3 | 0.2-2.0 | 0.3 | 0.2-1.4 | 0.4 | 0.2-2.0 | .05 | ||||||||||||
| Albumin, g/dL | 26 | 3.7 | 0.8 | 3.8 | 0.8 | 3.6 | 0.9 | .69 | ||||||||||||
| LDH ratio per ULN | 32 | 2.2 | 0.4-22.3 | 3.0 | 0.7-22.3 | 2.1 | 0.4-20.0 | .35 | ||||||||||||
| LDH >2× ULN | 32 | 22 | 67 | 11 | 73 | 11 | 65 | .71 | ||||||||||||
| EBER positive by in situ hybridization | 19 | 9 | 47 | 2 | 20 | 7 | 78 | .02 | ||||||||||||
| First-line chemotherapy | 31 | 1.00 | ||||||||||||||||||
| CHOP | 22 | 71 | 9 | 75 | 13 | 68 | ||||||||||||||
| More intensive | 9 | 29 | 3 | 25 | 6 | 32 | ||||||||||||||
aaIPI, age-adjusted International Prognostic Index; EBER, Epstein-Barr virus–encoded RNA; SD, standard deviation.
Of HIV-infected patients, 9 (60%) were aware of their HIV diagnosis before being diagnosed with BL. For those previously aware of their HIV diagnosis, the time from diagnosis of HIV to BL was a median of 1.4 years (range, 0.4-9.4 years). Eight patients (53%) were being treated with ART for at least 3 months before BL diagnosis. These participants were receiving ART for a median of 1.1 years (range, 0.4-2.6 years) before they were diagnosed with BL. Median CD4 count was 130 cells per μL (range, 29-605 cells per μL). Ten HIV-infected participants (67%) had suppressed HIV RNA at <200 copies per μL at the time of BL diagnosis.
Compared with HIV-negative patients, HIV-infected patients were older, had higher body mass index, lower stage, and less frequently impaired Eastern Cooperative Oncology Group performance status (ECOG PS) ≥2 (Table 1). HIV-infected patients had lower white blood cell count, higher creatinine, and lower bilirubin compared with HIV-negative patients.
Among tumor biopsy specimens, median Ki67 was >95% (range, 90% to >95%), 21 of 21 were CD10+, 23 of 23 were BCL2–, and 9 (47%) of 19 were EBER ISH positive. Compared with HIV-infected biopsy specimens (2 [20%] of 10), HIV-negative (7 [78%] of 9) biopsy specimens were more likely to test EBER ISH positive (P = .02).
Four participants (11%) died before chemotherapy could be started. First-line chemotherapy consisted of bolus anthracycline-based chemotherapy (CHOP) in 22 (71%), infusional anthracycline-based chemotherapy (EPOCH) in 4 (13%), and high-dose methotrexate-based chemotherapy (COPADM) in 4 (13%). One participant (3%) received rituximab with CHOP as part of an ongoing phase 2 trial (Figure 2).20 There was no significant difference in baseline characteristics between those treated with CHOP and those treated with more intensive chemotherapies, with overall similar aaIPI distribution between the 2 groups (Table 2). Participants received a median of 5 cycles of first-line chemotherapy (range, 1-8 cycles). Nine participants received second-line chemotherapy, which consisted of etoposide, prednisolone, ifosfamide, and cisplatin (EPIC) or ifosfamide, carboplatin, and etoposide (ICE) for 6 patients and COPADM for 3 patients.
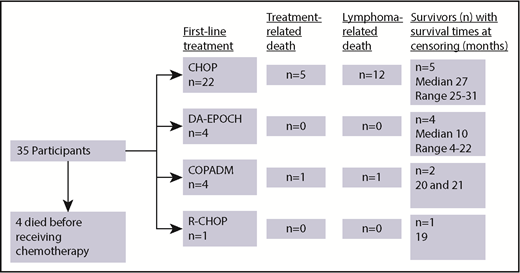
Flowchart of first-line chemotherapy and outcomes among newly diagnosed patients with BL in Lilongwe, Malawi.
Flowchart of first-line chemotherapy and outcomes among newly diagnosed patients with BL in Lilongwe, Malawi.
Baseline characteristics of patients treated for newly diagnosed BL in Lilongwe, Malawi, by initial treatment regimen
| Total no. of patients | CHOP (n = 22) | More intensive regimen (n = 9) | P | |||||||||||
|---|---|---|---|---|---|---|---|---|---|---|---|---|---|---|
| No. | % | Median | Range | Mean | SD | No. | % | Median | Range | Mean | SD | |||
| Male sex | 31 | 15 | 68 | 6 | 67 | 1 | ||||||||
| Age, y | 31 | 20 | 15-57 | 16 | 15-55 | .65 | ||||||||
| Body mass index, kg/m2 | 26 | 18.9 | 4.9 | 17.9 | 1.5 | .65 | ||||||||
| B symptoms | 31 | 13 | 59 | 7 | 78 | .43 | ||||||||
| Ann Arbor stage III to IV | 31 | 18 | 82 | 6 | 67 | .38 | ||||||||
| ECOG PS ≥2 | 31 | 13 | 59 | 3 | 33 | .25 | ||||||||
| aaIPI | 28 | 1 | ||||||||||||
| 1 | 5 | 24 | 2 | 28 | ||||||||||
| 2 | 9 | 43 | 3 | 43 | ||||||||||
| 3 | 7 | 33 | 2 | 28 | ||||||||||
| Central nervous system involvement | 31 | 5 | 23 | 0 | 0 | .27 | ||||||||
| Bone marrow involvement | 21 | 3 | 21 | 1 | 14 | 1 | ||||||||
| Abdominal disease | 31 | 14 | 64 | 6 | 67 | 1 | ||||||||
| Bulky disease (>10 cm) | 20 | 11 | 73 | 4 | 80 | 1 | ||||||||
| HIV positive | 31 | 9 | 41 | 3 | 33 | 1 | ||||||||
| CD4 count, cells per μL | 12 | 130 | 29-605 | 238 | 39-272 | .78 | ||||||||
| HIV viral load, detectable >400 copies per μL | 12 | 4 | 44 | 0 | 0 | .49 | ||||||||
| White blood cells, ×109/L | 31 | 7.2 | 2.8-20.3 | 7.4 | 2.1-11.7 | .91 | ||||||||
| Hemoglobin, g/dL | 31 | 11.0 | 1.6-14.8 | 9.9 | 7.7-11.7 | .13 | ||||||||
| Platelets, ×109/L | 31 | 314 | 139-859 | 438 | 157-635 | .24 | ||||||||
| Creatinine, mg/dL | 29 | 0.6 | 0.3-2.4 | 0.5 | 0.4-1.7 | .41 | ||||||||
| Bilirubin, mg/dL | 28 | 0.4 | 0.2-2.0 | 0.4 | 0.2-1.4 | .72 | ||||||||
| Albumin, g/dL | 22 | 3.7 | 2.7-5.8 | 3.4 | 2.3-4.4 | .38 | ||||||||
| LDH ratio per ULN | 28 | 2.2 | 0.4-20 | 2.2 | 1.0-5.1 | .98 | ||||||||
| LDH >2× ULN | 28 | 14 | 33 | 5 | 71 | 1.0 | ||||||||
Outcomes
Among evaluable participants, 14 (50%) of 28 achieved a complete response, 6 (21%) achieved a partial response, and 8 (28%) were refractory. At the time of censoring, vital status was known for all participants. Median follow-up among those alive was 22 months (range, 4-35 months). Median OS was 6.8 months (95% confidence interval [CI], 5.0-18.8 months); 1-year OS was 40% (95% CI, 24%-56%) (Figure 3). Among those achieving a complete response to first-line chemotherapy, 1-year OS was 70% (95% CI, 38%-87%). Median PFS was 5.1 months (95% CI, 3.1-8.5 months); 1-year PFS was 31% (95% CI, 16%-47%).
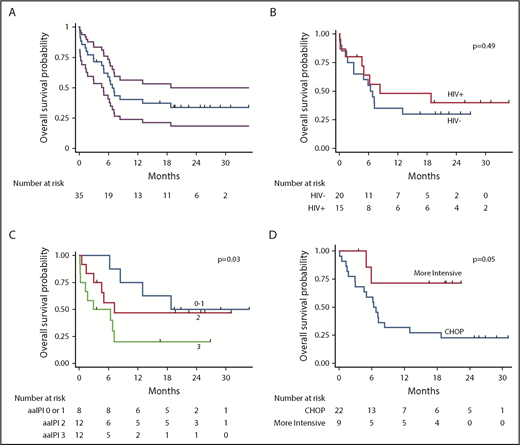
Kaplan-Meier curves for OS. OS curves shown for entire cohort (with 95% CI bands) (A), by HIV status (B), by aaIPI (C), and by treatment (CHOP vs more intensive regimens) (D).
Kaplan-Meier curves for OS. OS curves shown for entire cohort (with 95% CI bands) (A), by HIV status (B), by aaIPI (C), and by treatment (CHOP vs more intensive regimens) (D).
Of the 22 deaths during the study period, six (27%) were classified as treatment-related. Among the six treatment-related deaths, 1 occurred in an HIV-infected participant, 1 occurred in a patient receiving more intensive chemotherapy, and none occurred in participants with baseline renal dysfunction. No relationship between cause of death and PS, stage, LDH, creatinine, or any other variable was found on exploratory analysis.
In unadjusted Cox proportional hazards ratio modeling (Table 3), mortality was associated with worse PS (HR, 1.6 per ECOG PS point; 95% CI, 1.1-2.2; P = .005), higher Ann Arbor stage (HR, 1.9 per stage; 95% CI, 1.1-3.3; P = .02), and higher aaIPI (HR, 1.9 per point; 95% CI, 1.1-3.5; P = .03). Mortality was also associated with creatinine above the upper limit of normal (ULN) (HR, 3.6; 95% CI, 1.2-10.9; P = .02), higher LDH (HR, 1.1 per multiple ULN; 95% CI, 1.0-1.2; P = .04), and lower body mass index (HR, 0.9 per kg/m2; 95% CI, 0.8-1.0 per kg/m2; P = .04). Receipt of more intensive, first-line chemotherapy vs CHOP was associated with lower mortality (HR, 0.2; 95% CI, 0.05-1.0; P = .05). Notably, age and HIV status were not associated with mortality.
Univariable Cox proportional hazards analysis of OS for adolescents and adults with BL in in Lilongwe, Malawi, from 2013 to 2018
| Unadjusted HR | 95% CI | P | |
|---|---|---|---|
| HIV infection | 0.74 | 0.31-1.76 | .49 |
| Male sex | 0.75 | 0.30-1.85 | .53 |
| Age >20 y | 0.69 | 0.30-1.61 | .39 |
| B symptoms | 0.84 | 0.35-2.01 | .70 |
| BMI, kg/m2 | 0.88 | 0.78-0.99 | .04 |
| ECOG PS | |||
| Per unit | 1.57 | 1.14-2.15 | .005 |
| ≥2 | 2.56 | 1.06-6.16 | .04 |
| Ann Arbor stage | |||
| Per unit | 1.93 | 1.12-3.31 | .02 |
| III to IV | 3.59 | 1.05-12.3 | .04 |
| >1 Extranodal site | 2.49 | 0.58-10.6 | .22 |
| CNS involvement | 1.96 | 0.66-5.83 | .23 |
| Bone marrow involvement | 3.86 | 0.97-15.3 | .06 |
| Bulky disease (largest lymph node ≥10 cm) | 1.00 | 0.31-3.23 | .99 |
| LDH | |||
| Per multiple of ULN | 1.08 | 1.00-1.17 | .04 |
| >2× ULN | 0.98 | 0.37-2.59 | .97 |
| aaIPI, per unit | 1.91 | 1.06-3.46 | .03 |
| White blood cells, ×109/L | 1.01 | 0.90-1.12 | .89 |
| Hemoglobin, mg/dL | 0.96 | 0.82-1.11 | .56 |
| Platelets, ×109/L | 1.00 | 0.98-1.02 | .85 |
| Albumin, g/dL | 0.73 | 0.37-1.46 | .38 |
| Creatinine > ULN | 3.57 | 1.17-10.9 | .02 |
| Bilirubin > ULN | 1.75 | 0.50-6.10 | .38 |
| Receiving ART prior to lymphoma diagnosis | 1.26 | 0.31-5.10 | .75 |
| CD4, 100 cells per μL | 0.82 | 0.43-1.56 | .54 |
| HIV detectable >400 copies per μL | 0.98 | 0.23-4.15 | .98 |
| HIV viral load, per log10 copies per μL | 0.99 | 0.71-1.39 | .97 |
| First-line chemotherapy more intensive than CHOP | 0.24 | 0.05-1.02 | .05 |
Adjusted HRs reflect multivariable analysis controlling for the other variables listed.
BMI, body mass index; CNS, central nervous system.
In adjusted Cox proportional hazards modeling controlling for the aaIPI, only creatinine above the ULN was associated with increased mortality (adjusted HR [aHR], 5.6; 95% CI, 1.6-20; P = .01). Notably, HIV (aHR, 1.7; 95% CI, 0.6-5.0; P = .34) and age (aHR, 1.01 per year; 95% CI, 0.98-1.05 per year; P = .47) were not associated with increased mortality. Although we focused on OS as the most stringently defined outcome, results for PFS were similar.
Finally, the number of participants treated with more intensive chemotherapy and duration of follow-up was insufficient to conduct a multivariable model for OS. However, PFS was improved for patients receiving more intensive chemotherapy, even controlling for the aaIPI (aHR, 0.1; 95% CI, 0.01-0.8; P = .03).
Discussion
This study represents, to our knowledge, the first prospective cohort of nonpediatric BL in SSA. We identified 2 somewhat distinct subgroups. The HIV-negative population tended to be younger, sicker, and with almost uniformly EBV-positive tumors, similar to endemic BL. Similar populations have been described in other studies in pediatric populations in SSA.21 The HIV-infected population tended to be older with EBV-negative tumors, which are more consistent with immunodeficiency-associated BL. Immunodeficiency-associated BL has been well described previously in high-income countries.22 Overall, participants presented with very advanced disease and outcomes were poor. For example, 1-year OS was only 40%. Notably, most deaths were a result of BL, not of complications of treatment. Given that most deaths were the result of BL, we implemented more intense chemotherapy regimens that seemed to be safe. Furthermore, these more intense regimens were associated with improved outcomes compared with CHOP.
Little has been published to date on the treatment of BL in adolescents and adults in SSA. Outcomes are likely to differ between SSA and high-income countries, even when the same treatment protocol is used. A number of factors may contribute to different outcomes in SSA, including supportive care infrastructure, patient travel distances, stage at diagnosis, HIV prevalence, and opportunistic infections during myelosuppressive chemotherapy. In high-income countries, BL outcomes have improved with the use of high-dose methotrexate,8,9 infusional chemotherapy regimens,11 and rituximab.10 Three-year OS in recent trials has exceeded 80%. Nevertheless, outcomes remain less favorable for unselected patients outside clinical trials. A large, retrospective study of the US National Cancer Institute SEER database demonstrated a 3-year OS of only 56% in patients treated from 2002 to 2008.23 Indeed, our 1-year OS in Malawi of 40% from 2013 to 2018 for unselected patients, including those not surviving to chemotherapy initiation, is not markedly different from 1-year OS of 40% to 50% reported for nonpediatric BL in SEER before 2002 in the United States. One-year OS was 38% in a retrospective study of adult BL in Cape Town, South Africa,24 and results were similar to those presented here, despite the fact that, compared with Malawi, the infrastructure for treating cancer is more developed in South Africa. Outcomes in our population are poor for a number of reasons: the cytotoxic ceiling imposed by the environment, lack of access to effective salvage treatments, lack of access to radiation therapy, and limitations on supportive care.
Our data suggest that outcomes could be improved with more intensive chemotherapy regimens. As described above, this is in line with data from high-income countries. However, whether more intensive chemotherapy is better in SSA has been less well described. There is a dearth of robust data for nonpediatric BL in SSA on outcomes and cause of death (ie, related to BL vs complications of treatment). Notably, 73% of deaths during the study period in this study were from progressive BL and not from adverse effects of therapy. Given poor outcomes with CHOP from 2013 to 2016, largely as a result of BL progression, institutional practice changed and more intensive chemotherapy protocols were instituted. The data presented here suggest that these changes may be resulting in better outcomes, but a larger sample size with longer follow-up is needed.
In high-income countries, many prognostic indices have been studied in BL, and prognosis depends largely on stage of disease, PS, and response to treatment.25 Likewise, we found that stage and PS were the primary drivers of prognosis in Malawi. Importantly, prognosis did not differ by age or HIV status. Finally, response to therapy was a strong predictor of outcome with 1-year OS of 70% among those with a complete response to first-line chemotherapy. This suggests the possibility of therapeutic adjustment based on early response, as has become common for lymphoma in high-income countries that use interim metabolic imaging. Indeed, our previous work in Malawi has suggested that plasma EBV load might be one readily implementable and valuable tool for assessing interim response in Hodgkin lymphoma and pediatric BL.26,27
Strengths of our study include a prospective, deeply characterized, nonpediatric BL cohort with complete treatment and outcome data. We had no loss to follow-up during the study period. These are strengths of our study compared with many of the previously published studies from the region.28 Weaknesses include small cohort size, enrollment at a single institution, treatment heterogeneity between patients cared for in the pediatric and adult clinics, and nonrandomized treatment with possible confounding for survival comparisons across regimens.
In conclusion, outcomes for nonpediatric BL in SSA remain unacceptably poor. BL is highly curable in high-income countries. As with pediatric BL, better curative strategies for this population are urgently needed. Optimal therapy would ideally be defined through multicenter clinical and translational networks that implement harmonized protocols. As has occurred in high-income countries over recent decades, these studies would have the potential to generate meaningful progress for BL patients in SSA.
All data are publicly available and deidentified and stored in Mendeley Data; see http://dx.doi.org/10.17632/d857z43fjr.1.
The full-text version of this article contains a data supplement.
Acknowledgments
This work was supported by National Institute of Health (NIH) (Fogarty International Institute [K01TW009488] and Fogarty International Institute and Office of the US Global AIDS Coordinator [U2GPS001965]); by the NIH, National Cancer Institute (R21CA180815, U54CA190152, P30CA016086, UM1CA121947 [M.S.P. and K.D.W.], and L30CA233709 [M.S.P.]); by an NIH Research Training Grant (D43TW009340) funded by the NIH Fogarty International Center, National Institute of Neurological Disorders and Stroke, National Institute of Mental Health, National Heart, Lung, and Blood Institute, and National Institute of Environmental Health Sciences; and by an NIH, National Institute of General Medical Sciences Award (T32GM086330) (K.D.W.).
The funding agencies had no role in study design, data collection, data analysis, data interpretation, writing of the report, or the decision to submit it for publication. The content is solely the responsibility of the authors and does not necessarily represent the official views of the NIH. M.S.P., K.D.W., and S.G. had full access to all of the data and final responsibility for the decision to submit for publication.
Authorship
Contribution: M.S.P., K.D.W., and S.G. conceived the study, analyzed and interpreted data, and drafted and revised the manuscript; M.S.P., K.D.W., E.K., T.Z., B.K., P.W., N.K.E.-M., and S.G. acquired clinical data; T.T., M.M., N.D.M., and Y.F. acquired pathologic data; and all authors provided final approval of the manuscript.
Conflict-of-interest disclosure: The authors declare no competing financial interests.
Correspondence: Matthew S. Painschab, Physicians Office Building, 3rd Floor, 170 Manning Dr, CB# 7305, Chapel Hill, NC 27599; e-mail: mpain@email.unc.edu.

