

Key Points
85% to 95% of de novo DLBCL patients express PD-L1, primarily on myeloid cells, and PD-L1 correlated with macrophage and STAT3 expression.
PD-L1 did not identify high-risk patients in de novo DLBCL, and may be associated with better prognosis in some patients.

Abstract
Programmed death-ligand 1 (PD-L1) and its receptor, programmed cell death-1 (PD-1), are important negative regulators of immune cell activation. Therapeutically targeting PD-1/PD-L1 in diffuse large B-cell lymphoma (DLBCL) patients with a single agent has limited activity, meriting a deeper understanding of this complex biology and of available PD-L1 clinical assays. In this study, we leveraged 2 large de novo DLBCL phase 3 trials (GOYA and MAIN) to better understand the biologic and clinical relevance of PD-L1 in de novo DLBCL. PD-L1 was expressed on myeloid cells in 85% to 95% of DLBCL patients (depending on staining procedure), compared with 10% on tumor cells, and correlated with macrophage gene expression. PD-L1 did not identify high-risk patients in de novo DLBCL; it correlated with STAT3, macrophage gene expression, and improved outcomes among a subset of patients. These results may help identify immunologically distinct DLBCL subsets relevant for checkpoint blockade. GOYA and MAIN trials were registered at www.clinicaltrials.gov as #NCT01287741 and #NCT00486759, respectively.
Introduction
Programmed death-ligand 1 (PD-L1) and its receptor, programmed cell death-1 (PD-1), are expressed on multiple cell types, including antigen-presenting cells, T cells, and tumor cells (TCs), and negatively regulate immune cell (IC) activation.1-7 Among de novo diffuse large B-cell lymphoma (DLBCL) patients, high PD-L1 expression and soluble PD-L1 have been correlated with both inferior and superior clinical outcomes, possibly attributable to different patient populations, different PD-L1 reagents, or a more complex PD-L1 biology within this heterogeneous disease.8-12 In de novo DLBCL patients treated with immunochemotherapy, specific PD-L1 expression by malignant B cells is associated with worse outcome.8 However, accurate estimation of tumor-specific PD-L1 staining is challenging, with most studies suggesting that tumor-specific PD-L1 expression is rare, possibly limited to a small percentage of the activated B-cell (ABC) subtype of DLBCL, and may depend on the PD-L1 reagent.8,10,12-14 PD-L1 expression by nonmalignant ICs such as activated monocytes and dendritic cells (DCs) is more common, and this PD-L1 IC staining using SP142 is relevant for anti–PD-L1 clinical responses among lung cancer patients.8,13,15,16
In this study, we leveraged samples from 2 large de novo DLBCL phase 3 trials and gene expression data from purified ICs to better understand the biologic and clinical relevance of PD-L1 expression in de novo DLBCL. We report that PD-L1 was primarily expressed on myeloid cells in DLBCL, that expression of PD-L1 correlated with macrophage gene expression, and that PD-L1 was not a negative prognostic biomarker in DLBCL and in fact may have indicated improved prognosis in some patients. In addition, we show that high expression of a macrophage gene signature was associated with improved survival among de novo DLBCL patients treated with immunochemotherapy and that it added prognostic information to the cell-of-origin subsets, in that high expression of the macrophage signature correlated with prolonged progression-free survival (PFS), particularly among the poor-prognosis ABC subset.
Methods
Clinical samples
Clinical, genomic, and pretreatment immunohistochemistry (IHC) data were available from patients treated in the GOYA (R-CHOP [rituximab plus cyclophosphamide, doxorubicin, vincristine, and prednisone] vs obinutuzumab plus CHOP)17 and MAIN (R-CHOP ± bevacizumab)18 clinical trials (Table 1). The protocols of the original trials were approved by local or national ethics committees according to the laws of each country, and the study was undertaken in accordance with the Declaration of Helsinki. ABC/germinal center B-cell (GCB)/unclassified DLBCL prognostic subtypes were determined by the Nanostring LST assay (GOYA) or by application of the Wright et al19 algorithm to expression data from a custom Fluidigm gene expression panel containing the 27 genes of the DLBCL subgroup predictor (MAIN). Median follow-up durations were 24 and 29 months for MAIN and GOYA, respectively (∼30% of PFS events in both cohorts).
Patient characteristics
| n (%) | P | ||
|---|---|---|---|
| GOYA (n = 552) | MAIN (n = 225) | ||
| Age, y | .061 | ||
| Median | 63 | 62 | |
| Range | 18-86 | 21-79 | |
| Male sex | 288 (52.2) | 107 (47.6) | .268 |
| Region | <.001* | ||
| Western Europe | 216 (39.1) | 91 (40.4) | |
| Eastern Europe | 122 (22.1) | 59 (26.2) | |
| North America | 93 (16.8) | 17 (7.6) | |
| Asia | 89 (16.1) | 13 (5.8) | |
| Other | 32 (5.8) | 45 (18.2) | |
| IPI | .0057† | ||
| Low | 107 (19.4) | 28 (12.5) | |
| Low-intermediate | 194 (35.1) | 102 (45.3) | |
| High-intermediate | 161 (29.2) | 71 (31.6) | |
| High | 90 (16.3) | 24 (10.7) | |
| ECOG PS | <.001 | ||
| 0-1 | 490 (88.8) | 164 (73.9) | |
| 2-3 | 62 (11.2) | 58 (26.1) | |
| Ann Arbor stage | n = 223 | .204 | |
| I and II | 134 (24.3) | 64 (28.7) | |
| III and IV | 418 (75.8) | 159 (71.3) | |
| Extranodal involvement | 364 (65.9) | 100 (44.4) | <.001 |
| COO | .184 | ||
| GCB | 298 (55.4) | 70 (47.9) | |
| ABC | 151 (28.1) | 52 (35.6) | |
| Unclassified | 89 (16.5) | 24 (16.4) | |
| Median follow-up, mo | 29.9 | 24.2 | <.001 |
COO, cell of origin; ECOG PS, Eastern Cooperative Oncology Group performance status.
Regional makeup significantly differed, with more South and Central American samples in MAIN (n = 41) vs GOYA (n = 13).
International Prognostic Index (IPI) groups differed significantly, with more intermediate samples in MAIN.
IHC
IHC assays were performed on pretreatment samples from MAIN (2013) and GOYA (2018) using 2 different PD-L1 IHC reagents (SP142,20 SP263) and 21 uninvolved lymph node sections as controls. Tissue cores with insufficient or poorly preserved tissue were excluded. The SP142 PD-L1 IHC staining protocol was updated to include tyramide signal amplification (TSA) amplification, which was used for PD-L1 staining in GOYA. Tissue microarray slides consisted of 1-mm cores (2-3 per patient) and were scored based on tissue area occupied by PD-L1+ cells (ICs and TCs) using the following algorithm: IHC 0, <1%; IHC 1, 1% to 5%; IHC 2, 5% to 10%; and IHC 3, >10%. TCs and ICs were identified based on morphologic and cytologic features, and PD-L1 tumor expression was scored as a percentage of all TCs. PD-L1 expression by malignant cells required the presence of complete, circumferential membranous staining of malignant cells. Interpretation of immunostains was performed by a board-certified hematopathologist.
Genomics
RNA was isolated and purified from pretreatment formalin-fixed paraffin-embedded biopsies using Qiagen FFPE RNAEasy preparation kits. The purified RNA was used to create complementary DNA libraries that were assayed using TruSeq (Illumina) RNA sequencing (RNAseq) to measure PD-L1, macrophage, and B-cell gene expression among 702 DLBCL patients (GOYA, n = 552; MAIN, n = 150). Additionally, published gene expression data from 28 DLBCL cell lines21 and purified, normal ICs22 were used to assess PD-L1 expression in tumor cells and macrophages, respectively. To quantify the expression of IC subsets, we used immune signatures designed to reflect relevant immune biology (supplemental Table 1) and calculated signature scores by first z score, normalizing expression values of each gene across patients and then calculating an average z score across signature genes for each patient as previously described.23 High/low expression of each gene signature was determined by median cutoffs. Chromosome 9p24.1 amplification was determined among 443 GOYA samples using the FoundationOne Heme platform (Foundation Medicine Incorporated, Cambridge, MA) as previously described.24 Next-generation sequencing data are publically available at accession #GSE125966.
Statistical analysis
Computational analysis of RNAseq data was performed in R (version 3.2.2; R Project for Statistical Computing). We used Cox regression to examine associations between these markers and PFS, adjusting for treatment arm, number of planned chemotherapy cycles, International Prognostic Index, and region (GOYA) or treatment arm (ie, bevacizumab) and International Prognostic Index (MAIN).
Results
PD-L1 features in DLBCL
Characteristics of the patients with available tumor tissue from both trials are listed in Table 1. Among 433 DLBCL patients (GOYA, n = 232; MAIN, n = 201) with available PD-L1 IHC results, 95% (by SP263) and 85% (by SP142) of patients expressed the PD-L1 protein on cells morphologically most consistent with macrophage/histiocyte origin, whereas a minority (MAIN, n = 20; 10%; GOYA, n = 14; 5.6%) showed any PD-L1 staining on tumor cells; in benign lymph node tissues, we saw the typical staining pattern for PD-L1 with positive staining on sinusoidal macrophages and scattered intra- and interfollicular cells of macrophage or DC morphology (Figure 1A-B).
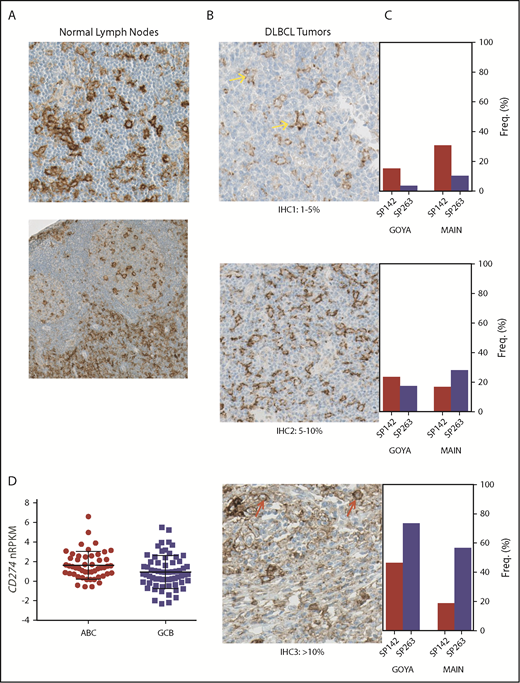
Similar to normal lymph nodes, PD-L1 is expressed by myeloid ICs in DLBCL, with different prevalence and intensity depending on the staining procedure. (A) Membranous immunohistochemical stain for PD-L1 protein (with hematoxylin counterstain) on cells with myeloid/dendritic morphology in normal lymph nodes (original magnification ×400). (B) Representative images of PD-L1 protein staining (SP263; original magnification ×400) among DLBCL patients treated in MAIN using a simplified IHC scoring system capturing PD-L1+ ICs or TCs (IHC 1, 1%-5%; IHC 2, 5%-10%; IHC 3, >10%). Yellow arrows represent PD-L1 staining on myeloid cells, and red arrows represent PD-L1 staining on malignant B cells. (C) PD-L1 prevalence and staining intensity among de novo DLBCL patients treated in 2 phase 3 clinical trials (MAIN, GOYA) using 2 different PD-L1 IHC reagents (SP142, SP263). (D) PD-L1 messenger RNA (mRNA) is higher in the ABC DLBCL subset (P = .004; MAIN). Freq, frequency; nRPKM, normalized reads per kilobase million.
Similar to normal lymph nodes, PD-L1 is expressed by myeloid ICs in DLBCL, with different prevalence and intensity depending on the staining procedure. (A) Membranous immunohistochemical stain for PD-L1 protein (with hematoxylin counterstain) on cells with myeloid/dendritic morphology in normal lymph nodes (original magnification ×400). (B) Representative images of PD-L1 protein staining (SP263; original magnification ×400) among DLBCL patients treated in MAIN using a simplified IHC scoring system capturing PD-L1+ ICs or TCs (IHC 1, 1%-5%; IHC 2, 5%-10%; IHC 3, >10%). Yellow arrows represent PD-L1 staining on myeloid cells, and red arrows represent PD-L1 staining on malignant B cells. (C) PD-L1 prevalence and staining intensity among de novo DLBCL patients treated in 2 phase 3 clinical trials (MAIN, GOYA) using 2 different PD-L1 IHC reagents (SP142, SP263). (D) PD-L1 messenger RNA (mRNA) is higher in the ABC DLBCL subset (P = .004; MAIN). Freq, frequency; nRPKM, normalized reads per kilobase million.
Prevalence and staining intensity of PD-L1 differed according to the antibody and protocol used (Figure 1C). SP263 showed the highest overall staining, with 88% to 91% of patients classified as IHC 2+ (>5% positive). The staining profile for SP142 was comparable in GOYA, where TSA amplification was performed, with 70% classified as IHC 2+. However, in MAIN, the SP142 antibody identified significantly fewer positive cells (35% classified as IHC 2+), suggesting that either SP263 staining or SP142 staining with TSA amplification is recommended for capturing the extent of PD-L1 expression in DLBCL.
At the RNA level, among 702 patients with evaluable RNAseq data, CD274 (PD-L1) mRNA showed generally consistent correlation with PD-L1 staining by IHC, with slightly higher overall correlations observed for SP263 staining (MAIN, r = 0.43; GOYA, r = 0.53), compared with SP142 (MAIN, r = 0.41; GOYA, r = 0.43). CD274 mRNA was also significantly higher among GOYA patients with a chromosome 9p24.1 amplification (n = 18), as determined by FoundationOne Heme (P = 5.03e−10; supplemental Figure 1), reflecting the confounding of tumor and nontumor sources of PD-L1 when assessing total mRNA levels. CD274 mRNA was higher among patients with the ABC subtype of DLBCL in both the MAIN (P = .01; Figure 1D) and GOYA (P = .004) cohorts.
PD-L1 expression is associated with macrophage and STAT3 gene expression
CD274 mRNA inversely correlated with a B-cell gene signature (MAIN, r = −0.55; Figure 2A; GOYA, r = −0.32; supplemental Figure 2), with low/undetectable transcripts in a majority of DLBCL cell lines (n = 28) and resting B-cell samples tested (Figure 2B), consistent with prior reports.8,13,14,22,25 In contrast, there was significantly higher CD274 mRNA expression in macrophages and DCs (Figure 2B).
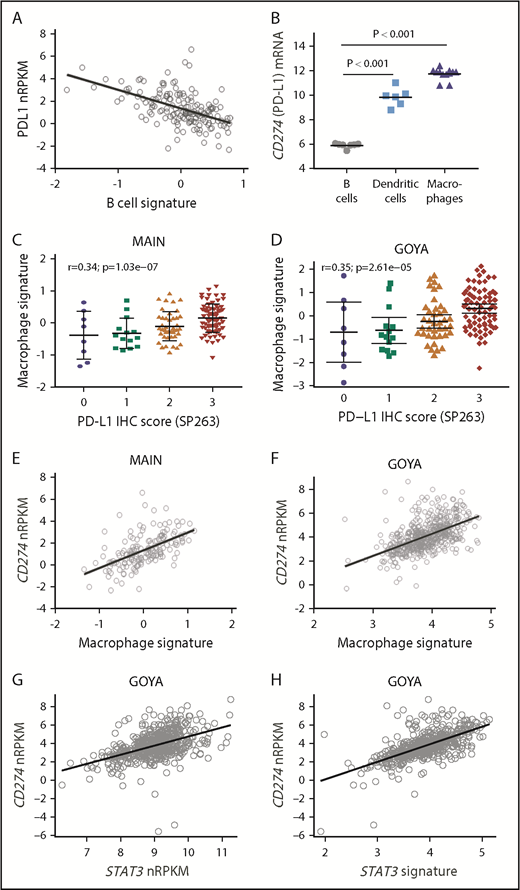
PD-L1 expression correlates with macrophage and STAT3 gene expression. (A) CD274 (PD-L1) mRNA expression inversely correlates with a B-cell gene signature among DLBCL patients treated in MAIN. (B) CD274 mRNA is highly expressed by purified DCs and macrophages compared with resting B cells. PD-L1 protein expression correlates with a macrophage gene signature among DLBCL patients treated in MAIN (C) and GOYA (D). CD274 mRNA correlates with a macrophage gene signature among DLBCL patients treated in MAIN (E) and GOYA (F). CD274 mRNA correlates with STAT3 gene expression (G) and a STAT3 gene signature (H) among DLBCL patients treated in GOYA.
PD-L1 expression correlates with macrophage and STAT3 gene expression. (A) CD274 (PD-L1) mRNA expression inversely correlates with a B-cell gene signature among DLBCL patients treated in MAIN. (B) CD274 mRNA is highly expressed by purified DCs and macrophages compared with resting B cells. PD-L1 protein expression correlates with a macrophage gene signature among DLBCL patients treated in MAIN (C) and GOYA (D). CD274 mRNA correlates with a macrophage gene signature among DLBCL patients treated in MAIN (E) and GOYA (F). CD274 mRNA correlates with STAT3 gene expression (G) and a STAT3 gene signature (H) among DLBCL patients treated in GOYA.
To test the hypothesis that high PD-L1 is primarily expressed on tumor-infiltrating macrophages, we used tumor RNAseq data and previously described techniques to estimate tumor IC infiltrates and correlate PD-L1 expression with a previously described macrophage gene expression signature23,26 (supplemental Table 1). In both cohorts, macrophage gene expression correlated with PD-L1 protein expression (SP263: MAIN, r = 0.36; GOYA, r = 0.35; Figure 2C-D) and with CD274 mRNA expression (MAIN, r = 0.61; GOYA, r = 0.57; Figure 2E-F). Other signatures of a generally activated tumor microenvironment did not correlate with PD-L1 (r = 0.16 for activated fibroblast gene signature; r = 0.28 for activated lymphoid stroma gene signature; r = 0.22 for activated mesenchymal stroma signature), suggesting that other activated immune subsets do not represent the primary source of PD-L1 expression.
To explore mechanistic signaling pathways tied to PD-L1, we analyzed the association of CD274 mRNA with pathways implicated in controlling PD-L1 expression. STAT3 (r = 0.48) and a STAT3 gene signature27 (r = 0.63) correlated with CD274 gene expression (Figure 2G-H), with a strong correlation between the STAT3 gene signature and macrophage gene expression (r = 0.85).
PD-L1, macrophage, and STAT3 correlate with clinical outcomes
Among patients treated in MAIN, high PD-L1 protein expression (SP263; IHC 2+, 3+) correlated with prolonged PFS (hazard ratio [HR], 0.44; 95% confidence interval [CI], 0.24-0.80; P < .01; Figure 3A) and OS (HR, 0.33; 95% CI, 0.17-0.65; P = .0013; supplemental Figure 6A), which was not statistically significant when using the PD-L1 SP142 reagent without TSA amplification (PFS HR, 0.76; 95% CI, 0.43-1.4; P = .36; OS HR, 0.49; 95% CI, 0.23-1.00; P = .064) or when assessing CD274 mRNA expression (PFS HR, 0.84; 95% CI, 0.44-1.6; P = .58; OS HR, 0.77; 95% CI, 0.34-1.70; P = .53; Figure 3A-B; supplemental Figure 6A). The 21 patients treated in MAIN with PD-L1 expression on TCs did not experience significantly different outcomes (data not shown). Among 552 DLBCL patients treated in GOYA, 91% scored high for PD-L1 by SP263 (2+, 3+), with outcomes indistinguishable from those of the 22 patients with PD-L1 low staining. The association between high PD-L1 (using SP142; IHC 3+) and prolonged PFS/OS among patients in GOYA did not reach statistical significance (PFS HR, 0.63; 95% CI, 0.37-1.1; P = .08; OS HR, 1.4; 95% CI, 0.74-2.5; P = .32; Figure 3B; supplemental Figure 6B) and was not seen with SP263 (IHC 3+; PFS HR, 0.92; 95% CI, 0.51-1.7; P = .78; OS HR, 1.1; 95% CI, 0.55-2.2; P = .77; Figure 3B; supplemental Figure 6B). A significantly higher positron emission tomography complete response rate was observed among patients with high CD274 mRNA (P = .02), particularly among patients with ABC DLBCL (P = .0001), and was associated with significantly prolonged OS (HR, 0.6; 95% CI, 0.40-0.90; P = .014; supplemental Figure 6B) but not PFS (HR, 0.74; 95% CI, 0.53-1.0; P = .066; Figure 3B). In GOYA, the effect of PD-L1 (SP142) on PFS was slightly stronger among the GCB DLBCL subset (GCB HR, 0.31; 95% CI, 0.11-0.91; P = .03; ABC HR, 0.47; 95% CI, 0.18-1.2; P = .12), with no effect among unclassified DLBCL patients (HR, 3.3; 95% CI, 0.67-17; P = .14; Figure 3B).
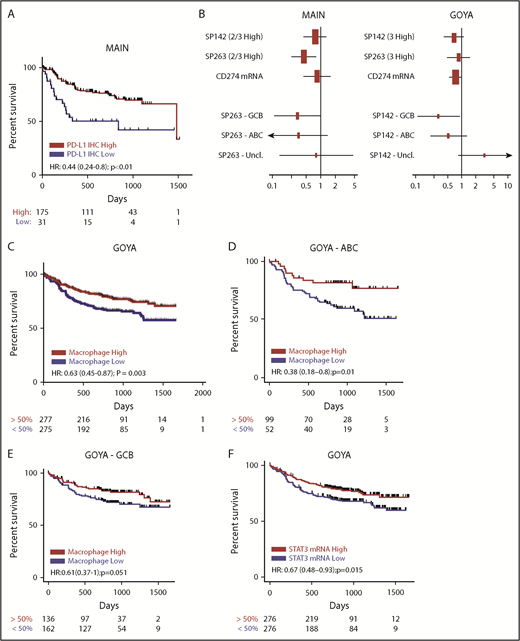
PD-L1 is not a negative prognostic biomarker in de novo DLBCL and may be associated with better prognosis in some patients, similar to macrophages and STAT3. (A) High PD-L1 protein expression (IHC 2+, 3+) by SP263 is associated with prolonged PFS in de novo DLBCL (MAIN). (B) Forest plot of HRs and 95% CIs for the association of PD-L1 expression and PFS with regard to different PD-L1 IHC reagents (SP142, SP263), the PD-L1 transcript (CD274 mRNA), and distinct DLBCL COO subgroups in MAIN and GOYA. High expression of a macrophage gene signature correlates with prolonged PFS (C) and adds prognostic information to DLBCL COO (D-E). (F) High expression of STAT3 mRNA correlates with prolonged PFS in de novo DLBCL (GOYA). Hazard ratios adjusted for IPI and treatment (MAIN) or IPI, treatment, region, and number of chemotherapy cycles (GOYA). Uncl, unclassified.
PD-L1 is not a negative prognostic biomarker in de novo DLBCL and may be associated with better prognosis in some patients, similar to macrophages and STAT3. (A) High PD-L1 protein expression (IHC 2+, 3+) by SP263 is associated with prolonged PFS in de novo DLBCL (MAIN). (B) Forest plot of HRs and 95% CIs for the association of PD-L1 expression and PFS with regard to different PD-L1 IHC reagents (SP142, SP263), the PD-L1 transcript (CD274 mRNA), and distinct DLBCL COO subgroups in MAIN and GOYA. High expression of a macrophage gene signature correlates with prolonged PFS (C) and adds prognostic information to DLBCL COO (D-E). (F) High expression of STAT3 mRNA correlates with prolonged PFS in de novo DLBCL (GOYA). Hazard ratios adjusted for IPI and treatment (MAIN) or IPI, treatment, region, and number of chemotherapy cycles (GOYA). Uncl, unclassified.
Consistent with the hypothesis that PD-L1 expression may reflect an abundance of activated tumor-infiltrating macrophages relevant to anti-CD20 response, high expression of the macrophage signature correlated with prolonged PFS (HR, 0.63; 95% CI, 0.45-0.87; P = .003; Figure 3C) and OS (HR, 0.54; 95% CI, 0.37-0.78; P < .01; supplemental Figure 6B) in GOYA, particularly among the ABC subset (PFS HR, 0.38; 95% CI, 0.18-0.8; P = .01) and to a lesser extent among the GCB subset (HR, 0.61; 95% CI, 0.37-1; P = .051; Figure 3D-E). A similar, but not statistically significant, finding was observed in MAIN by PFS (HR, 0.76; 95% CI, 0.4-1.4; P = .39; supplemental Figure 3) and OS (HR, 0.79; 95% CI, 0.35-1.80; P = .57; supplemental Figure 6A), possibly attributable to fewer evaluable patients in MAIN compared with GOYA and inconsistent results among patients treated in the bevacizumab arm (PFS HR, 1.5; 95% CI, 0.63-3.5; P = .37; supplemental Figure 5). The macrophage effect was consistent among the ABC (HR, 0.6; 95% CI, 0.22-1.6; P = .32) and GCB (HR, 0.79; 95% CI, 0.26-2.3; P = .66) DLBCL subsets in MAIN (supplemental Figure 4). Moreover, high STAT3 mRNA similarly correlated with prolonged PFS (HR, 0.67; 95% CI, 0.48-0.93; P = .015; Figure 3F) among patients treated in GOYA, suggesting that high STAT3 signaling among tumor-associated macrophages may contribute to PD-L1 expression in DLBCL.
The macrophage effect was consistent among the ABC (HR, 0.6; 95% CI, 0.22-1.6; P = .32) and GCB (HR, 0.79; 95% CI, 0.26-2.3; P = .66) DLBCL subsets in MAIN (supplemental Figure 4). Moreover, high STAT3 mRNA similarly correlated with prolonged PFS (HR, 0.67; 95% CI, 0.48-0.93; P = .015; Figure 3F) among patients treated in GOYA, suggesting that high STAT3 signaling among tumor-associated macrophages may contribute to PD-L1 expression in DLBCL.
To attempt separation of macrophage subsets, we tested gene signatures designed to estimate the frequency of the M0, M1, and M2 macrophage phenotypes28 (supplemental Table 1). The M1 and M2 signatures were highly correlated with each other (r = 0.92) and with the undifferentiated M0 signature (r > 0.8), making it difficult to assess the independent contribution of each signature. Only the gene signature designed to estimate the undifferentiated M0 macrophage subset was associated with statistically significant prolonged PFS (HR, 0.65; 95% CI, 0.47-0.91; P = .012); neither the M1 nor M2 signature was significantly associated with PFS (M1: HR, 0.8; 95% CI, 0.58-1.1; P = .17; M2: HR, 0.84; 95% CI, 0.61-1.2; P = .3).
Discussion
In this current study, we tested the hypothesis that PD-L1 expression reflects abundance of activated tumor-infiltrating macrophages and may not be associated with worse outcomes, in contrast to solid tumors, among de novo DLBCL patients treated with chemoimmunotherapy. Despite very low levels of PD-L1 in normal B cells, reports of PD-L1 expression in B-cell malignancies are conflicting, with different B-cell tumors expressing PD-L1 at varying levels and on different cell populations within the tumor microenvironment. Careful consideration of both TC and IC PD-L1 expression may be important for predicting responses to PD-1/PD-L1 checkpoint blockade, as seen in solid tumors.29 In classical Hodgkin lymphoma (cHL), PD-L1 is detected on malignant Reed-Sternberg cells in a large majority of patients (70% to 80%) because of alterations in 9p24.1, which harbors the PD-L1 locus. Reed-Sternberg cells, however, comprise only a small proportion of the total tumor bulk (ie, 5% to 10%) in cHL, and a majority of PD-L1–expressing cells in cHL are macrophages.30 In other B-cell malignancies like follicular lymphoma, marginal zone lymphoma, mantle cell lymphoma, and Burkitt lymphoma, PD-L1 is rarely found on neoplastic B cells (10%, 5%, 0%, and 0%, respectively),13,31-33 with low levels of PD-L1 expression detectable on intratumoral histiocytes and regulatory T cells. Our data confirm that in DLBCL, PD-L1 expression by malignant B cells is low, with expression primarily restricted to tumor-infiltrating myeloid cells.
We observed surprising biases in PD-L1 staining depending on the IHC assay and protocol used. Overall, SP263 showed the highest staining intensity in both DLBCL cohorts and was the most correlated with CD274 mRNA expression. The SP142 antibody stained significantly fewer PD-L1+ cells in MAIN, but with TSA amplification in GOYA, it was roughly comparable to SP263. These results may help explain some of the conflicting results regarding the prognostic effect of PD-L1 in DLBCL,8,34 which may be important for interpreting clinical data for PD-1/PD-L1 checkpoint blockade in this indication. Moreover, these results highlight the importance of standardizing PD-L1 assay reagents and staining procedures in DLBCL, if PD-L1 becomes a relevant biomarker for anti–PD-1/PD-L1 therapies.
Despite the well-established negative prognostic effect of PD-L1 expression in solid tumors, our data demonstrate that among de novo DLBCL patients treated with chemoimmunotherapy, PD-L1 expression on non-TCs is not a negative prognostic biomarker and in fact may be associated with better prognosis. In this setting, the biologic and prognostic effects of PD-L1 may be due to its role as a proxy for macrophage infiltration and may be particularly dependent upon anti-CD20 monoclonal antibody (mAb) therapy. The PD-L1 correlation with improved outcomes in MAIN using SP263 was seen to a lesser extent in patients treated in GOYA, but it was only statistically significant among GCB DLBCL patients using the SP142 PD-L1 reagent with TSA amplification. These data from 2 large phase 3 studies suggest that PD-L1 is not a reliable prognostic biomarker in de novo DLBCL, and differences in IHC reagents or patient subsets may affect the clinical significance of PD-L1 expression.
Macrophages are important mediators of antibody-dependent phagocytosis (ADCP), and preclinical studies have demonstrated that macrophages are required for responses to anti-CD20 (rituximab/obinutuzumab) therapy.35,36 In the absence of anti-CD20 mAb, tumor-associated macrophages may provide a nurturing microenvironment for malignant B cells.37,38 The treatment dependency of this bidirectional influence of tumor-associated macrophages is supported by other studies of the prognostic impact of myeloid cells on B-cell malignancies.39 Markers of macrophage infiltration are associated with worse outcomes in both DLBCL and Hodgkin lymphoma patients treated with chemotherapy in the absence of anti-CD20 mAb immunotherapy and with better outcomes when rituximab is added to chemotherapy in de novo DLBCL.39,40 Our data suggest that PD-L1 correlates with markers of tumor-infiltrating macrophages in DLBCL, possibly reflecting an activated macrophage subset primed for ADCP and contributing to better outcomes among patients treated with modern immunochemotherapy. Interestingly, high expression of the macrophage gene signature added prognostic information to tumor cell of origin and was validated in ABC DLBCL in our MAIN cohort, suggesting a novel tumor-microenvironment interaction and the potential importance of ADCP in the ABC subset.
Macrophages exist in different functional states, the most common of which are the M0 (resting), M1 (classically activated), and M2 (alternatively activated) macrophages. The M2 macrophage phenotype has been linked with highly active phagocytosis of anti-CD20–bound TCs41 ; however, it has been reported that a high concentration of tumor-associated M2 macrophages results in worse DFS in R-CHOP–treated de novo DLBCL patients.42 We attempted to determine the functional state of the tumor-infiltrating macrophages by using gene signatures that reflect the M0, M1, or M2 phenotype and compared these signatures with our general macrophage signature. All macrophage signatures were highly correlated, making it a challenge to demonstrate that any one subset is more prevalent than the other. Despite the strong correlations, only the M0 macrophage signature demonstrated the same prognostic effect as the general macrophage signature used in this study. Future work will need to explore the function of the different macrophage subsets separately to determine how they contribute to response to anti-CD20 therapy.
Previously published results using multiplex immunofluorescence43 and unpublished studies have shown that PD-L1 expression can be seen in CD68+ macrophages and CD11c+ DCs; this has been observed in benign lymphoid tissues as well as diverse tumor indications. A limitation of our current study is that the determination of PD-L1+ cells (ie, TCs vs non-TCs) was made based on morphologic/cytologic features (nuclear pleomorphism, prominent nucleoli, high nuclear/cytoplasmic ratio). The limited tissue available from these studies prevented us from performing the ideal dual stains with lineage-specific markers to more specifically define the cells expressing PD-L1. The morphologic features of the PD-L1+ cells together with the documented high prevalence of macrophages within DLBCL tissues44 suggest that many PD-L1+ cells belong to the macrophage lineage, although there are likely other cell populations that stain for PD-L1. Among tumor biopsies from 3 evaluable DLBCL patients from a separate cohort, we performed quantitative CD68 and PD-L1 colocalization IHC experiments. In all 3 cases, we saw clear PD-L1 and CD68 colocalization, with 1.2% to 18.9% of the tumor area occupied by CD68+ cells, and 30% to 52% of the CD68+ cells costained with PD-L1. Future work is planned to more robustly calculate the total number of PD-L1 and CD68 coexpressing cells in a separate cohort and to determine if high coexpression of these 2 markers is similarly associated with outcome.
To further explore mechanistic insights, we performed additional analyses of gene signatures with PD-L1 IHC results, focusing on macrophage subsets and signaling pathways controlling PD-L1 expression. Cytokines such as interferon γ and tumor necrosis factor α, as well as cytokine signaling pathways such as NF-κB and Stat3, have been shown to regulate PD-L1 expression.45 Certain lymphomas have also been shown to produce soluble factors like interleukin-10, which may polarize the tumor microenvironment and potentially induce PD-L1 expression on tumor-resident macrophages. In our DLBCL cohorts, high STAT3 expression correlated with PD-L1 and macrophage gene expression and prolonged PFS among patients treated in GOYA, suggesting a functional relationship between STAT3 signaling, macrophages, and PD-L1 expression in de novo DLBCL.
The role of PD-L1–expressing myeloid cells in mediating a clinical benefit of anti–PD-1/PD-L1 and anti-CD20 immunotherapies merits additional research. Recent mechanistic studies in mice suggest that DC PD-L1 expression may play an important role in mediating anti–PD-L1 benefit.46 DC ablation before anti–PD-L1 treatment in tumor-bearing mice compromises anti–PD-L1 efficacy, because anti–PD-L1 treatment induces DC maturation, leading to T-cell proliferation.46 Similarly, in tumors containing PD-1–expressing macrophages, treatment with anti–PD-L1 led to increased phagocytosis and tumor clearance.47 Future studies should explicitly examine the effect of PD-L1–expressing myeloid cell subsets on clinical outcomes and phagocytic potential, with implications for anti-CD20, anti–PD-1/PD-L1, and other myeloid targeting therapies like anti-CSF1R.
The full-text version of this article contains a data supplement.
Acknowledgments
The authors acknowledge Guiyuan Lei for statistical support, Kirsten Mundt for MAIN sample collection, and Nancy Valente, Michael Wenger, Ira Mellman, Kartik Krishnan, Ron Mazumder, Wayne Chu, Priti Hegde, and Lukas Amler for thoughtful comments and review.
This work was supported with funding provided by F. Hoffmann-La Roche, Ltd.
Authorship
Contribution: J.M.V., R.M., and C.R.B. conceived the project, designed and performed the data analysis and interpretation, and prepared the manuscript; H.K. and E.E.K. designed and performed immunohistochemistry experiments and assembled the data; M.Z.O., T.N., and L.H.S. assisted in data collection and interpretation; and all authors approved the final manuscript.
Conflict-of-interest disclosure: C.R.B., R.M., H.K., E.E.K., and J.M.V. are employed by Genentech and are shareholders in F. Hoffman-La Roche. M.Z.O. and T.N. are employed by, and are shareholders in, F. Hoffman-La Roche. L.H.S. declares no competing financial interests.
Correspondence: Jeffrey M. Venstrom, Genentech, Inc., 1 DNA Way, South San Francisco, CA 94080; e-mail: venstroj@gene.com.

