

Key Points
Unsupervised machine learning analysis of continuous body temperature data revealed early signals of aGVHD in allo-HCT mice.
Continuous measurement of body temperature is promising for early prediction of aGVHD in human allo-HCT patients.
Introduction
Acute graft-versus-host disease (aGVHD) is a complication of allogeneic hematopoietic cell transplantation (allo-HCT) and the most common cause of hematopoietic cell transplantation (HCT)–related mortality. Although biomarkers have been developed, clinical prediction of aGVHD onset in individual patients remains imprecise. Thus, there is a need for new quantitative approaches for aGVHD prediction to enable early intervention and reduce mortality from this disease. The pathophysiology of aGVHD is rooted in immune cell activation, which results in T-cell–mediated cytotoxic damage and release of a variety of cytokines,1 including pyrogenic cytokines known to influence hypothalamic thermoregulation (eg, tumor necrosis factor,2 interleukin-1,3 and interleukin-64 ). We hypothesized that such effects reflective of early evolving events underlying aGVHD could be discerned from continuously monitored body temperature. This would have the advantage of being a simple, low-cost, and highly practical approach that could potentially be translated to the clinic via wearable sensor technology.5,6 We conducted a proof-of-concept study using wireless implantable temperature sensors in a mouse model of graft-versus-host disease (GVHD), to determine whether mice that develop aGVHD (ie, allo-HCT mice) and those that do not (ie, syngeneic HCT [syn-HCT] mice) differ in posttransplant body temperature profiles and, if so, how early the difference can be detected.
Methods
Mouse strains and husbandry
BALB/c (H-2d) and female C57BL/6J (H-2b) mice were purchased from Charles River Laboratories (Wilmington, MA). Animal care followed protocols reviewed and approved by the Institutional Animal Care and Use Committee of the University of Michigan, based on the University Laboratory Animal Medicine guidelines. Mice were kept at a constant temperature (∼22°C) with a fixed light/dark cycle.
Mouse telemetry
TA-F10 implantable sensors (Data Sciences International, New Brighton, MN) were surgically implanted intraperitoneally. The accuracy of the sensors in the setting of irradiation was validated ex vivo in a water bath (supplemental Figure 1).
Bone marrow and T-cell transplantation
Recipient BALB/c mice received 8 Gy (137Cs source) in split doses on day −1 (day before transplant). On day 0, 5 million T-cell–depleted bone marrow cells, along with 1 or 3 million splenic T cells that were isolated using CD90.2 MicroBeads (Miltenyi Biotec, Bergisch Gladbach, Germany) from BALB/c or C57BL/6J mice, were injected via the tail vein.
Data preprocessing
Data were filtered, analyzed, and visualized in R (version x86_64-apple-darwin15.6.0). The 3 data filtering criteria are described in supplemental Methods and supplemental Figure 2.
Data analysis
Details are described in supplemental Methods.
Results and discussion
We implanted wireless core body temperature sensors intraperitoneally in 28 mice: 17 receiving allo-HCT, 10 receiving syn-HCT, and 1 serving as a naive (no-HCT) control. Two doses of splenic T cells were used to induce aGVHD of lesser and greater severities: LowT (1 × 10⁶ cells; n = 7 allo-HCT mice [AlloLowT] and n = 5 syn-HCT mice [SynLowT]) and HighT (3 × 10⁶ cells; n = 10 allo-HCT mice [AlloHighT] and n = 5 syn-HCT mice [SynHighT]) (Figure 1A). As expected, aGVHD developed in all allo-HCT mice (supplemental Figure 2).
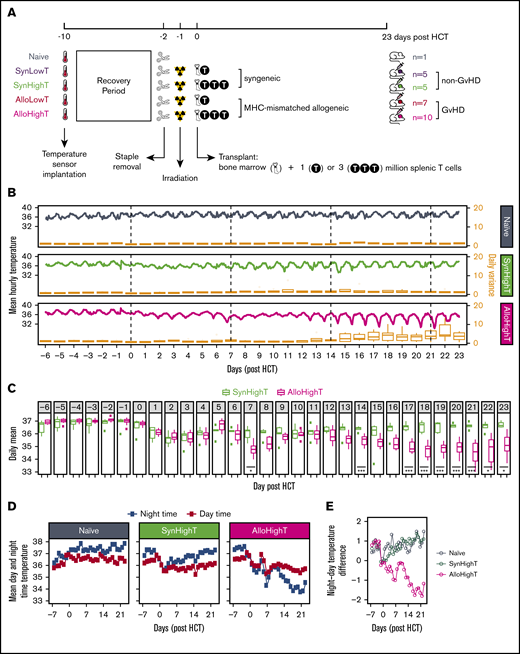
Overview of the experimental design and descriptive statistics of the results for naive, SynHighT, and AlloHighT mice. (A) A total of 28 mice was studied, including 1 naive mouse, 10 mice that received syngeneic HCT with 1 million (SynLowT) or 3 million (SynHighT) T cells, and 17 mice that received allogeneic HCT with 1 million (AlloLowT) or 3 million (AlloHighT) T cells. Body core temperature was sampled every 24 seconds from 10 days before HCT (day of surgical implantation of the temperature sensors) until 23 days after HCT. All transplant mice received irradiation on day −1 and HCT on day 0. (B) Mean hourly temperatures (left y-axes) and boxplots of daily variations in all individuals in each of the 3 groups (right y-axes). Outliers in the boxplots are not shown. (C) Boxplots of mean daily temperature of each individual in the SynHighT and AlloHighT groups. Outliers are shown as small filled squares. P values were calculated for days 0 to 23 using 2-sided Student t tests and adjusted for multiple testing using the Benjamini-Yekutieli method7 ). (D) Mean daily nighttime temperature and mean daily daytime temperature of all individuals in the naive, SynHighT, and AlloHighT groups. (E) Daily difference in mean daily nighttime temperature and mean daily daytime temperature of all individuals in the naive, SynHighT, and AlloHighT groups. *P < .05, ***P < .005.
Overview of the experimental design and descriptive statistics of the results for naive, SynHighT, and AlloHighT mice. (A) A total of 28 mice was studied, including 1 naive mouse, 10 mice that received syngeneic HCT with 1 million (SynLowT) or 3 million (SynHighT) T cells, and 17 mice that received allogeneic HCT with 1 million (AlloLowT) or 3 million (AlloHighT) T cells. Body core temperature was sampled every 24 seconds from 10 days before HCT (day of surgical implantation of the temperature sensors) until 23 days after HCT. All transplant mice received irradiation on day −1 and HCT on day 0. (B) Mean hourly temperatures (left y-axes) and boxplots of daily variations in all individuals in each of the 3 groups (right y-axes). Outliers in the boxplots are not shown. (C) Boxplots of mean daily temperature of each individual in the SynHighT and AlloHighT groups. Outliers are shown as small filled squares. P values were calculated for days 0 to 23 using 2-sided Student t tests and adjusted for multiple testing using the Benjamini-Yekutieli method7 ). (D) Mean daily nighttime temperature and mean daily daytime temperature of all individuals in the naive, SynHighT, and AlloHighT groups. (E) Daily difference in mean daily nighttime temperature and mean daily daytime temperature of all individuals in the naive, SynHighT, and AlloHighT groups. *P < .05, ***P < .005.
In comparison with the naive control mouse, which showed stable average temperature with normal circadian variation (Figure 1B; supplemental Table 1), all transplanted mice showed decreases in core temperature for ∼1 week posttransplant (HighT groups, Figure 1C-D; LowT groups, supplemental Figure 4B-C), which may be a consequence of the irradiation8 used for conditioning pretransplant. Starting at day 14, syn-HCT and allo-HCT temperature curves diverged, with allo-HCT mice experiencing daily drops in core temperature (Figure 1B-C; supplemental Figure 4A-B). Consistent with this, the daily temperature variations among allo-HCT mice were greater than were those among syn-HCT mice between day 15 and day 23 (Figure 1B; supplemental Figure 4A; supplemental Table 2). We also noted that allo-HCT mice showed lower temperature at days 7 and 8 compared with syn-HCT mice, but only in the HighT group (Figure 1C; supplemental Figure 4B).
To further investigate the difference in temperature variations between syn-HCT and allo-HCT animals, we analyzed daytime and nighttime temperatures separately. As expected of nocturnal animals, the naive and syn-HCT mice showed higher temperatures at night, with the exception of the first few days following irradiation and transplant in syn-HCT mice (Figure 1D-E; supplemental Figure 4C-D). In contrast, the allo-HCT mice experienced a shift to a pattern of lower body temperature at night posttransplant (Figure 1D-E; supplemental Figure 4C-D), with notable drops occurring in the hours preceding daylight (ie, 3-6 am; supplemental Figure 5). This was concordant with a decrease in physical activity at night during that time period (supplemental Figure 6), which was also recorded by the implanted sensor. These results indicate that cyclical body temperature variation may have shifted partially from nocturnal toward diurnal, which has been reported when mice are energetically challenged (eg, by cold or hunger).9 The hypothermia observed in allo-HCT mice raises the question of whether warming the animals would be beneficial. Although mild heating has been shown to enhance hematopoiesis in mice,10 a prior study demonstrated that elevation of housing temperature to thermoneutrality (∼30°C) increased murine GVHD.11
Although temperature differences between the allo-HCT and syn-HCT groups were obvious on visual inspection of the data beginning at ∼2 weeks posttransplant, by that time, allo-HCT mice were easily distinguishable from syn-HCT mice based on clinical assessment (supplemental Figure 3). We hypothesized that more subtle signals that could distinguish the 2 groups were present in the data much earlier and could be revealed by applying unsupervised machine learning approaches. Based on salient findings from the above analyses (Figure 1E; supplemental Figures 4D and 5), we selected 2 metrics as input into machine learning: mean hourly temperatures and mean daily night–day temperature differences (Figure 2A). We used a simple approach combining principle component analysis (using data binned into sliding windows) and K-means clustering to classify animals into 2 groups (Figure 2A). Because the clustering was performed in an unsupervised fashion, we calculated an adjusted Rand Index12 to assess concordance between K-means–assigned grouping and true identities of the data points (Figure 2A). We found that K-means correctly differentiates the SynHighT group from the AlloHighT group as early as day 4 or 5 using night–day temperature difference (Figure 2B) and SynLowT mice from AlloLowT mice as early as day 5 or 6 using hourly means (Figure 2C), which represent time frames prior to engraftment (∼day 7) in this model.
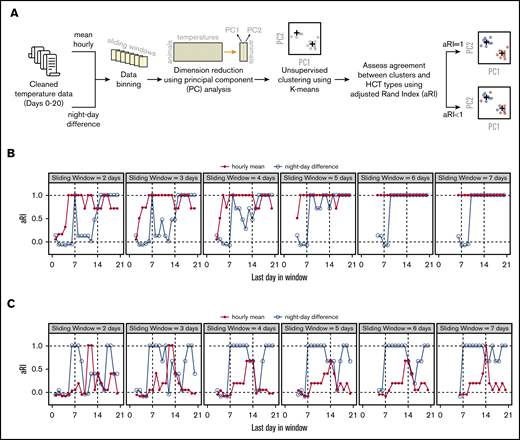
Temperature data analysis using machine learning. (A) Workflow of data analysis. (B) Concordance between actual and algorithm-generated SynHighT vs AlloHighT classifications when mean hourly temperatures and night–day difference were used as input for clustering. (C) Concordance between actual and algorithm-generated SynLowT vs AlloLowT classifications when mean hourly temperatures and night–day difference were used as input for clustering. Concordance was measured using an adjusted Rand Index (range, −1 to 1; a value of 1.0 corresponds to 100% concordance). The x-axes in panels B and C represent the last day of the sliding window, and the widths are indicated in the top portion of each plot. aRI, adjusted Rand Index.
Temperature data analysis using machine learning. (A) Workflow of data analysis. (B) Concordance between actual and algorithm-generated SynHighT vs AlloHighT classifications when mean hourly temperatures and night–day difference were used as input for clustering. (C) Concordance between actual and algorithm-generated SynLowT vs AlloLowT classifications when mean hourly temperatures and night–day difference were used as input for clustering. Concordance was measured using an adjusted Rand Index (range, −1 to 1; a value of 1.0 corresponds to 100% concordance). The x-axes in panels B and C represent the last day of the sliding window, and the widths are indicated in the top portion of each plot. aRI, adjusted Rand Index.
In summary, our findings indicate that continuous body temperature measurement in mice reveals signals associated with GVHD, including those within the first week posttransplant, which corresponds to a time frame prior to what is currently possible for reliable noninvasive detection of GVHD in mice or humans. The lower body temperatures observed in the GVHD group at later time points run counter to our original hypothesis that inflammatory cytokines released in GVHD would be pyrogenic. We speculate that the drops in body temperature as the animals become more sick are due to difficulties in maintaining body temperature, as a result of decreased movement and/or anorexia, leading to a loss of body fat. Our results suggest that investigating whether continuous temperature monitoring in humans undergoing allo-HCT shows signals predictive of GVHD will be worthwhile. A limitation of our study is that the machine learning approach that we used does not permit direct biological interpretation of the signals detected by the algorithm. Nonetheless, an analogous strategy (ie, continuous temperature monitoring and computational analysis) could lead, in principle, to early risk stratification of GVHD in humans, providing an opportunity for prevention or early intervention in aGVHD. If this could be achieved using surface temperature13 data, which are easily measurable with wearable sensors, the approach could be noninvasive and simple for patients and implementable at a relatively low cost. Extending this approach to the early detection of human aGVHD would likely require incorporation of additional data from potential confounding factors in the mathematical modeling, such as variations in room temperature, presence or absence of infection, engraftment-related temperature elevation, and use of antipyretics.
Acknowledgments
The authors thank Ryan Spengler, Erin Sandford, Nicholas W. Lukacs, and Erin G. Janowicz for helpful discussions and the Physiology Phenotyping Core at the University of Michigan for technical assistance.
K.H. was supported by a Clinical and Translational Science Award from the National Center for Advancing Translational Sciences of the National Institutes of Health (NIH). Z.W. was supported in part by NIH grant CA046592 (National Cancer Institute) through the Cancer Center Support Grant Development Funds from the Rogel Cancer Center and an investigator award from Michigan Precision Health Initiative. H.F. was supported by a Postdoctoral Fellowship for Research Abroad from Japan Society for the Promotion of Science and YASUDA Medical Foundation Grants for Research Abroad. M.T. and S.W.C. acknowledge support from an A. Alfred Taubman Medical Research Institute Grand Challenge Award. P.R. acknowledges support from NIH grants CA203542 (National Cancer Institute), CA217156 (National Cancer Institute), and HL128046 (National Heart, Lung, and Blood Institute). M.T. acknowledges support from Mary Petrovich through the University of Michigan Fast Forward Gastrointestinal Innovation Fund. The Physiology Phenotyping Core at the University of Michigan was supported in part by the Frankel Cardiovascular Center.
Authorship
Contribution: M.T. and P.R. conceived the study; K.H., H.F., P.R., and M.T. designed the experiments; K.H., H.F., S.W., and C.K.Z. performed experiments; K.H. and Z.W. analyzed data; K.H., Z.W., S.W.C., P.R., and M.T. analyzed and interpreted results; K.H. and M.T. wrote the manuscript; and all authors reviewed the manuscript.
Conflict-of-interest disclosure: The authors declare no competing financial interests.
Correspondence: Muneesh Tewari, University of Michigan, 109 Zina Pitcher Pl, 1502 BSRB, SPC 2200, Ann Arbor, MI 48109; email: mtewari@med.umich.edu.

