

Key Points
Use of escalating IV MTX in children with DS and ALL was well tolerated and led to excellent long-term outcomes.

Abstract
The Children’s Cancer Group 1991 study was a clinical trial for children with National Cancer Institute standard-risk acute lymphoblastic leukemia (ALL). This trial demonstrated that 5 doses of vincristine and escalating IV methotrexate (MTX) without leucovorin rescue in the interim maintenance (IM) phases resulted in superior event-free survival (EFS) when compared with 2 doses of vincristine, oral (PO) MTX, PO mercaptopurine, and dexamethasone. This report describes a favorable outcome of this regimen in patients with Down syndrome (DS). Forty-four patients with DS were randomized to the arms containing PO MTX during IM, and 31 to those containing IV MTX. Ten-year EFS rates for patients with DS randomized to IV MTX vs PO MTX were 94.4% ± 5.4% vs 81.5% ± 6.6%, respectively. IV methotrexate with strict escalation parameters, as given in this study, was well tolerated, although the mean total tolerated dose received was lower in patients with DS than in those without DS. There was no increase in hepatic toxicity, systemic infections, or treatment-related deaths in patients with DS during IM on either the IV or PO MTX arms, as compared with those without DS. The incidence of mucositis was increased in patients with DS as compared with patients without DS, particularly among patients who received IV MTX. This trial was registered at www.clinicaltrials.gov as #NCT00005945.
Introduction
Down syndrome (DS) is the most common human aneuploid abnormality in children and results in a marked increase in the incidence of acute leukemia.1,2 Children with DS have a 10- to 20-fold increased risk of developing acute leukemia.3-6 In fact, DS is among the strongest risk factors for developing acute lymphoblastic leukemia (ALL) and acute myelogenous leukemia. In contrast to children with DS acute myelogenous leukemia, those with DS-ALL have historically had inferior outcomes when treated with risk-assigned therapy.3,7-17 Factors responsible for this outcome disparity are biological and clinical and include a lower incidence of favorable chromosomal abnormalities,13,18-21 increased sensitivity to methotrexate (MTX) and a higher incidence of infectious complications and treatment-related morbidity and mortality.17 Patients with DS tend to be very sensitive to MTX therapy, and often develop pronounced MTX-related toxicities that necessitate dose reductions.22-25 Children’s Cancer Group (CCG) 1991 was a clinical trial for children with standard-risk ALL (SR-ALL) as defined by age 1 to 9.99 years and initial white blood cell count (WBC) <50 × 109/L. Children enrolled in CCG 1991 received “standard” CCG-modified Berlin Frankfurt Münster (BFM) backbone therapy with dexamethasone used as the sole corticosteroid during steroid-containing phases of therapy. CCG-1991 had 2 primary aims for patients with a rapid early response (RER) to therapy, defined on the basis of bone marrow (BM) morphology at day 14 and day 28 of induction therapy. The first was to determine in a randomized fashion the benefit of a second delayed intensification (DI) phase when added to a dexamethasone backbone. The second was to compare outcome with 2 different treatments during the two 8-week interim maintenance (IM) phases: vincristine and escalating-dose IV MTX every 10 days without leucovorin vs standard weekly oral (PO) MTX, daily PO mercaptopurine (6-MP), and monthly vincristine and dexamethasone. Oral leucovorin rescue was not given to patients with DS-ALL after intrathecal (IT) MTX in this protocol, unlike the common practice in current Children’s Oncology Group (COG) trials. Details of therapy and outcomes of randomized patients, including those with DS eligible for randomization, have been previously published.26 Here, we report on the outcomes and toxicities of the DS patients enrolled in CCG-1991.
Methods
CCG-1991 opened in June 2000 and completed accrual in February 2005. Eligible patients had SR-ALL with the diagnosis of ALL based upon a BM aspirate with >25% L1 or L2 lymphoblasts by French-American-British morphology, negative histochemical staining for myeloperoxidase, and reactivity with monoclonal antibodies to B-lineage– or T-lineage–associated differentiation antigens, as previously described.27,28 Patients with L3 morphology or with t(8;14), t(8;22), or t(2;8) were excluded. Patients with systemic corticosteroid exposure for >48 hours during the preceding month were ineligible.
Treatment protocol
The National Cancer Institute (NCI) and institutional review boards of all participating CCG institutions approved the study. Written informed consent was obtained from parents or guardians according to the guidelines of the National Institutes of Health. Patients received 4 weeks of 3-drug induction therapy with IT cytarabine × 1 dose, IV vincristine weekly for 4 doses, PO dexamethasone daily for 28 days, a single dose of intramuscular pegaspargase, and 2 doses of IT MTX. BM status was determined by local institutions; patients with ≥5% BM blasts on day 7 were reassessed with aspirates on day 14. Randomization as a RER required <25% blasts (M1 or M2 BM status) by day 14, remission status with <5% blasts (M1) at day 28 of induction, and absence of unfavorable leukemia cytogenetics [t(4;11)(q21;q23), t(9;22)(q34;q11), balanced t(1;19)(q23;p13) or hypodiploidy with <45 chromosomes]. Patients with unfavorable cytogenetics, M3 BM (>25% blasts) on day 7 of induction and M2 (5% to 25% blasts) on day 14, or M3 BM on day 14, and M3 BM on day 28 were nonrandomly assigned to receive more intensive therapy, that is, the “augmented regimen.” Randomization occurred between days 21 and 28 of the consolidation phase of therapy for those who met the randomization criteria. Eligible patients were assigned randomly in a 2 × 2 factorial design to 1 of 4 treatment regimens, as shown in Figure 1: regimen OS: PO MTX, 6-MP, vincristine and dexamethasone (during the IM phases), and a single DI (SDI) phase; regimen OD: PO MTX, 6-MP, vincristine and dexamethasone (during the IM phases), and 2 DI phases (DDI); regimen IS: IV MTX and vincristine (during the IM phases) and SDI; and regimen ID: IV MTX and vincristine (during the IM phases) and DDI. All regimens contained 2 IM courses. Girls were treated for 2 years and boys for 3 years from the start of IM #1. Patients with central nervous system 1 (CNS-1) (cerebrospinal fluid [CSF] WBC <5/µL, without blasts) and CNS-2 (CSF WBC <5/µL with blasts present) status or traumatic taps received standard IT and systemic therapy. Patients with CNS-3 (CSF WBC ≥5/µL with blasts present) were nonrandomly assigned to regimen OD with 1800 cGy cranial irradiation given during consolidation. The protocol required patients with biopsy-proven testicular involvement to receive 2400 cGy testicular irradiation during consolidation. Table 1 lists the therapeutic components of the 2 IM regimens. Details of the protocol therapy have previously been published.26
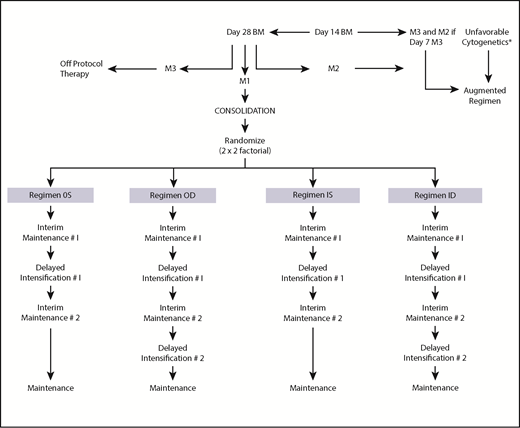
Study schema. *t(4;11)(q21;q23)(q34;q11), t(9;22), balanced t(1;19)(q23;p13), hypodiploidy with <45 chromosomes.
Study schema. *t(4;11)(q21;q23)(q34;q11), t(9;22), balanced t(1;19)(q23;p13), hypodiploidy with <45 chromosomes.
Interim maintenance regimens
| Oral methotrexate regimen | IV methotrexate regimen |
|---|---|
| Vincristine: 1.5 mg/m2 days 0 and 28 | Vincristine: 1.5 mg/m2 (maximum, 2 mg) every 10 d × 5 |
| Dexamethasone: PO 6 mg/m2/d days 0-4 and days 28-32 | Methotrexate: initial dose: 100 mg/m2 escalate by 50 mg/m2 per toxicity parameters every 10 d × 5 |
| Methotrexate: PO 20 mg/m2 weekly × 8 | Methotrexate intrathecal day 30 |
| Mercaptopurine: PO 75 mg/m2/d days 0-49 | |
| Methotrexate: intrathecal day 28 |
BM and cytogenetic evaluations
Cytogenetic evaluation was performed on diagnostic BM samples at local institutions using standard techniques and nomenclature.29 The CCG Cytogenetics Committee centrally reviewed each karyotype. ETV6-RUNX1 expression was analyzed by reverse transcriptase-polymerase chain reaction in the CCG ALL Reference Laboratory on blasts from the first 1000 subjects using previously published conditions and primers.30
Relapse definitions
BM relapse was defined as an M3 BM after achieving initial remission. Combined relapses included those with simultaneous recurrence in BM and extramedullary site(s). Isolated CNS relapse was diagnosed when CSF contained at least 5 WBC/µL with morphologically identifiable blasts on a cytospin preparation, without BM involvement or clinical evidence of leukemia elsewhere.
Statistical methods and analyses
Data current as of December 2016 are used in this report. Patients in remission at the end of consolidation were randomized in a 2 × 2 factorial design to test the relative benefits of SDI vs DDI and PO MTX vs escalating-dose IV MTX without leucovorin rescue. The main analytic end points were event-free survival (EFS) and overall survival (OS). EFS and OS rates at 10 years from study entry were reported for all eligible patients enrolled in the study, as well as for all eligible DS and non-DS patients. For the randomized group comparisons, EFS and OS times were calculated from the date of randomization. EFS was defined as time to first event (relapse, second malignancy, or death) or last follow-up for those who were event-free. OS was defined as time to death or last follow-up for those who were alive. Patients without an event were censored at the time of last contact. Comparisons of EFS and OS between randomized regiments used an intent-to-treat approach and included all patients who participated in randomization. Life table estimates were calculated by the Kaplan-Meier method and standard errors of the estimate were obtained by the Peto method.31 The log-rank test was used to compare survival between DS patients receiving SDI vs DDI regimens and between DS patients receiving PO MTX vs escalating-dose IV MTX regimens, or between DS vs non-DS patients. Five-year and 10-year estimates of survival rates are presented in this paper. The Pearson χ2 test or the Fisher's exact test for homogeneity of proportions was used to compare baseline patients’ clinical characteristics and incidences of grades 3/4 nonhematological toxicities among patients with or without DS.
Results
Patient characteristics
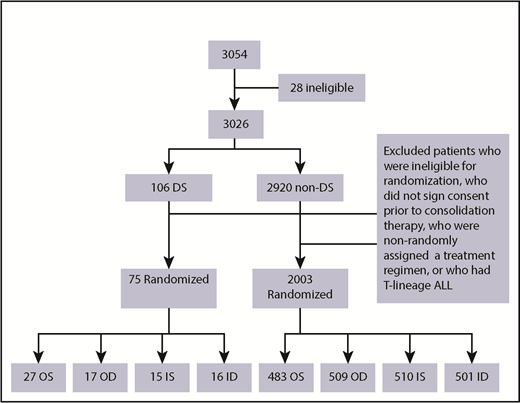
A total of 3054 patients from 109 institutions were enrolled in CCG 1991 between 1 June 2000 and 31 January 2005. Twenty-eight patients were found to be ineligible as described previously.26 A total of 3026 eligible patients were enrolled: 106 patients with DS and 2920 without DS (non-DS). Median duration of follow-up of the 3026 patients was 10.8 years. Among the 106 DS patients, 16 parents/legal guardians did not sign consent for further treatment after induction, 8 either did not have adequate BM assessment in induction, were ineligible for randomization, or refused randomization, and 5 had high-risk (HR) features based on slow early response and were assigned to receive augmented therapy. Further excluding 2 DS patients with T-cell ALL, a total of 75 DS patients with B-precursor ALL (BP-ALL) participated in the 2 × 2 randomization: 27 to OS, 17 to OD, 15 to IS and 16 to ID (Figure 2). Of the 2920 non-DS patients, 2003 had BP-ALL and participated in the 2 × 2 randomization: 483 to OS, 509 to OD, 510 to IS, and 501 to ID (Figure 2). A total of 2078 patients with BP-ALL were randomized. Two DS patients (1 to IS and 1 to ID) were found to have hypodiploidy (<45 chromosomes) after randomization. These 2 patients were included in the analyses of EFS and OS following the intent-to-treat approach.
Of the 75 DS patients who participated in randomization, 44 were randomized to the PO MTX arms and 31 to the escalating IV MTX arms. Table 2 lists the characteristics of these patients.
Characteristics of randomized patients with and without DS
| DS | Total DS, n = 75 | Non-DS, n = 2003 | P* | |||
|---|---|---|---|---|---|---|
| PO MTX, n = 44 | IV MTX, n = 31 | P* | ||||
| Age at diagnosis, y | ||||||
| <2 | 2 | 0 | .33 | 2 | 184 | .07 |
| 2-5 | 32 | 20 | 52 | 1393 | ||
| 6-9 | 10 | 11 | 21 | 426 | ||
| Sex | ||||||
| Female | 24 | 13 | .28 | 37 | 1110 | .30 |
| Male | 20 | 18 | 38 | 893 | ||
| WBC | ||||||
| <20 × 109/L | 36 | 29 | .18 | 65 | 1659 | .39 |
| ≥20 × 109/L | 8 | 2 | 10 | 343 | ||
| Unknown/missing | 0 | 0 | 0 | 1 | ||
| CNS status | ||||||
| CNS-1 | 39 | 27 | .64 | 66 | 1772 | .99 |
| CNS-2 | 2 | 1 | 3 | 99 | ||
| CNS-3 | 0 | 0 | 0 | 5 | ||
| Unknown/missing | 3 | 3 | 6 | 127 | ||
| Cytogenetics | ||||||
| ETV6-RUNX1† | 1 | 0 | .99 | 1 | 357 | <.001 |
| Double trisomies 4 and 10‡ | 5 | 1 | .39 | 6 | 244 | .27 |
| BM day 7 | ||||||
| M1 | 28 | 18 | .64 | 46 | 900 | .016 |
| M2 | 6 | 7 | 13 | 599 | ||
| M3 | 8 | 6 | 14 | 424 | ||
| Uninterpretable | 2 | 0 | 2 | 35 | ||
| Not done/missing | 0 | 0 | 0 | 45 | ||
| BM day 14 | ||||||
| M1 | 18 | 13 | — | 31 | 1065 | .99 |
| M2 | 0 | 0 | 0 | 31 | ||
| M3 | 0 | 0 | 0 | 0 | ||
| Uninterpretable | 0 | 0 | 0 | 1 | ||
| Not done/missing | 26 | 18 | 44 | 905 | ||
—, not calculated.
The χ2 or Fisher's exact test was used after excluding unknown/missing/uninterpretable/not done groups.
Patients (n = 1041) were analyzed for the presence of ETV6-RUNX1 transcript.
Patients (n = 1330) were analyzed for the presence of trisomies 4 and 10.
Treatment outcome
The 10-year EFS and OS rates for the 3026 eligible patients from study entry were 87.4% ± 0.8% and 94.0% ± 0.6%. For the 106 children with DS-ALL and the 2920 children with non–DS-ALL, the 10-year EFS rates from study entry were 84.9% ± 4.6% vs 87.5% ± 0.8%, respectively (P = .44, log-rank test), and the 10-year OS rates were 89.4% ± 3.9% vs 94.1% ± 0.6%, respectively (P = .017, log-rank test).
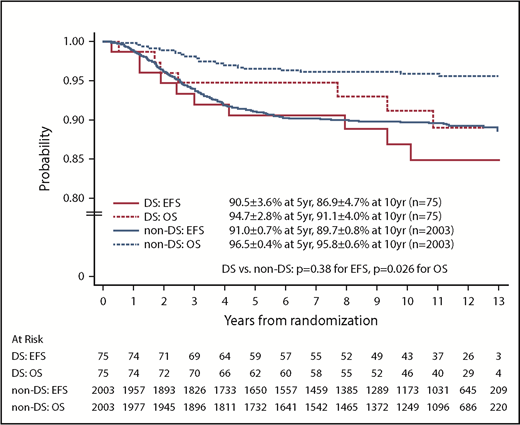
For the 2078 randomized RER patients, the 10-year EFS and OS rates from date of randomization were 89.6% ± 0.8% and 95.7% ± 0.6%. The 10-year EFS rates for the 75 patients with DS-ALL compared with the 2003 patients with non–DS-ALL were 86.9% ± 4.7% vs 89.7% ± 0.8% from date of randomization (P = .38, log-rank test; Figure 3). Corresponding OS rates were 91.1% ± 4.0% for DS-ALL and 95.8% ± 0.6% for non–DS-ALL (P = .026, log-rank test; Figure 3). The types and distribution of events that occurred in children with DS-ALL compared with non–DS-ALL are listed in Table 3. The pattern of events was similar among the 2 groups, with the least number of events occurring in the IV MTX arms. Interestingly, none of the patients with DS experienced CNS relapse as compared with 57 relapses involving CNS (38 isolated CNS relapses and 19 combined relapses including the CNS) among the 2003 non-DS patients. There were 2 deaths among patients with DS: 1 patient died during maintenance therapy from infectious complications; the other died 8 years after finishing therapy from undefined causes, unrelated to protocol therapy.
Distribution of events in the randomized patients with and without DS
| Event types | PO MTX | IV MTX | SDI | DDI | ||||
|---|---|---|---|---|---|---|---|---|
| DS (n = 44) | Non-DS (n = 992) | DS (n = 31) | Non-DS (n = 1011) | DS (n = 42) | Non-DS (n = 993) | DS (n = 33) | Non-DS (n = 1010) | |
| Event-free | 36 | 876 | 29 | 924 | 37 | 895 | 28 | 905 |
| iBM | 5 | 45 | — | 60 | 3 | 44 | 2 | 61 |
| iCNS | — | 27 | — | 11 | — | 22 | — | 16 |
| BM + CNS | — | 12 | — | 5 | — | 10 | — | 7 |
| BM + testicular | 1 | 4 | — | — | — | 1 | 1 | 3 |
| BM + other | — | — | 1 | 4 | — | 3 | 1 | 1 |
| CNS + other | — | 1 | — | 1 | — | 1 | — | 1 |
| Testicular | — | 9 | — | 1 | — | 6 | — | 4 |
| Other relapse | — | 5 | — | 1 | — | 4 | — | 2 |
| Second malignant neoplasm | 1 | 8 | — | 2 | 1 | 4 | — | 6 |
| Death as first event | 1 | 5 | 1 | 2 | 1 | 3 | 1 | 4 |
| Total events | 8 | 116 | 2 | 87 | 5 | 98 | 5 | 105 |
—, not calculated; iBM, isolated BM relapse; iCNS, isolated CNS relapse.
Among the 75 patients with DS-ALL and a RER who were randomized between the 2 IM regimens, the EFS and OS rates for patients with DS randomized to the escalating IV MTX arms were both 100% up to 9 years after randomization and were still as high as 94.4% ± 5.4% at 10 years. In contrast, EFS and OS rates for patients randomized to the PO MTX arms were 81.5% ± 6.6% and 88.4% ± 5.4% at 10 years after randomization (Figure 4). These results suggest that the regimens with escalating IV MTX may be superior to the standard IM regimens in DS patients, although the differences were not statistically significant. The latter could be due in part to limited sample size (P = .17 and .17 for EFS and OS, log-rank tests). Among patients with non–DS-ALL, those randomized to escalating IV MTX had significantly better EFS than those randomized to PO MTX (P = .019, log-rank test), with 10-year EFS rates of 91.1% ± 1.1% vs 88.3% ± 1.3%, respectively. Patients randomized to SDI vs DDI arms had similar EFS and OS, which was the case for both DS patients and non-DS patients.

Comparison by MTX arms for randomized patients with DS. (A) Comparison of EFS. (B) Comparison of OS.
Comparison by MTX arms for randomized patients with DS. (A) Comparison of EFS. (B) Comparison of OS.
Toxicity
Protocol therapy was well tolerated with 1 death during induction among the 106 patients with DS as compared with 14 in 2920 among non–DS-ALL patients. The protocol incorporated strict guidelines for MTX dose escalation, de-escalation, and other therapy modifications for various organ toxicities. Toxicities were graded according to the Common Toxicity Criteria (CTC) version 2 (NCI, Bethesda, MD). The incidence of grades 3/4 nonhematological toxicities during all treatment phases is listed and compared for patients with and without DS in Table 4. Selected key nonhematological toxicities during the IM phases are listed in Table 5 and compared between DS and non-DS patients, and within each subgroup during the IV and PO MTX IM phases. There were no clinically significant differences in neurotoxicity, hepatotoxicity, or serious infections with IV MTX during the IM phases in patients with DS compared with those without DS. Patients with DS, however, did experience more mucositis than those without DS during all phases of therapy. Also, patients without DS had a higher incidence of mucositis on the IV as compared with the PO MTX regimens. In addition, following protocol guidelines for MTX escalation, DS patients were unable to escalate MTX as often as non-DS patients, tolerating a mean IV MTX dose that was 70% of that attained by patients without DS.
Comparison of incidence of grades 3/4 nonhematological toxicities among randomized patients with and without DS
| Induction DS/non-DS, % | P | Consolidation DS/non-DS, % | P | IM-1 DS/ non-DS, % | P | DI-1 DS/ non-DS, % | P | IM-2 DS/ non-DS, % | P | DI-2 DS/ non-DS, % | P | Maintenance DS/non-DS, % | P | |
|---|---|---|---|---|---|---|---|---|---|---|---|---|---|---|
| Cardiovascular | 2.7/5.0 | .65 | 1.3/1.2 | .88 | 2.7/0.6 | .032 | 1.4/1.1 | .80 | 0/0 | — | 0/1.2 | .56 | 3.0/0.8 | .045 |
| Coagulation | 5.3/6.0 | .47 | 0/0.5 | .54 | 1.4/0.1 | .002 | 0/1.7 | .26 | 0/0 | — | 0/1.7 | .78 | 1.5/0.5 | .25 |
| Gastrointestinal* | 4.0/5.8 | .56 | 6.7/4.0 | .48 | 16.2/3.6 | <.001 | 16.4/7.0 | .007 | 20.3/4.2 | <.001 | 17.9/7.7 | .13 | 15.2/6.7 | .027 |
| Hepatic | 10.7/7.2 | .52 | 16.0/10.8 | .17 | 16.2/12.9 | .38 | 9.6/4.8 | .078 | 10.1/11.7 | .92 | 3.6/6.0 | .84 | 25.8/31.2 | .14 |
| Infection/febrile neutropenia | 14.7/15.3 | .84 | 18.7/9.9 | .014 | 12.2/8.3 | .46 | 28.8/23.9 | .43 | 11.6/8.5 | .37 | 32.1/26.4 | .73 | 50.0/42.1 | .26 |
| Neurology | 2.7/5.1 | .60 | 6.7/4.2 | .19 | 4.1/3.6 | .88 | 1.4/2.9 | .73 | 2.9/1.9 | .82 | 7.1/3.0 | .36 | 7.6/3.8 | .18 |
| Renal/genitourinary | 0/0.5 | .83 | 0/0.4 | .88 | 0/0.1 | .85 | 0/0.2 | .95 | 0/0.1 | .85 | 0/0.2 | .81 | 0/0.3 | .64 |
—, not calculated.
Differences in incidence mainly due to mucositis.
Comparison of incidence of selected nonhematological toxicities among patients with and without DS randomized to MTX regimens
| PO MTX | IV MTX | DS patients | Non-DS patients | |||||||||
|---|---|---|---|---|---|---|---|---|---|---|---|---|
| DS, % | Non-DS, % | P | DS, % | Non-DS, % | P | PO, % | IV, % | P | PO, % | IV, % | P | |
| ALT (grades 3/4) | ||||||||||||
| IM #1 | 16.3 | 17.1 | .70 | 12.9 | 7.6 | .48 | 16.3 | 12.9 | .69 | 17.1 | 7.6 | <.001 |
| IM #2 | 7.5 | 13.9 | .40 | 6.9 | 8.6 | .84 | 7.5 | 6.9 | .66 | 13.9 | 8.6 | .001 |
| Infection with neutropenia (grades 3/4) | ||||||||||||
| IM #1 | 4.7 | 2.6 | .43 | 0 | 2.3 | .39 | 4.7 | 0 | .22 | 2.6 | 2.3 | .66 |
| IM #2 | 5.0 | 3.9 | .72 | 0 | 1.5 | .51 | 5 | 0 | .22 | 3.9 | 1.5 | .001 |
| Leukoencephalopathy (all grades) | ||||||||||||
| IM #1 | 0 | 0.2 | .96 | 0 | 0.4 | .94 | 0 | 0 | — | 0.2 | 0.4 | .61 |
| IM #2 | 0 | 0.1 | .84 | 0 | 0.5 | .93 | 0 | 0 | — | 0.1 | 0.5 | .25 |
| Mucositis (grades 3/4) | ||||||||||||
| IM #1 | 2.3 | 0.6 | .30 | 29.0 | 3.4 | <.001 | 2.3 | 29.0 | .004 | 0.6 | 3.4 | <.001 |
| IM #2 | 10 | 0.6 | <.001 | 27.6 | 4.1 | <.001 | 10 | 27.6 | .13 | 0.6 | 4.1 | <.001 |
| Seizures (all grades) | ||||||||||||
| IM #1 | 0 | 0.1 | .83 | 3.2 | 1.2 | .55 | 0 | 3.2 | .24 | 0.1 | 1.2 | .02 |
| IM #2 | 0 | 0.1 | .84 | 0 | 0.8 | .89 | 0 | 0 | — | 0.1 | 0.8 | .05 |
—, not calculated; ALT, alanine aminotransferase.
Discussion
Historically, patients with DS and ALL have experienced inferior outcomes to patients without DS, due to both increased risk of relapse and increased morbidity and mortality with therapy.3,7-9,12,16,17,25,32,33 Most treatment-related mortality (TRM) is secondary to infectious complications. Dördelmann et al performed retrospective analyses of 4 consecutive BFM trials, and found that DS-ALL patients fared equally well to non–DS-ALL patients if they were able to receive all protocol-prescribed therapy (EFS 65% ± 9% vs 70% ± % ± 1%, P = .66).11 The doses of MTX given during consolidation in these trials ranged from 0.5g /m2 to 5g/m2 for 4 doses. Therapy-related morbidity was seen particularly with high-dose MTX, which necessitated therapy modifications in 43% of DS-ALL patients. Whitlock et al performed a retrospective analysis of the CCG ALL therapeutic trials between 1983 and 1995 and found that patients with DS-ALL were more likely to sustain induction failure, death, or relapse during induction than those with non–DS-ALL.34 Interestingly, however, the NCI HR patients with DS-ALL had comparable rates of induction remission and relapse to those without DS. Similarly, DS-ALL patients had decreased EFS on Pediatric Oncology Group trials compared with those without DS when they received less intensive therapy but not when they received intensive therapy.9 Even in recent COG frontline HR and SR ALL trials AALL0232 and AALL0331, DS-ALL patients had increased death rates during induction as compared with the non-DS cohort. With expanded supportive care guidelines and leucovorin rescue after IT MTX therapy, the induction mortality rates decreased in patients with SR DS-ALL but not in those with HR DS-ALL.33 Following modifications in supportive care, there was an improvement in EFS but not in OS in patients with SR DS-ALL.33 Excessive TRM in DS patients also occurred in UKALL 2003, open from 2003 to 2011, which enrolled 86 patients with DS-ALL. In 2009, due to excessive TRM among DS patients, the protocol was amended to exclude them from randomization, regardless of NCI risk, and assign them to a 3-drug induction, with daunorubicin added only for slow early responders.16 Also, strict supportive guidelines were mandated, including prophylactic antibiotics. Despite these measures, patients with DS-ALL had inferior EFS and OS as compared with those patients with non–DS-ALL. Buitenkamp et al recently reviewed the outcome of 653 patients with DS-ALL enrolled in 16 international trials. They found that patients with DS-ALL had inferior EFS and OS with increased TRM (8-year EFS 64% ± 2% vs 81% ± 2%, P < .0001 and OS 74% ± 2% vs 89% ± 1%, P < .0001).17 Although relapse was the main cause for inferior survival, TRM was the major cause of death in DS-ALL patients with favorable features (ETV6-RUNX1 and high hyperdiploidy). In addition, infection-associated TRM was increased in all protocol regimens and phases. More recently, Athale et al published comparative results of the Dana-Farber Cancer Institute of outcomes of children with DS (38) and non–DS-ALL (1248) in 2 consecutive trials (00-001 and 05-001).35 In both trials, induction consisted of 4 drugs (vincristine, prednisone, l-asparaginase, and doxorubicin). Patients in 00-001 received a single MTX dose of 4 g/m2 during induction; those in 05-001 received 40 mg/m2 in induction followed by a dose of 5 g/m2 during consolidation 1. These phases were followed by intensification with 30 weeks of l-asparaginase. In addition, doxorubicin was given for HR and very HR patients. Children with DS-ALL had significantly higher rates of mucositis, non-CNS thrombosis, and seizures compared with non–DS-ALL patients. However, their outcomes were similar to those for non–DS-ALL patients (5-year EFS and OS were 91% vs 84% and 97% vs 91%, respectively).
Here, we demonstrate that a very favorable outcome can be achieved for children with DS and NCI SR-ALL by use of IM phases with escalating IV MTX without leucovorin rescue. An interesting finding from our report is the complete lack of isolated or combined CNS relapses among the 75 children with DS and an RER as compared with 38 isolated and 19 combined CNS relapses among the 2003 non-DS children with BP-ALL and a RER. In this study, leucovorin rescue was not given after intrathecal therapy. Also, a very low rate of CNS events extended to all patients randomized to the IV MTX regimens. The rate was 1% in the IV MTX vs 2.5% in the PO MTX regimens. In fact, IV MTX eliminated CNS relapses in girls and testicular relapses in boys.26 In addition to IV MTX, dexamethasone, used as the sole corticosteroid in this study, may have contributed to the CNS protection, with its superior CNS penetration, and longer half-life in the CSF, as compared with prednisone.36 Increased toxicity in children with DS was mainly related to mucositis, which resulted in reduced escalation of IV MTX doses but did not result in increased frequency of severe infections due to mucosal barrier breakdown. The specific MTX escalation parameters and strict dose modifications for organ toxicity that were incorporated in this protocol (supplemental Appendix) seem to have achieved an optimal balance between reduction of toxicity and pursuit of treatment intensity, resulting in EFS rates of 100% at 5 years and 94% at 10 years. These results provide support for the current continued use of escalating IV MTX as the mainstay for children with DS enrolled in ongoing COG SR and HR-ALL trials. Survival data are not yet mature, but the toxicity profile has remained favorable in over 400 patients enrolled to date.37
The Children’s Oncology Group (COG) Data Sharing policy describes the release and use of COG individual subject data for use in research projects in accordance with National Clinical Trials Network (NCTN) Program and National Cancer Institute (NCI) Community Oncology Research Program (NCORP) Guidelines. Only data expressly released from the oversight of the relevant COG Data and Safety Monitoring Committee (DSMC) are available to be shared. Data sharing will ordinarily be considered only after the primary study manuscript is accepted for publication. For phase 3 studies, individual-level deidentified datasets that would be sufficient to reproduce results provided in a publication containing the primary study analysis can be requested from the NCTN/NCORP Data Archive at https://nctn-data-archive.nci.nih.gov/. Data are available to researchers who wish to analyze the data in secondary studies to enhance the public health benefit of the original work and agree to the terms and conditions of use. For non-phase 3 studies, data are available following the primary publication. An individual-level deidentified dataset containing the variables analyzed in the primary results paper can be expected to be available upon request. Requests for access to COG protocol research data should be sent to: datarequest@childrensoncologygroup.org. Data are available to researchers whose proposed analysis is found by COG to be feasible and of scientific merit and who agree to the terms and conditions of use. For all requests, no other study documents, including the protocol, will be made available and no end date exists for requests. In addition to above, release of data collected in a clinical trial conducted under a binding collaborative agreement between COG or the NCI Cancer Therapy Evaluation Program (CTEP) and a pharmaceutical/biotechnology company must comply with the data sharing terms of the binding collaborative/contractual agreement and must receive the proper approvals.
The full-text version of this article contains a data supplement.
Acknowledgments
The authors thank all of the patients and families who participated in this trial. The authors also thank all of the Children’s Oncology Group staff, institutional investigators, and their clinical research staff.
This work was supported by grants CA13539, U10 CA98543, U10 CA98413, U10 CA180886, and U10 CA180899 from the National Cancer Institute, National Institutes of Health.
S.P.H. is the Jeffrey E. Perelman Distinguished Chair, Department of Pediatrics. L.C.S. is the Robert Neerhout Professor of Pediatrics. W.L.C. is the Julie and Edward J. Minskoff Professor of Pediatrics and Pathology.
Authorship
Contribution: Y.M. participated in the design of the study, chaired the study, and wrote the manuscript; K.R.R. and J.H. participated in the study and edited the manuscript; L.J., M.D., and X.X. performed the statistical analyses and edited the manuscript; B.C.B. participated in the design of the study and cochaired the study; L.C.S. participated in the design of the study and edited the manuscript; N.W. and W.L.C. were involved in running the study and reviewed the manuscript; J.M.G.-F. and E.S. performed the molecular analyses and reviewed the manuscript; N.A.H. performed the cytogenetic analyses and reviewed the manuscript; S.P.H. is a member of the study committee, participated in the running of the study, and edited the manuscript; and P.S.G. participated in the design and running of the study and edited the manuscript.
Conflict-of-interest disclosure: Y.M. holds a position of senior medical director at Takeda Pharmaceuticals Company and has equities in Amgen and AstraZeneca. S.P.H. owns stock in Amgen, Pfizer, and Merck and has received consulting fees or honoraria from Novartis, Amgen, and Jazz Pharmaceuticals. W.L.C. chairs the Independent Data Monitoring Committee for an Amgen trial. P.S.G. is on Baxalta speaker’s bureau. The remaining authors declare no competing financial interests.
A complete list of the participating members of the Children’s Oncology Group appears in the supplemental appendix.
Correspondence: Yousif Matloub, 250 1st Ave, Unit 810, Charlestown, MA 02129; e-mail: yhmatloub@wisc.edu.

