

Key Points
Integration of B-cell lymphoma genomic data and capture Hi-C reveals recurrently mutated regulatory elements influencing gene expression.
Expression of MMP14, which is targeted by a mutated cis-regulatory element, is associated with B-cell lymphoma patient survival.

Abstract
The identification of driver mutations is fundamental to understanding oncogenesis. Although genes frequently mutated in B-cell lymphoma have been identified, the search for driver mutations has largely focused on the coding genome. Here we report an analysis of the noncoding genome using whole-genome sequencing data from 117 patients with B-cell lymphoma. Using promoter capture Hi-C data in naive B cells, we define cis-regulatory elements, which represent an enriched subset of the noncoding genome in which to search for driver mutations. Regulatory regions were identified whose mutation significantly alters gene expression, including copy number variation at cis-regulatory elements targeting CD69, IGLL5, and MMP14, and single nucleotide variants in a cis-regulatory element for TPRG1. We also show the commonality of pathways targeted by coding and noncoding mutations, exemplified by MMP14, which regulates Notch signaling, a pathway important in lymphomagenesis and whose expression is associated with patient survival. This study provides an enhanced understanding of lymphomagenesis and describes the advantages of using chromosome conformation capture to decipher noncoding mutations relevant to cancer biology.
Introduction
B-cell lymphomas comprise a heterogeneous group of cancers, with diverse etiologies, clinical behaviors, and outcomes.1 The various B-cell lymphomas resemble B cells at specific stages of differentiation, with diffuse large B-cell lymphoma (DLBCL) and follicular lymphoma (FL) accounting for ∼43% and 17% of cases, respectively.2
The identification of driver mutations is fundamental to understanding oncogenesis and response to therapy. Although studies have identified genes and pathways frequently mutated in B-cell lymphoma,3-8 many tumors have no detectable driver mutations, and we do not yet have a complete understanding of the genetic alterations necessary for tumor development.6
The search for driver mutations in B-cell lymphoma has, however, been primarily restricted to coding regions.3-6 Gene regulation is highly cell type specific, and the interpretation of mutations within noncoding regions of lymphoma genomes has been in part constrained by a lack of information on relevant regulatory elements and their target genes.9,10 Furthermore, although mutation recurrence is an indicator of positive selection in tumors, the sheer size of the noncoding genome places a high statistical burden on an ability to distinguish passenger from driver mutations.
Cis-regulatory elements (CREs) and promoters controlling gene expression represent a highly enriched subset of the noncoding genome in which to search for potential driver mutations.11 The present article expanded on this principle by using information from promoter capture Hi-C (CHi-C) in naive B cells12 in an analysis of whole-genome sequencing data on 80 DLBCL and 37 FL tumors. By linking CRE mutation to gene expression (Figure 1), recurrently mutated noncoding regulatory regions were identified, thus enhancing our understanding of the oncogenic pathways and mechanisms relevant to B-cell lymphoma biology.

Analysis overview. CGCI, Cancer Genome Characterization Initiative; CNV, copy number variant; ICGC, International Cancer Genome Consortium; indels, insertions and deletions; SNV, single nucleotide variant.
Analysis overview. CGCI, Cancer Genome Characterization Initiative; CNV, copy number variant; ICGC, International Cancer Genome Consortium; indels, insertions and deletions; SNV, single nucleotide variant.
Materials and methods
Sequencing data
Data from 40 DLBCL, 37 FL, and 61 chronic lymphocytic leukemia (CLL) tumors, and matched normal samples, were obtained from the ICGC.5,13 Data from an additional 40 DLBCL tumors and matched normal samples were obtained from the CGCI.8 The ICGC data have been aligned, processed, and variants called as part of the Pan-Cancer Analysis of Whole Genomes (PCAWG) project. A consensus approach to variant calling was adopted by PCAWG, combining the results of multiple pipelines to call SNVs, insertions and deletions, CNVs, and structural variations (https://github.com/ICGC-TCGA-PanCancer). For each mutation type, we downloaded and used variants called by a respective pipeline. To minimize technical differences between the cohorts, we aligned, processed, and called variants in the CGCI data using identical pipelines (as described in the supplemental Methods). RNA-sequencing data for all samples were obtained from the CGCI and ICGC and processed as described in the supplemental Methods. This study uses only published sequencing data, and ethical approval was therefore not sought.
Definition of regulatory regions
Promoter regions were defined as the intervals spanning 400 bp upstream to 250 bp downstream of transcription start sites from RefGene.14 CREs were defined by using promoter CHi-C data generated on naive B cells.12 HindIII fragments interacting with at least 1 protein-coding gene promoter were considered CREs. Only promoter–CRE interactions with a CHiCAGO score ≥515 and a linear distance ≤5 megabase (Mb)16 were included in the analysis. Additional filtering of the CHi-C data was completed to reduce false identification of interactions (supplemental Methods).
Analysis of recurrent mutation of regulatory regions
Promoters and CREs were tested independently for recurrent mutation across tumors above that expected given the background mutation rates, using a Poisson binomial model per Melton et al.17 We used a Poisson binomial model because it allowed us to consider tumor-specific mutation rates, which is not possible using many alternative approaches.18,19 Briefly, the mutation probability of each regulatory region in each tumor was computed by fitting a logistic regression model to all data, taking into account the following features: tumor identification, mutation trinucleotide context, regional replication timing, and 1 Mb mutational density. Replication timing was estimated as the mean of replication timing data from HeLa, HepG2, K562, MCF-7, and SK-N-SH cell lines.20 Promoters and CREs overlapping open reading frames (defined in Ensembl v73), extended 5 bp in each direction to account for splice sites, were excluded from the analysis.18 Regions of CREs overlapping the 3′ untranslated region and the 5′ untranslated region were also excluded from the analysis.
The probability that a region is mutated was defined as:
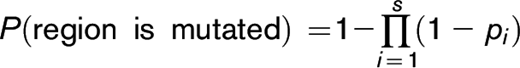
where i is the base position, s is the number of nucleotides considered in the region (ie, not excluded), and pi is the probability that a mutation occurs at base i. P values were computed for each promoter and CRE using an approximation of the Poisson binomial model implemented in the poibin R package.17 Recurrent mutation P values follow a discrete distribution, and we therefore used the right tail masses to compute randomized P values for each region.21
Relationship between simple somatic mutations at CREs and gene expression
Significantly mutated CREs were examined for differential expression of target genes between mutated and nonmutated tumors. For each CRE, tumors were classified as mutated or nonmutated based on the presence of SNVs or insertions and deletions at the CRE; differential expression was assessed by using permutation testing.22 In the permutation testing, a Student t test was performed by using the mutated/nonmutated tumor labels to generate a single t value (the observed t value). The expression values for the mutated/nonmutated tumors were then permuted 10 000 times to generate 10 000 additional t values (the permutated t values). The permuted t values generally fit a Gaussian distribution, against which the observed t value could be compared by using a 2-tailed test. Samples with CNVs at either the CRE or target gene were excluded. In addition, samples with translocation or inversion breakpoints ≤1 Mb from the target gene were excluded. Only CREs mutated in at least 5 tumors were tested, after removal of tumors with CNVs at the CRE or target gene, or proximal translocation or inversion breakpoints. CREs interacting with multiple gene promoters were tested multiple times. Only CREs interacting with the promoters of protein-coding genes were examined. The Benjamini-Hochberg procedure was used to adjust for multiple testing, and significance was set at a threshold of Q < 0.1.
Relationship between CNVs at CREs and gene expression
Focal amplifications and deletions were defined as absolute copy number changes ≥1 and size ≤3 Mb. To identify tumors with CNVs at CREs driving altered gene expression, we performed the following: (1) identified tumors with amplifications or deletions at a CRE; (2) excluded tumors with CNVs at the target gene; (3) excluded tumors with translocation or inversion breakpoints ≤1 Mb from the target gene; and (4) assessed the association between the copy number change d and log2-transformed gene expression e by fitting a linear regression model ( ). A t statistic was computed by using the estimated
  coefficient and standard error, and a P value was computed from this t statistic under the null hypothesis of no association between copy number change and gene expression (
 ). Only regulatory regions mutated in at least 5 tumors were tested, after exclusion of tumors with CNVs at the target gene or proximal translocation and inversion breakpoints. Copy number changes were calculated relative to the ploidy of the tumor, as determined by ascatNgs.23 For simplicity, all losses and gains were considered equally when calculating correlation coefficients (ie, each tumor is defined as having either a loss, no change, or gain in copy number). In addition to conducting individual analyses of DLBCL and FL tumors, a meta-analysis of the 2 tumor types was completed under a fixed effects model. The Benjamini-Hochberg procedure was used to adjust for multiple testing, and significance was set at a threshold of Q < 0.1.
Survival analysis
To examine the relationship between gene expression and overall survival, data were used from 3 independent DLBCL patient cohorts from Barrans et al,24 Lenz et al,25 and Reddy et al,6 which were downloaded from the Gene Expression Omnibus repository. Patients were censored based on their last known clinical follow-up. For each series, gene expression was first treated as a continuous variable in a Cox proportional hazards model with inclusion of age at diagnosis, sex, cell-of-origin subtype, and treatment received (chemotherapy or rituximab-chemotherapy) as covariates. Analysis was performed by using the log-rank test to estimate expression-associated hazard ratios, and the Wald test was used to determine statistical significance. The proportional hazards assumption in the Cox models was assessed by using scaled Schoenfeld residuals implemented in the “cox.zph” function from the survival R package. Meta-analyses of the independent patient cohorts were performed under a fixed effects model. We also stratified cancers according to the expression of the gene, defining tumors as having high or low expression of a gene if the expression value was within the top or bottom one-third of expression values for the gene across all cancers, respectively. Kaplan-Meier analysis was then performed according to this tumor stratification, and the difference between the survival distributions was assessed by using the log-rank test.
Data availability
ICGC data, processed as part of the PCAWG project, were downloaded from the ICGC Data Coordination Center Data Portal (project codes MALY-DE and CLLE-ES). CGCI data were downloaded from dbGaP (phs000532.v7). Naive B-cell CHi-C data were obtained from Javierre et al.12 Histone chromatin immunoprecipitation–sequencing data were downloaded from BLUEPRINT (sample C005Q). Clinical and gene expression data used in the survival analyses were downloaded from the Gene Expression Omnibus repository (GSE32918 and GSE10846) and obtained from Reddy et al.6
Results
Recurrently mutated noncoding regulatory regions
After quality control and filtering of whole-genome sequencing data, we identified 1 169 005 SNVs in the DLBCL tumors (5.07 mutations per megabase) and 255 889 SNVs in FL tumors (2.40 mutations per megabase) (supplemental Table 1). Recurrently mutated regions were identified as those containing a greater number of mutations than that expected given the background mutation rate, adjusting for tumor-specific mutation rates, trinucleotide contexts, replication timing, and 1 Mb mutational density.17 To identify somatic mutations in noncoding regulatory regions, 21 750 regions associated with 17 677 genes were defined as promoters.14 We identified recurrently mutated promoters associated with 17 and 4 genes in DLBCL and FL tumors, respectively (Q < 0.1) (supplemental Table 2). These genes include BLK, IRF8, and SPIB, which are implicated in lymphoma development and growth26-28 but for which recurrent promoter mutations have not previously been reported.9
Using promoter CHi-C in naive B cells,12 we defined 69 872 genomic fragments containing putative CREs (median size, 2.1 Kb) involved in 142 791 unique significant interactions with promoters (median linear distance, 292 Kb) and constituting 7% of the genome. These promoter-interacting fragments have previously been shown to be enriched for ATAC-sequencing accessibility and regulatory histone marks.12 We identified 78 recurrently mutated CREs interacting with the promoters of 72 genes in DLBCL tumors (Q < 0.1) (supplemental Table 3) and 42 recurrently mutated CREs interacting with the promoters of 37 genes in FL tumors (Q < 0.1). The majority of these recurrently mutated CREs (59% in DLBCL and 63% in FL) do not interact with the promoter of the closest gene but with the promoters of more distal genes. Genes targeted by recurrently mutated CREs include PAX5, which interacts with 10 and 8 recurrently mutated CRE fragments in DLBCL and FL, respectively, and whose expression is disrupted by noncoding mutations in CLL13 and multiple myeloma.29 Furthermore, we identified recurrently mutated CREs interacting with genes known to also be affected by coding mutations, including 5 genes previously associated with noncoding mutations in B-cell lymphoma (ARID5B, BCL2, BCL6, ETS1, and PAX5) and 5 genes for which only coding mutations have previously been reported (DMXL1, IKZF3, PCDHB1, SEMA3D, and SYPL1).6,7,9,10
Palimpsest was used to characterize the processes most likely to be responsible for the recurrent mutation of promoters and CREs (supplemental Tables 4-6; supplemental Methods).30-32 In DLBCL, promoters and CREs of genes (including BCL6) were enriched for mutations attributed to signatures SBS84 or SBS85 (P < .05), which are associated with the activity of activation-induced deaminase,32 supporting previous observations.33 Furthermore, the promoters and CREs of multiple genes, including SGK1 and ST6GAL1 in DLBCL, were enriched for mutations attributed to signature SBS3, which is indicative of defective homologous recombination repair,34 consistent with distinct processes underlying the mutation of different regulatory elements.
To identify noncoding driver mutations in regulatory regions, we compared the expression levels of target genes of recurrently mutated CREs between mutated and nonmutated tumors, using RNA-sequencing data from each tumor. Tumors with copy number changes overlapping either the CRE or target gene and tumors with translocation or inversion breakpoints ≤1 Mb from the target gene were excluded from this analysis. Mutation of a CRE interacting with the TPRG1 promoter, occurring in 9 tumors (Figure 2), was associated with increased TPRG1 expression in DLBCL (Q = 0.09) (Figure 3; supplemental Table 7). This CRE is annotated by epigenetic marks indicative of active enhancers (supplemental Figure 1; supplemental Methods) and located at a regulatory region previously identified in DLBCL to be bound by the bromodomain 4 (BRD4) chromatin reader protein,35 which is characteristic of enhancers important in DLBCL growth and cell cycle progression. Amplifications of the TPRG1 gene were present in an additional 18 DLBCL tumors, with the mutation of recurrently mutated TPRG1 CREs and TPRG1 gene amplifications tending to occur in different tumors (2-tailed Fisher’s exact test, P = .016), suggesting alternative mechanisms of gene dysregulation. Although the mutation of this region has previously been reported in B-cell lymphoma, it was not formerly associated with disrupted TPRG1 expression.9 This TPRG1 CRE is enriched for mutations attributed to signatures SBS84 (P = .002) and SBS85 (P = .030) (supplemental Table 5), consistent with it being a target of activation-induced deaminase activity.32,36 The function of TPRG1 is poorly characterized; however, it is regulated by p63,37 which has been implicated as playing a role in lymphoma oncogenesis.38
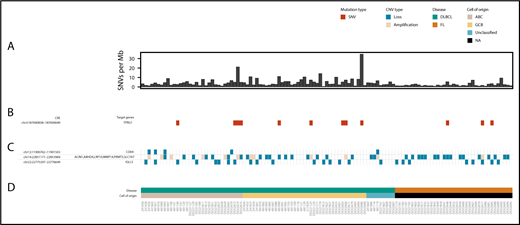
Overview of CRE mutations, amplifications, and losses associated with altered target gene expression in DLBCL and FL. (A) Genome-wide mutation burden for each tumor. (B) Occurrence of SNVs in the TPRG1 CRE. (C) Occurrence of amplifications and losses at CREs associated with altered target gene expression. (D) Disease type and the cell of origin of each tumor. The figure was generated by using GenVisR.60
Overview of CRE mutations, amplifications, and losses associated with altered target gene expression in DLBCL and FL. (A) Genome-wide mutation burden for each tumor. (B) Occurrence of SNVs in the TPRG1 CRE. (C) Occurrence of amplifications and losses at CREs associated with altered target gene expression. (D) Disease type and the cell of origin of each tumor. The figure was generated by using GenVisR.60
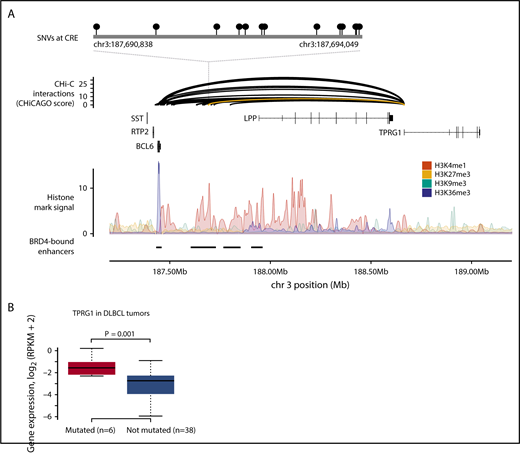
SNVs at CREs are associated with TPRG1 expression in DLBCL. (A) SNVs at a CRE interacting with the TPRG1 promoter. The top panel shows the position of SNVs at the CRE. The second panel shows chromatin looping interactions between the TPRG1 promoter and CREs, with the interaction between the promoter and the SNV-disrupted CRE colored yellow. The third panel details chromatin immunoprecipitation–sequencing histone mark signals in naive B cells. The bottom panel illustrates positions of BRD4-bound enhancers in DLBCL.35 (B) CRE mutation status and gene expression. Although the TPRG1 CRE is mutated in 9 DLBCL tumors, only 6 tumors were considered in the differential expression analysis, as 3 tumors have CNVs at the CRE or target gene. Differential expression assessed by using t value permutation test. Boxplot hinges extend to the most extreme data points that are no more than 1.5 times the interquartile range from the box. RPKM, reads per kilobase per million mapped reads.
SNVs at CREs are associated with TPRG1 expression in DLBCL. (A) SNVs at a CRE interacting with the TPRG1 promoter. The top panel shows the position of SNVs at the CRE. The second panel shows chromatin looping interactions between the TPRG1 promoter and CREs, with the interaction between the promoter and the SNV-disrupted CRE colored yellow. The third panel details chromatin immunoprecipitation–sequencing histone mark signals in naive B cells. The bottom panel illustrates positions of BRD4-bound enhancers in DLBCL.35 (B) CRE mutation status and gene expression. Although the TPRG1 CRE is mutated in 9 DLBCL tumors, only 6 tumors were considered in the differential expression analysis, as 3 tumors have CNVs at the CRE or target gene. Differential expression assessed by using t value permutation test. Boxplot hinges extend to the most extreme data points that are no more than 1.5 times the interquartile range from the box. RPKM, reads per kilobase per million mapped reads.
CNVs at CREs dysregulate gene expression
To identify CREs subject to somatic CNV, we identified CNVs in tumors by using whole-genome sequencing data (Figure 2). CNV-positive CREs were assessed for a correlation with the expression of target genes, excluding cases in which the gene was encompassed by a CNV, using RNA-sequencing data from each tumor. In DLBCL tumors, 20 CNV-positive CREs were associated with target gene expression (Q < 0.1) (supplemental Table 8), 19 of which are located in a 220 Kb region on chromosome 14. In FL tumors, 2 CNV-positive CREs, located in the same region of chromosome 14, were associated with target gene expression (Q < 0.1).
The CD69 promoter interacts with a CRE annotated by multiple epigenetic marks, overlapping a DLBCL BRD4-bound regulatory region (Figure 4A; supplemental Figure 2).35 This CRE region was deleted in 5 DLBCL tumors, which were associated with higher CD69 expression (Q = 0.06) (Figure 4B; supplemental Table 8), suggesting that this element acts as a repressor of CD69 expression. CD69 plays a role in B-cell development in mice,39 and enhanced antitumor immunity has been observed in mice deficient in CD69.40 Higher CD69 protein expression has previously been associated with shorter survival in patients with B-cell lymphoma,41,42 although we did not replicate this association with RNA expression in 3 independent series totaling 1670 DLBCL cases (supplemental Table 9). Although deletion of the CD69 CRE was accompanied by ETV6 exon deletions in 3 of the 5 tumors, altered ETV6 expression was not observed in these samples (Figure 4C).
CNVs at CREs are associated with CD69 expression in DLBCL. (A) Loss of a CRE interacting with the CD69 promoter. The top panel shows the position of CNVs at CRE, all of which are copy number losses. The second panel shows chromatin looping interactions between the CD69 promoter and CREs, with the interaction between the promoter and the CNV-disrupted CRE colored yellow. The third panel details chromatin immunoprecipitation–sequencing histone mark signals in naive B cells. The bottom panel shows the positions of BRD4-bound enhancers in DLBCL.35 (B) CNV status at CRE and CD69 expression in DLBCL tumors. (C) CNV status at CRE and ETV6 expression in DLBCL tumors. Association between copy number status and gene expression assessed through linear regression. Boxplot hinges extend to the most extreme data points that are no more than 1.5 times the interquartile range from the box.
CNVs at CREs are associated with CD69 expression in DLBCL. (A) Loss of a CRE interacting with the CD69 promoter. The top panel shows the position of CNVs at CRE, all of which are copy number losses. The second panel shows chromatin looping interactions between the CD69 promoter and CREs, with the interaction between the promoter and the CNV-disrupted CRE colored yellow. The third panel details chromatin immunoprecipitation–sequencing histone mark signals in naive B cells. The bottom panel shows the positions of BRD4-bound enhancers in DLBCL.35 (B) CNV status at CRE and CD69 expression in DLBCL tumors. (C) CNV status at CRE and ETV6 expression in DLBCL tumors. Association between copy number status and gene expression assessed through linear regression. Boxplot hinges extend to the most extreme data points that are no more than 1.5 times the interquartile range from the box.
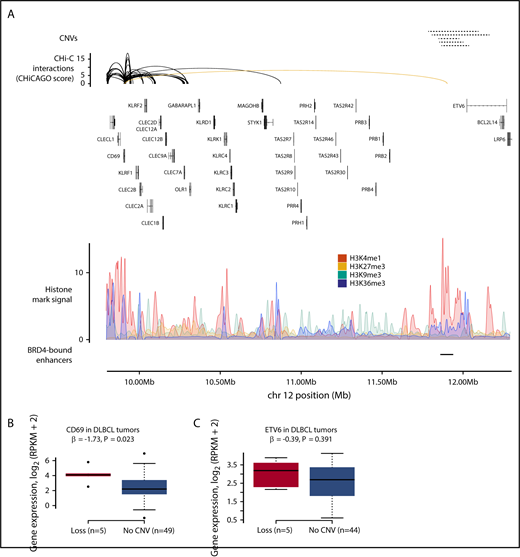
The T-cell receptor α (TRA) locus, which undergoes V(D)J recombination during T-cell development,43 was the subject of copy number losses and gains in both DLBCL and FL tumors (supplemental Table 8). This region is annotated with multiple histone marks and contains 2 DLBCL BRD4-bound regulatory regions35 (Figure 5A; supplemental Figure 3). In DLBCL, 8 CRE fragments at the TRA locus were deleted in 20 tumors and amplified in 11 tumors. These CRE fragments contact the promoters of 16 genes, with copy number changes associated with the expression of ABHD4, LRP10, MMP14, PRMT5, and SLC7A7 (Q < 0.1) (Figures 5B-C). In FL, these CRE fragments were deleted in 17 tumors and amplified in 1, with copy number changes associated with the expression of only ACIN1 (Q = 0.04). In the DLBCL tumors, increased CRE copy number was associated with reduced MMP14 expression (Q = 0.03). MMP14 is well established to negatively regulate Notch signaling,44 a pathway disrupted in DLBCL45 and through which the loss of MMP14 impairs B-cell differentiation.44 Lower MMP14 expression was associated with worse overall survival in DLBCL (hazard ratio, 0.85; 95% confidence interval, 0.77-0.95; P = .003) (supplemental Figure 4; supplemental Table 9). Increased CRE copy number was associated with increased PRMT5 expression in DLBCL tumors (Q = 0.03), although this trend in expression was driven by lower PRMT5 expression in tumors with CRE deletions, as increased PRMT5 expression was not observed in tumors with CRE amplifications.
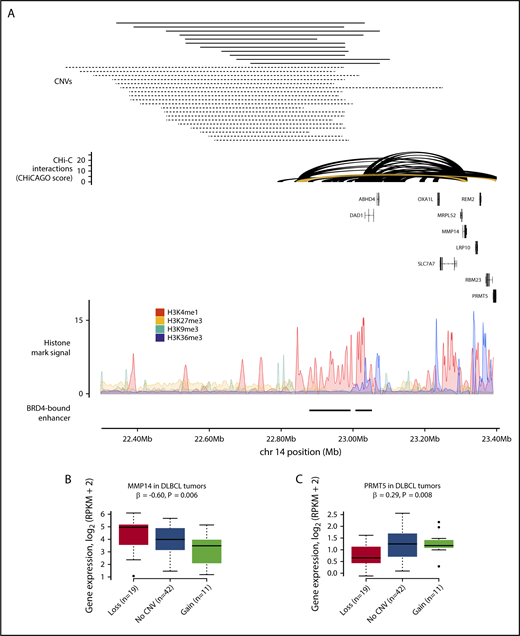
CNVs at CREs at the TRA locus are associated with gene expression in DLBCL. (A) Gain and loss of a CRE interacting with the MMP14 and PRMT5 promoters. The top panel shows the position of CNVs at the CRE, with copy number gains and losses represented by solid and dashed lines, respectively. The second panel shows chromatin looping interactions between the MMP14 and PRMT5 promoters and CREs, with the interaction between the promoters and the considered CRE colored yellow. The third panel details chromatin immunoprecipitation–sequencing histone mark signals in naive B cells. The bottom panel shows positions of BRD4-bound enhancers in DLBCL.4 CNV status at CRE and expression of MMP14 (B) and PRMT5 (C) in DLBCL tumors. Although the CREs are lost in 20 tumors, only 19 tumors are considered in the differential expression analysis, as 1 tumor also has a CNV at the target genes. Association between copy number status and gene expression assessed through linear regression. Boxplot hinges extend to the most extreme data points that are no more than 1.5 times the interquartile range from the box.
CNVs at CREs at the TRA locus are associated with gene expression in DLBCL. (A) Gain and loss of a CRE interacting with the MMP14 and PRMT5 promoters. The top panel shows the position of CNVs at the CRE, with copy number gains and losses represented by solid and dashed lines, respectively. The second panel shows chromatin looping interactions between the MMP14 and PRMT5 promoters and CREs, with the interaction between the promoters and the considered CRE colored yellow. The third panel details chromatin immunoprecipitation–sequencing histone mark signals in naive B cells. The bottom panel shows positions of BRD4-bound enhancers in DLBCL.4 CNV status at CRE and expression of MMP14 (B) and PRMT5 (C) in DLBCL tumors. Although the CREs are lost in 20 tumors, only 19 tumors are considered in the differential expression analysis, as 1 tumor also has a CNV at the target genes. Association between copy number status and gene expression assessed through linear regression. Boxplot hinges extend to the most extreme data points that are no more than 1.5 times the interquartile range from the box.
Although copy number changes at the TRA locus have previously been observed in B-cell malignancies,46-48 it is disputed whether these variants are pathogenic lesions occurring in the tumor cells,46 or whether they occur not in the tumor cells but in infiltrating T cells,47 which are often found in lymphoma as part of the immune response.49 To assess whether infiltrating T cells may be responsible for CNVs at the TRA locus, we addressed the potential issue of normal contamination by using tumor purity estimates from ascatNgs for each sample. CNV calling by ascatNgs is suboptimal when there is >50% contamination.50 In view of this fact, T-cell contamination is less likely to be responsible for observed CNVs when normal contamination is <50%. In 15 of 20 DLBCL samples and 11 of 17 FL samples with TRA locus deletions, normal contamination was >50%, suggesting that the TRA locus losses observed in these samples may not occur in cancer cells but instead in infiltrating T cells. Conversely, in all 11 DLBCL samples and in the 1 FL sample with TRA locus amplifications, normal contamination was <50%, consistent with TRA locus amplification being more likely associated with tumor cells, rather than infiltrating cells.
Many CREs were affected by expression-associated CNVs in both DLBCL and FL tumors (supplemental Table 8), and we therefore conducted a meta-analysis of these association statistics under a fixed effects model (supplemental Table 10). In this meta-analysis, CNV-positive CREs interacting with the promoters of MMP14, PRMT5, and SLC7A7 were associated with the expression of these genes (Q < 0.1), suggesting a common effect of these CNVs on target gene expression in these B-cell malignancies.
Meta-analysis of the DLBCL and FL tumors also identified 2 CREs interacting with the IGLL5 promoter, for which focal deletion was associated with lower IGLL5 expression (Q < 0.1) (supplemental Table 10). The CNV-positive CRE most strongly associated with IGLL5 expression (Q = 0.03) (Figure 6) was deleted in 14 DLBCL tumors and 6 FL tumors, and annotated by epigenetic marks indicative of active enhancers (supplemental Figure 5). Although the function of IGLL5 remains to be established, it is recurrently mutated in DLBCL51 and is homologous to IGLL1, a gene that plays a critical role in B-cell development.52 Furthermore, IGLL5 has been shown to function as a tumor suppressor in a clustered regularly interspaced short palindromic repeats (CRISPR)–based screen of DLBCL cell lines,6 a finding in keeping with reduced IGLL5 expression being associated with CRE deletion. Although focal deletion of regions encompassing the IGLL5 CRE occur in other B-cell malignancies, including childhood acute lymphoblastic leukemia53 and CLL,54 their pathogenicity is unclear.54,55 Because the IGLL5 CRE is located at the immunoglobulin λ light chain locus (IGL), Mraz et al55 postulated that such deletions are likely to be merely the consequence of IGL rearrangements. Conversely, Mangum et al53 has shown that the locus deletions observed in acute lymphoblastic leukemia occur independently of IGL rearrangement and frequently do not involve the VJ junction nor follow the ordered model of V(D)J recombination. Many of the CNVs observed in the DLBCL and FL tumors similarly do not involve the VJ junction, suggesting that they also occur independently of V(D)J recombination. Because focal deletion of this region has previously been observed in CLL,54 we completed a secondary analysis of this CRE in 61 CLL tumors.13 In these tumors, deletion of the CRE was also associated with lower IGLL5 expression (P = 6.1 × 10⁻⁷), suggesting that the effect of this CRE deletion on IGLL5 expression may be generic to B-cell malignancies.
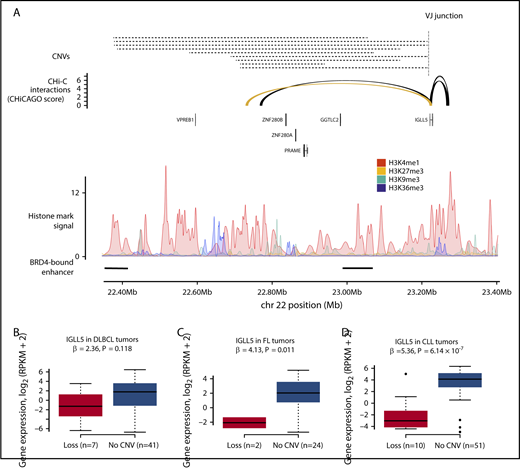
CNVs at CREs are associated with IGLL5 expression in B-cell malignancies. (A) The loss of a CRE interacting with the IGLL5 promoter. The top panel shows the position of CNVs at the CRE, all of which are losses, and the position of the VJ junction. The second panel shows chromatin looping interactions between the IGLL5 promoter and CREs, with the interaction between the promoter and the considered CRE colored yellow. The third panel details chromatin immunoprecipitation–sequencing histone mark signals in naive B cells. The bottom panel shows the positions of BRD4-bound enhancers in DLBCL.35 CNV status at CRE and gene expression in DLBCL (B) and FL (C) tumors. (D) CNV status at CRE and gene expression in secondary analysis of CLL tumors. Association between copy number status and gene expression assessed through linear regression. Boxplot hinges extend to the most extreme data points that are no more than 1.5 times the interquartile range from the box.
CNVs at CREs are associated with IGLL5 expression in B-cell malignancies. (A) The loss of a CRE interacting with the IGLL5 promoter. The top panel shows the position of CNVs at the CRE, all of which are losses, and the position of the VJ junction. The second panel shows chromatin looping interactions between the IGLL5 promoter and CREs, with the interaction between the promoter and the considered CRE colored yellow. The third panel details chromatin immunoprecipitation–sequencing histone mark signals in naive B cells. The bottom panel shows the positions of BRD4-bound enhancers in DLBCL.35 CNV status at CRE and gene expression in DLBCL (B) and FL (C) tumors. (D) CNV status at CRE and gene expression in secondary analysis of CLL tumors. Association between copy number status and gene expression assessed through linear regression. Boxplot hinges extend to the most extreme data points that are no more than 1.5 times the interquartile range from the box.
We examined whether tumors harboring CNV-positive CREs associated with target gene expression were enriched for DLBCL tumors of either the activated B-cell–like or germinal center B-cell–like cell-of-origin subtypes (supplemental Table 11; supplemental Methods). Although CD69 CRE deletions were observed exclusively in activated B-cell–like or unclassified tumors, this enrichment was nonsignificant (P = .16).
Pathways targeted by both coding and noncoding mutations in DLBCL
To better inform the interplay between noncoding driver mutations with other driver mechanisms, we identified pathways targeted by coding and noncoding mutations, combining genes identified in this analysis and genes with recurrent coding mutations from an analysis of 1001 DLBCL whole exomes6 (supplemental Table 12; supplemental Methods). One pathway identified is Notch signaling (Q = 2.1 × 10⁻⁴), which contains genes affected by coding mutations, such as CREBBP, and genes affected by noncoding mutations, such as IKZF1 and PLXND1. Other pathways affected by both coding and noncoding mutations include DNA repair, transcriptional regulation by TP53, and WNT-signaling (Q < 0.1), all of which are linked to development of B-cell lymphoma.56
Discussion
The present analysis identified putative noncoding driver mutations in B-cell lymphoma and highlighted that pathways key to lymphomagenesis can be targeted somatically through multiple mechanisms. Using promoter CHi-C, we identified recurrently mutated CREs and linked them to the genes they regulate. By adopting this strategy, our goal was to address the issue that many recurrently mutated CREs will not necessarily interact with the promoter of the proximal gene, and hence the target gene will remain unidentified. This theory is illustrated by the CREs interacting with the promoters of IGLL5 and TPRG1, neither of which interact with their proximal genes but whose mutation is associated with dysregulated expression of the respective target gene.
It has previously been shown that disruption of the Notch-signaling pathway, through coding mutations in genes such as NOTCH2 and FBXW7, confers an unfavorable prognosis in DLBCL.57 Here we add MMP14 to the list of genes in this pathway disrupted in DLBCL, the lower expression of which is similarly associated with worse survival (supplemental Table 9).
V(D)J recombinase recognizes recombination sequence signals (RSSs), which consist of conserved heptamer and nonamer elements separated by a spacer.58 We identified RSS sites adjacent to the boundaries of 11 of 49 TRA locus CNVs, 10 of 25 IGLL5 CRE CNVs, and 0 of 5 CD69 CRE CNVs (supplemental Table 13). Calling RSS sites is inherently difficult, due to some sites being less conserved and not adjacent to identified breakpoints.59 Therefore, although this analysis provides no evidence that many of the CRE-disrupting CNVs occur due to V(D)J recombination, we cannot exclude this possibility.
The present study used naive B-cell CHi-C data to characterize CREs and map them to their respective target genes. DLBCL and FL tumors develop from B cells at various stages of differentiation,1 and naive B-cell CHi-C data may therefore not fully recapitulate the regulatory interactions active in each tumor’s cell-of-origin subtype. Nevertheless, many interactions involving mutated CREs associated with differential target gene expression are also observed in total B-cell CHi-C data (supplemental Table 14),12 suggesting that these interactions may not be unique to a single stage of B-cell differentiation. These CREs are also annotated by epigenetic marks indicative of active enhancers in B cells at different differentiation stages (supplemental Figures 1-3 and 5), indicating that the activity of these CREs is not restricted to a single differentiation stage.
We acknowledge that the present analysis has limitations. First, when evaluating the effect of CRE mutations on gene expression, we considered all CRE mutations to be potential drivers. It is also possible that some CREs contain a mixture of mutations that do and do not affect gene expression, thereby reducing study power. Second, we did not consider the clonality of mutations in the differential expression analysis. Third, we did not assess whether CRE mutations affect promoter interactions or the affinity of transcription factors. CRISPR/Cas9-associated 9–based genome editing and electrophoretic mobility shift assays could be used to investigate the functional impact of these mutations.
In conclusion, our findings highlight the contribution of noncoding mutations and CNVs to B-cell lymphomagenesis and provide additional insight into the genetic complexity of B-cell lymphoma. This study further illustrates the advantages of using information from chromosome conformation capture to decode regulatory elements relevant to B-cell lymphoma.
The full-text version of this article contains a data supplement.
Acknowledgments
This research was funded by grants from Bloodwise and Cancer Research UK. The results published here are partly based on data generated by the CGCI, Non-Hodgkin Lymphoma project, developed and managed by the National Institutes of Health, National Cancer Institute. Information about CGCI projects can be found at https://ocg.cancer.gov/programs/cgci. This study used data from ICGC, processed as part of the PCAWG project. The authors thank the clinical contributors and data producers for these projects. This study also used data generated by the Blueprint Consortium. A full list of the investigators who contributed to the generation of the data are available from www.blueprint-epigenome.eu. Funding for the project was provided by the European Union's Seventh Framework Programme (FP7/2007-2013) under grant agreement no. 282510 BLUEPRINT.
Authorship
Contribution: A.J.C. and R.S.H. conceived and designed the study; A.J.C., P.H.H., S.E.D., P.J.L., D.C., and G.O. performed the bioinformatics analyses; A.J.C. performed the statistical analyses; and A.J.C. and R.S.H. wrote the manuscript, with contributions from P.H.H., D.C., and G.O.; and all authors reviewed the final manuscript.
Conflict-of-interest disclosure: The authors declare no competing financial interests.
Correspondence: Richard S. Houlston, The Institute of Cancer Research, 15 Cotswold Rd, Sutton, London SM2 5NG, United Kingdom; e-mail: richard.houlston@icr.ac.uk.

