

Key Points
Mst1 positively regulates CD19-mediated Btk signaling in B cells.
Mst1 regulates CD19 transcription through TEAD2 directly binding to the 3′UTR of cd19.

Abstract
As a key regulator of hippo signaling pathway, Mst kinases are emerging as one of the key signaling molecules that influence cell proliferation, organ size, cell migration, and cell polarity. In B lymphocytes, Mst1 deficiency causes the developmental defect of marginal zone (MZ) B cells, but how Mst1 regulates B-cell receptor (BCR) activation and differentiation remains elusive. Using genetically manipulated mouse models and total internal reflection fluorescence microscopy, we have demonstrated that Mst1 positively regulates BCR signaling via modulating CD19 transcriptional levels. Consistent with this, Mst1-deficient mice exhibited reduced BCR signaling, which is concurrent with defective BCR clustering and B-cell spreading on stimulatory lipid bilayers. The disruption of CD19-mediated Btk signaling by Mst1 deficiency leads to the severe defect in the differentiation of MZ and germinal center B cells. Mechanistic analysis showed that Mst1 upregulates the messenger RNA level of CD19 via regulating the transcriptional factor TEAD2 that directly binds to the consensus motif in the 3′ untranslated region of cd19. Overall, our results reveal a new function of Mst1 in B cells and the mechanism by which Mst1 regulates the activation and differentiation of peripheral B cells.
Introduction
CD19 is a glycoprotein that is expressed from the pre–B-cell stage to the plasma cells.1-3 CD19 knockout (KO) B cells are significantly defective in B-cell receptor (BCR) signaling and recruitment of downstream signaling molecules to the BCR, as well as cell spreading and BCR microcluster formation.4 Although CD19 KO has no effect on the bone marrow development, it significantly reduces the number of marginal zone (MZ) B cells. The differentiation and survival of MZ B cells are dependent upon a signal mediated through Btk.5 CD19 is important for the T-cell–dependent response of B cells and the formation of GC B cells.6-8 Therefore, CD19 is a key and specific protein to maintain normal B-cell function.
Mst1 has been first identified as a kinase that is homologous to yeast sterile 20 (Ste20).9 Mst1 can activate downstream kinases Lats1/2 via direct phosphorylation or the upstream signaling molecule of Lats1/2, Mob, or Sav1 indirectly.10-13 LATS1/2 in turn phosphorylate the transcriptional regulator YAP/TAZ, which inhibits YAP/TAZ.14 YAP mediates transcription regulation by partnering with TEA domain family members (TEADs).15-17 When Mst1 signaling is off, YAP/TAZ are activated and enter the nucleus, competing with VGLL4 to bind TEADs, and the YAP-TEAD complex then recruits additional factors to regulate gene transcription. Mst1-mediated phosphorylation leads to polyubiquitination and proteasome-mediated degradation YAP/TAZ. In the absence of YAP/TAZ, VGLL4 interacts with TEADs to affect target gene transcription.14 TEAD1-4 can bind to a consensus motif TGGAATGT or ACATTCCA.18-20 Mst1 is primarily expressed in lymphoid tissues.21 Recently, the function of Mst1 has been studied in T cells, and Mst1 KO mice have impaired thymic egress that leads to T-cell lymphopenia.21 However, the exact role of Mst1 in B-cell function still remains elusive. Mst1 KO mice have reduced MZ B cells within their spleens,21 and STK4 (formerly having the symbol mst1) patients with Mst1 deficiency also have a decreased number of MZ B cells as well as memory B cells.22 However, the cellular mechanism underlying the differentiation and functional defects is unknown. Whether the link between CD19 and Mst1 exists or not for B-cell function is also unknown.
This study examined the effects of Mst1 KO on the signal transduction of the BCR, which initiates B-cell activation and differentiation by using the mouse model. Our results show that Mst1 KO regulates BCR signaling by controlling the expression level of the key stimulatory coreceptor of the BCR-CD19. Through CD19, Mst1 regulates the Btk-mediated BCR signaling, which is essential for the differentiation of MZ and GC B cells.
Materials and methods
Mice and cells
Chromatin immunoprecipitation (ChIP) assay
Purified B cells underwent crosslinking for 10 minutes with 1% formaldehyde in medium. Chromatin fragments were prepared as described,25 followed by immunoprecipitation with TEAD2 Antibody (H-50): sc-67115 or rabbit immunoglobulin G (IgG; A7016; Beyotime) coupled to Dynabeads Protein G (10004D; Life Technologies) with previous protocol.26
Generation of bone marrow chimeras
Bone marrow was collected from Mst1 KO mice, and 129 Sve wild-type (WT) mice and chimera mice were made as described.27
Statistical analysis
Statistical significance was assessed using Student t test or the Mann-Whitney U test by Prism software (GraphPad Software, San Diego, CA). The P values were determined in comparison with WT or control B cells (*P < .01, **P < .001).
Results
BCR activation by soluble and membrane-associated stimuli both induce the recruitment of Mst1 to BCR microclusters
In order to determine whether Mst1 is involved in BCR activation, we chose a pseudostimulation system that can be applied as both soluble and membrane-associated forms in vitro. AF546-conjugated, monobiotinylated Fab′ fragment of goat anti-mouse IgG+M (AF546–mB-Fab′–anti-Ig) was used to label surface BCRs. Labeled BCRs were aggregated with either soluble streptavidin (sAg) or sAg tethered onto lipid bilayers (mAg). We checked the behavior of activated Mst1 using antibodies specific for its phosphorylated form after primary B cells were stimulated with sAg and mAg. Confocal microscopic (CFm) studies found that, upon sAg stimulation, pMst1 was detected at 5 minutes (Figure 1A). At 10 minutes, pMst1 was located at cell surface under BCR caps (Figure 1A). By 30 minutes, some pMst1 remained with BCR+ vesicles (Figure 1A). Consistent with these results, BCR activation significantly increased the correlation coefficient between the staining of pMst1 and the BCR at 5 minutes compared with no stimulation controls, and the correlation coefficient remained high until 10 minutes (Figure 1B). Quantification of the mean fluorescence intensity (MFI) of pMst1 using NIS-Elements AR 3.2 software showed that BCR activation increased the level of activated Mst1 over time, which peaked at 10 minutes and started to decrease afterward (Figure 1C). We checked the correlation of another BCR-associated protein, CD79α, with pMst1 and found similar results as that of BCR (supplemental Figure 1A-B). In B cells stimulated by mAg, pMst1 formed a punctate pattern for all the time points examined by using total internal reflection fluorescence microscopy (TIRFm). The activated level of Mst1 in the contact zone determined by the MFI was increased over time and peaked at 5 minutes upon mAg stimulation (Figure 1D-E). Consistent with this, the colocalization between BCR and pMst1 showed significant increases between 3 and 5 minutes, compared with no stimulation control (Figure 1F). For the nonantigenic control (transferrin), it was hard to detect the BCR clustering and pMst1 in the contact zone (Figure 1D). To obviate the difference of BCR intensity, we stained CD79α and did not observe a difference between WT and KO B cells (supplemental Figure 1C). These results suggest that BCR stimulation by sAg or mAg induces the activation of Mst1 at BCR microclusters, and the recruitment of activated Mst1 is an antigen-specific event.
![The recruitment of Mst1 to BCR aggregates in B cells stimulated by sAg or mAg. To mimic sAg, splenic B cells were incubated with AF546–mB-Fab′–anti-Ig for 10 minutes at 4°C to label the BCR. Then, the cells were incubated with either streptavidin or the medium alone (0 minutes) as a control at 37°C for varying lengths of time. After fixation and permeabilization, the cells were stained for pMst1 and analyzed using CFm (A). Images were quantitatively analyzed to determine the fluorescence intensity of cell-associated pMst1 (C) and the correlation coefficients between the labeled BCR and pMst1 (E). To mimic mAg, splenic B cells were incubated with AF546–mB-Fab′–anti-Ig tethered to lipid bilayers at 37°C for varying lengths of time. As controls, splenic B cells were labeled with AF546–Fab–anti-Ig for the BCR before incubation with biotinylated transferrin-tethered lipid bilayers. After fixation and permeabilization, the cells were stained for pMst1 and analyzed using TIRFm (B). The MFI of pMst1 (D) in the B-cell contact zone and the correlation coefficients (F) between the BCR and pMst1 were quantified using TIRFm images and NIS-Elements AR 3.2 software. Shown are representative images and mean values (± standard deviation [SD]) from 3 independent experiments where over 50 cells were individually analyzed using NIS-Elements AR 3.2 software. Scale bars, 2.5 μm. *P < .01. IRM, interference reflection microscopy; Tf, transferrin.](https://ash.silverchair-cdn.com/ash/content_public/journal/bloodadvances/1/3/10.1182_bloodadvances.2016000588/5/m_advances000588f1.png?Expires=1764955259&Signature=yL8X7l9M4kKb9wQEnwWkVuX0-b9yeSi-X0Mf85VRRD~SU~yrUwCctljOZTVTHga8zl-LhntssQR70GWfOivyCqqwXD2UHnkJABnCQYqt3j~a8jYGqeK3-hAB40LC5aFrvEW3uOPPd8sZqRUqA3sUbnv~qVElk9uo1mjr0jTy44B8PhYRDtDgeBkQxrpKSuSLCVUwxT7oxLyEaA30vYQH1zHe1u-4-3jCl~0-6BX5Eah~zJ-Qrbe7WgMxuXxeWe6KJz26Ym0Xn1ys3x-5bbJ9d3nNVrCNUtD2MAkpm2aq8khH7DZ-adZVsAkUhF~VsxEie4TtgHnP5o8gtvQnxytxvg__&Key-Pair-Id=APKAIE5G5CRDK6RD3PGA)
The recruitment of Mst1 to BCR aggregates in B cells stimulated by sAg or mAg. To mimic sAg, splenic B cells were incubated with AF546–mB-Fab′–anti-Ig for 10 minutes at 4°C to label the BCR. Then, the cells were incubated with either streptavidin or the medium alone (0 minutes) as a control at 37°C for varying lengths of time. After fixation and permeabilization, the cells were stained for pMst1 and analyzed using CFm (A). Images were quantitatively analyzed to determine the fluorescence intensity of cell-associated pMst1 (C) and the correlation coefficients between the labeled BCR and pMst1 (E). To mimic mAg, splenic B cells were incubated with AF546–mB-Fab′–anti-Ig tethered to lipid bilayers at 37°C for varying lengths of time. As controls, splenic B cells were labeled with AF546–Fab–anti-Ig for the BCR before incubation with biotinylated transferrin-tethered lipid bilayers. After fixation and permeabilization, the cells were stained for pMst1 and analyzed using TIRFm (B). The MFI of pMst1 (D) in the B-cell contact zone and the correlation coefficients (F) between the BCR and pMst1 were quantified using TIRFm images and NIS-Elements AR 3.2 software. Shown are representative images and mean values (± standard deviation [SD]) from 3 independent experiments where over 50 cells were individually analyzed using NIS-Elements AR 3.2 software. Scale bars, 2.5 μm. *P < .01. IRM, interference reflection microscopy; Tf, transferrin.
The recruitment of Mst1 to BCR aggregates in B cells stimulated by sAg or mAg. To mimic sAg, splenic B cells were incubated with AF546–mB-Fab′–anti-Ig for 10 minutes at 4°C to label the BCR. Then, the cells were incubated with either streptavidin or the medium alone (0 minutes) as a control at 37°C for varying lengths of time. After fixation and permeabilization, the cells were stained for pMst1 and analyzed using CFm (A). Images were quantitatively analyzed to determine the fluorescence intensity of cell-associated pMst1 (C) and the correlation coefficients between the labeled BCR and pMst1 (E). To mimic mAg, splenic B cells were incubated with AF546–mB-Fab′–anti-Ig tethered to lipid bilayers at 37°C for varying lengths of time. As controls, splenic B cells were labeled with AF546–Fab–anti-Ig for the BCR before incubation with biotinylated transferrin-tethered lipid bilayers. After fixation and permeabilization, the cells were stained for pMst1 and analyzed using TIRFm (B). The MFI of pMst1 (D) in the B-cell contact zone and the correlation coefficients (F) between the BCR and pMst1 were quantified using TIRFm images and NIS-Elements AR 3.2 software. Shown are representative images and mean values (± standard deviation [SD]) from 3 independent experiments where over 50 cells were individually analyzed using NIS-Elements AR 3.2 software. Scale bars, 2.5 μm. *P < .01. IRM, interference reflection microscopy; Tf, transferrin.
BCR signaling is defective in Mst1-deficient B cells
To investigate whether Mst1 is involved in BCR signaling, we first examined the effect of Mst1 deficiency on BCR signaling. By using a specific antibody for phosphotyrosine (pY) and CFm, we compared the overall level of signaling in WT and Mst1 KO B cells after stimulation by sAg. We quantified protein tyrosine phosphorylation by determining the MFI of pY staining, and the spatiotemporal relationship between pY and the BCRs by the Pearson correlation coefficient. In fresh isolated WT B cells, the levels of pY increased over time, peaking at 10 minutes and decreasing at 30 minutes (Figure 2A-B). The colocalization between pY and BCR increased over time up to 30 minutes when the BCRs were internalized (Figure 2A-C). In Mst1 KO B cells, although the level of pY was increased over time in response to stimulation, the level of pY was significantly lower than that of WT B cells (Figure 2A-B). In addition, the colocalization between pY and BCRs in Mst1 KO B cells was significantly reduced at 0, 10, and 30 minutes, compared with WT control (Figure 2A-C). To further examine the role of Mst1 in BCR signaling, we determined the effect of Mst1 deficiency on the levels of activated Btk (pBtk) and SHIP-1 (pSHIP-1), the key positive and negative signaling molecules downstream of the BCR, by using antibodies specific for their phosphorylated forms and CFm. In WT B cells, the MFI of pBtk peaked at 10 minutes, and the colocalization between BCR and Btk increased over 5 minutes and decreased by 30 minutes (Figure 2D-F). As a negative regulator of BCR signaling, the activation of SHIP-1 was later than that of Btk and the level of pSHIP-1 increased until 30 minutes in WT B cells after stimulation (Figure 2E,G-H). Furthermore, the colocalization between BCR and activated pSHIP-1 increased gradually from nonstimulation until 30 minutes (Figure 2G,I). In Mst1 KO B cells, the MFI of pBtk and pSHIP-1 was dramatically decreased compared with that in WT B cells, and BCR stimulation failed to increase the level of pBtk and pSHIP-1 (Figure 2D-E,G-H). The colocalization of BCR and pBtk or pSHIP-1 in Mst1 KO B cells was much lower than that of WT B cells (Figure 2D,F-G,I). We used phosflow and calcium assay to guarantee the reduced BCR signaling in Mst1-deficient B cells (supplemental Figure 2A-E), but we did not observe changes for the total levels of those proteins (supplemental Figure 2F). These results indicate that Mst1 positively regulates BCR signaling, probably by regulating the key positive and negative signaling molecules as well as BCR endocytosis.
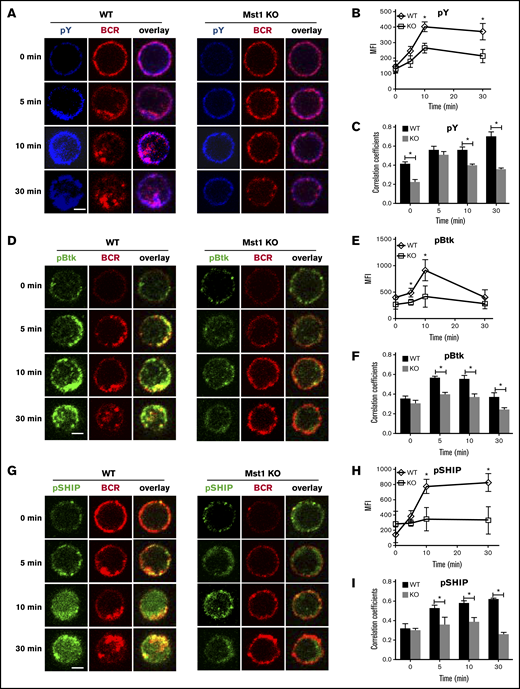
The recruitment of pY, pBtk, and pSHIP to BCR clusters in B cells stimulated by sAg is reduced in Mst1 KO B cells. Splenic B cells were incubated with AF546–mB-Fab′–anti-Ig without (−) or with sAg at 4°C, washed, and warmed to 37°C for varying lengths of time. After fixation and permeabilization, the cells were stained for pY, pBtk, and pSHIP and analyzed using CFm (A,D,G). The MIF of pY, pBtk, and pSHIP was generated using NIS-Elements AR 3.2 software (B,E,H). The Pearson’s correlation coefficients between BCR and pY, pBtk, or pSHIP staining in sAg-stimulated cells were determined using NIS-Elements AR 3.2 software (C,F,I). Shown are representative images at indicated times and the average values (±SD) of ∼50 cells from 3 independent experiments. Scale bars, 2.5 μm. *P < .01.
The recruitment of pY, pBtk, and pSHIP to BCR clusters in B cells stimulated by sAg is reduced in Mst1 KO B cells. Splenic B cells were incubated with AF546–mB-Fab′–anti-Ig without (−) or with sAg at 4°C, washed, and warmed to 37°C for varying lengths of time. After fixation and permeabilization, the cells were stained for pY, pBtk, and pSHIP and analyzed using CFm (A,D,G). The MIF of pY, pBtk, and pSHIP was generated using NIS-Elements AR 3.2 software (B,E,H). The Pearson’s correlation coefficients between BCR and pY, pBtk, or pSHIP staining in sAg-stimulated cells were determined using NIS-Elements AR 3.2 software (C,F,I). Shown are representative images at indicated times and the average values (±SD) of ∼50 cells from 3 independent experiments. Scale bars, 2.5 μm. *P < .01.
Mst1 deficiency inhibits the formation of BCR microclusters and immunological synapses
BCR aggregation and B-cell spreading are critical in the initiation of BCR signaling.28,29 Because BCR signaling was severely decreased after stimulation with sAg in Mst1 KO B cells, and to further investigate the mechanism, we first checked the Mst1 deficiency on BCR aggregation and B-cell spreading after stimulation with mAg by using TIRFm. In WT B cells, the spreading area increased fast and reached a plateau at 3 minutes, and then the contact area decreased by 7 minutes (Figure 3A,C). Coincidently, with the increase of the spreading area, the BCR aggregation determined by the MFI in the contact zone increased over time until 7 minutes (Figure 3A,C-D). However, in Mst1 KO B cells, the spreading area and BCR aggregation increased slower and significantly decreased compared with that of WT B cells (Figure 3A-D), which is consistent with the phenotype of CD19 KO mice4; we also found the reduction of pSHIP in CD19 KO B cells (supplemental Figure 2G). Please note the spreading area of Mst1 KO B cell at 7 minutes was larger than that of WT B cells, which indicates that Mst1 promotes cell contraction at a later stage (Figure 3A-C). In addition, the BCR microclusters cannot form the central BCR cluster; instead, there is a punctate pattern at 7 minutes in Mst1 KO B cells that is due to disrupted B-cell contraction (Figure 3A-C). We also checked the recruitment level of pY and pBtk in the contact zone. In WT B cells, both of them peaked at 5 minutes and decreased at 7 minutes (Figure 3A,E-F). pY and pBtk colocalized well with BCR from the early time point until 5 minutes, and pY redistributed to the outer edge of the central BCR cluster at 7 minutes (Figure 3A,G). Conversely, the recruitment level of pY and pBtk in the contact area was significantly decreased (Figure 3A-B,E-F), and the colocalization of pY and Btk with BCR was significantly decreased but increased slowly in Mst1 KO B cells until 7 minutes (Figure 3A-B,G) compared with that of WT B cells. Please note that the increased colocalization of pY and Btk with BCR is concurrent with the punctate pattern of pY in Mst1 KO B cells compared with that of WT B cells at 7 minutes (Figure 3A-B,G). We did not observe any differences for the basal levels of pY between WT and Mst1 KO B cells (Figure 3H). These results suggest that Mst1 is important for the aggregation of BCR microclusters and B-cell spreading at the early stage as well as the formation of the central BCR cluster at the end stage.
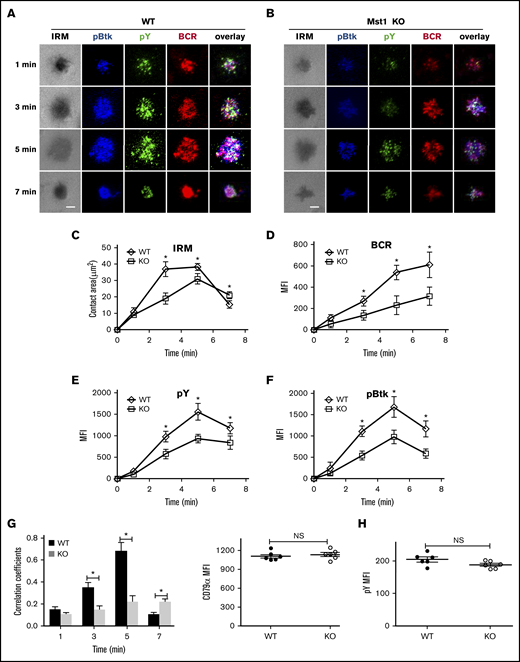
BCR cluster formation, B-cell spreading, and BCR signalsome are reduced in Mst1 KO B cells. Splenic B cells from WT and Mst1 KO mice were incubated with AF546–mB-Fab′–anti-Ig tethered to lipid bilayers at 37°C for indicated times. Cells were fixed, permeabilized, and stained for pY and pBtk using a specific monoclonal antibody and an AF405-conjugated and AF488-conjugated secondary antibody. Cells were analyzed using TIRFm. Shown are representative images (A-B) and the average values (± SD) of the B-cell contact area (C), the MFI of the BCR (D), and the MFI of the pY (E) and pBtk (F) in the contact zone. TIRFm analysis of the spatial relationship of BCR with pY and pBtk in the contact zone of splenic B cells incubated with membrane-tethered Fab′–anti-Ig. The colocalization coefficients between BCR and pY and pBtk staining were determined using NIS-Elements AR 3.2 software (G). Flow cytometry analysis of the MFI of pY (H) in WT and Mst1 KO B cells without antigen stimulation. The data were generated using 20 to 90 cells from 3 independent experiments. Scale bars, 2.5 μm. *P < .01. NS, not significant.
BCR cluster formation, B-cell spreading, and BCR signalsome are reduced in Mst1 KO B cells. Splenic B cells from WT and Mst1 KO mice were incubated with AF546–mB-Fab′–anti-Ig tethered to lipid bilayers at 37°C for indicated times. Cells were fixed, permeabilized, and stained for pY and pBtk using a specific monoclonal antibody and an AF405-conjugated and AF488-conjugated secondary antibody. Cells were analyzed using TIRFm. Shown are representative images (A-B) and the average values (± SD) of the B-cell contact area (C), the MFI of the BCR (D), and the MFI of the pY (E) and pBtk (F) in the contact zone. TIRFm analysis of the spatial relationship of BCR with pY and pBtk in the contact zone of splenic B cells incubated with membrane-tethered Fab′–anti-Ig. The colocalization coefficients between BCR and pY and pBtk staining were determined using NIS-Elements AR 3.2 software (G). Flow cytometry analysis of the MFI of pY (H) in WT and Mst1 KO B cells without antigen stimulation. The data were generated using 20 to 90 cells from 3 independent experiments. Scale bars, 2.5 μm. *P < .01. NS, not significant.
Mst1 deficiency abrogates the recruitment of CD19 to BCR aggregates
CD19 has been shown to activate Btk via the activation of PI3K. Therefore, we further investigated the molecular mechanism that Mst1 regulates BCR signaling by checking the recruitment of activated CD19 using phosphorylated antibodies after stimulation with both sAg and mAg. For the mAg stimulation, in WT B cells the recruitment of phosphorylated CD19 increased over the first 3 minutes and decreased by 7 minutes (Figure 4A,C). Similarly, the colocalization between phosphorylated CD19 and BCR also increased for the first 3 minutes and decreased by 7 minutes (Figure 4A,D). Interestingly, we found the recruitment of phosphorylated CD19 in the contact area was decreased in Mst1 KO B cells (Figure 4A-C). In addition, the colocalization between phosphorylated CD19 and BCRs was significantly decreased and did not show profound changes compared with that of WT B cells (Figure 4A-B,D). We also examined the recruitment of total CD19 in Mst1 KO B cells and found the results similar to that of pCD19. The recruitment of CD19 was reduced in the contact zone of Mst1 KO B cells (supplemental Figure 3A-C), and the colocalization between BCR and CD19 in the contact zone was also decreased compared with that of WT B cells (supplemental Figure 3D). For the sAg stimulation, in WT B cells, phosphorylated CD19 recruitment peaked at 10 minutes and decreased by 30 minutes (Figure 4E,G). The colocalization between BCR and phosphorylated CD19 increased over time until 10 minutes and decreased at 30 minutes when phosphorylated CD19 was internalized together with BCRs (Figure 4E,H). In Mst1 KO B cells, the increase of phosphorylated CD19 was subtle and significantly lower than that of WT B cells (Figure 4E-G). Moreover, the colocalization between phosphorylated CD19 and BCRs increased slower compared with that of WT B cells (Figure 4E-F,H). Interestingly, we did not observe differences for the levels of phosphorylated CD19 and correlation coefficient of BCR with phosphorylated CD19 for the early time points (0 minutes and 5 minutes) between WT and Mst1 KO B cells (Figure 4G-H), indicating sAg stimulation did not affect early BCR signaling in Mst1 KO B cells. Collectively, these results suggest that the disrupted recruitment of CD19 to the BCR aggregates due to Mst1 deficiency causes the reduced activation of Btk.
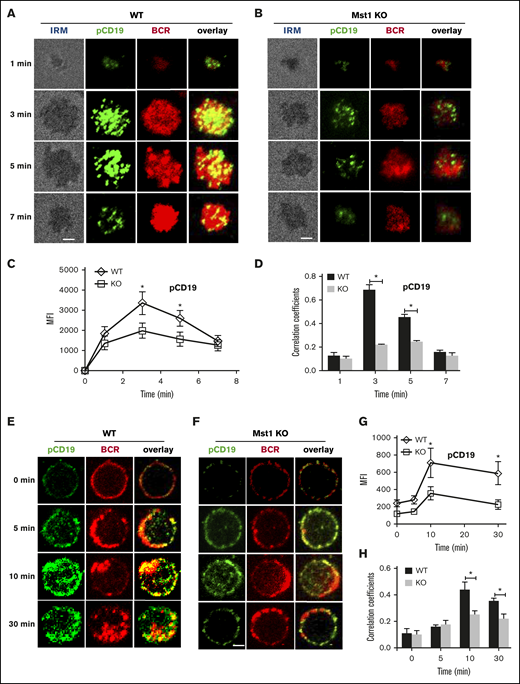
pCD19 recruitment to BCR aggregation is reduced in Mst1 KO B cells after stimulation. Splenic B cells from WT and Mst1 KO mice were incubated with AF546–mB-Fab′–anti-Ig tethered to lipid bilayers at 37°C for indicated times. Cells were fixed, permeabilized, and stained for pCD19 using a specific monoclonal antibody and AF488-conjugated secondary antibody. Cells were analyzed using TIRFm (A-B). The MFI of pCD19 staining in the B-cell contact zone was quantified (C). Shown are representative images and TIRFm analysis of the spatial relationship of BCR with pCD19 in the contact zone of splenic B cells incubated with membrane-tethered Fab′–anti-Ig. The correlation coefficients between BCR and pCD19 staining were determined using NIS-Elements AR 3.2 software (D). Splenic B cells were incubated with AF546–mB-Fab′–anti-Ig without (0 minutes) or with sAg at 4°C, washed, and warmed to 37°C for varying lengths of time. After fixation and permeabilization, the cells were stained for pCD19 and analyzed using CFm (E-F). The MIF of pCD19 was generated using NIS-Elements AR 3.2 software (G). The Pearson’s correlation coefficients between BCR and pCD19 staining in sAg-stimulated cells were determined using NIS-Elements AR 3.2 software (H). Shown are representative images at indicated times and the average values (±SD) of ∼50 cells from 3 independent experiments. Scale bars, 2.5 μm. *P < .01.
pCD19 recruitment to BCR aggregation is reduced in Mst1 KO B cells after stimulation. Splenic B cells from WT and Mst1 KO mice were incubated with AF546–mB-Fab′–anti-Ig tethered to lipid bilayers at 37°C for indicated times. Cells were fixed, permeabilized, and stained for pCD19 using a specific monoclonal antibody and AF488-conjugated secondary antibody. Cells were analyzed using TIRFm (A-B). The MFI of pCD19 staining in the B-cell contact zone was quantified (C). Shown are representative images and TIRFm analysis of the spatial relationship of BCR with pCD19 in the contact zone of splenic B cells incubated with membrane-tethered Fab′–anti-Ig. The correlation coefficients between BCR and pCD19 staining were determined using NIS-Elements AR 3.2 software (D). Splenic B cells were incubated with AF546–mB-Fab′–anti-Ig without (0 minutes) or with sAg at 4°C, washed, and warmed to 37°C for varying lengths of time. After fixation and permeabilization, the cells were stained for pCD19 and analyzed using CFm (E-F). The MIF of pCD19 was generated using NIS-Elements AR 3.2 software (G). The Pearson’s correlation coefficients between BCR and pCD19 staining in sAg-stimulated cells were determined using NIS-Elements AR 3.2 software (H). Shown are representative images at indicated times and the average values (±SD) of ∼50 cells from 3 independent experiments. Scale bars, 2.5 μm. *P < .01.
Mst1 regulates the CD19 on a transcriptional level
In order to further investigate the molecular mechanism in which step Mst1 regulates BCR signaling, we checked the messenger RNA (mRNA) level of cd19, another coreceptor of BCR-cd21 and btk in Mst1 KO B cells using real-time polymerase chain reaction (RT-PCR). The mRNA levels of cd19 in Mst1 KO B cells were decreased drastically compared with that of WT B cells (Figure 5A), but the mRNA levels of cd21 and btk were not affected in Mst1 KO B cells (Figure 5B-C). Furthermore, the total protein levels of CD19, CD21, and Btk were examined by flow cytometry and western blot. The protein levels of CD19 were decreased in Mst1 KO B cells (Figure 5D,F), but the levels of CD21 and Btk were the same compared with WT B cells (Figure 5E-F). These results collectively demonstrate that Mst1 regulates CD19 on a transcriptional level, and the reduced cd19 mRNA leads to the decreased expression of CD19. The furthest downstream transcriptional factor of Mst1 signaling pathway is TEAD, and we investigated whether TEAD regulates the transcriptional level of CD19. In order to determine which isoform of TEAD is mainly expressed in B cells, we designed RT-PCR primers (supplemental Table 1) specifically for TEAD1-4. We found TEAD2 was mainly expressed in B cells; however, it was hard to detect other isoforms of TEAD (Figure 5G). The consensus binding motif of TEAD2 is CCTGGAATGT according to previously reported results.30 We scanned 35-kb genome regions (–17 kb to +18 kb) flanking the cd19 location and found 8 consensus TEAD2-binding motifs and designed specific RT-PCR primers (supplemental Table 1). Using ChIP assay followed by quantitative PCR, we observed enrichment for the binding of TEAD2 to the cd19 3′ untranslated region (UTR) (6K) relative to the binding of isotype-matched control IgG to each locus in purified primary B cells (Figure 5H), using cyr61 as a positive control.30 In order to further confirm the direct interaction between TEAD2 and cd19 3′UTR, the promoter and 3′UTR of cd19 were cloned into pGL3-basic vector with specific primers (supplemental Table 1). Then, 293 cells were transfected with the pGL3-basic vector carrying promoter and 3′UTR or mutant of cd19 together with pcDNA3.1-tead2 and the internal control, pRL-TKB, to perform a luciferase reporter assay. We found the signal of the vector carrying cd19 3′UTR was weak and close to the negative control-pGL3-basic (Figure 5I). In contrast, the vector carrying cd19 3′UTR mutant was comparable to the positive control-pGL3-promoter (Figure 5I). These results indicate the direct interaction of TEAD2 and cd19 in vitro and that TEAD2 represses the transcription of cd19. We further investigated whether the downstream signaling molecules of Mst1 in Mst1 KO B cells were affected the same way as reported in Mst1 KO T cells.31 Primary B cells from WT and Mst1 KO mice were stimulated with or without sAg for varying lengths of time and lysed for western blot. Without sAg stimulation, the basal levels of pMob1 were decreased in Mst1 KO B cells (Figure 5J). To be consistent with the timing of the activation of Mst1, the activation levels of other downstream signaling molecules also peaked at 10 minutes in WT B cells with sAg stimulation (data not shown). Immunoblot results showed the phosphorylation of the substrate of Mst1-pMob1 was dramatically decreased in Mst1 KO B cells at 10 minutes upon stimulation with sAg compared with WT B cells as well as the further downstream molecule pYap (Figure 5J). We did not find any changes for the total levels of Mob1, Yap, and TEAD2 between WT and Mst1 KO B cells upon stimulation with sAg (Figure 5J). Furthermore, we checked the transcriptional level of several signaling molecules in Mst1 signaling pathway using RT-PCR (supplemental Table 1), and we still did not find any changes for those molecules on mRNA levels (Figure 5K-M). Taken together, these results indicate that Mst1 can positively regulate CD19 via the furthest downstream transcriptional factor, TEAD2, to directly bind to the consensus motif of cd19 in the 3′UTR.
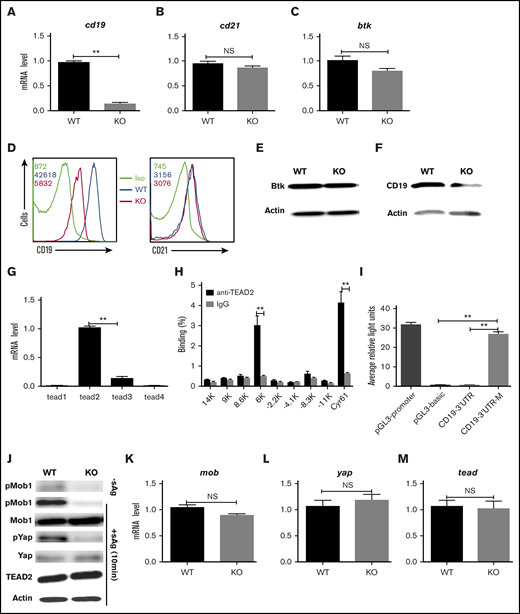
Mst1 regulates the CD19 transcriptional level. RT-PCR analysis of cd19 (A), cd21 (B), and btk (C) mRNA expression in fresh isolated B cells. Surface staining of CD19 (D) and CD21 (E) in fresh isolated B cells. Immunoblot of total Btk level in fresh isolated B cells (F). RT-PCR analysis of tead1, tead2, tead3, tead4 in fresh isolated B cells (G). Binding of TEAD2 to conserved motifs in the chr7:133 540 001-133 575 000 region (cd19 locus: chr7:133 551 962-133 558 384) in sorted CD19+ B cells from WT mice, analyzed by ChIP with antibody to TEAD2 (anti-TEAD2) or isotype-matched control antibody, IgG, followed by quantitative PCR; cyr 61 was used as a positive control (H). 293 cells were transfected with pcDNA3.1-tead2, pGL3-cd19-3′UTR, or pGL3-cd19-3′UTR-mutant and pRL-TKB (internal control) followed by luciferase reporter assay; pGL3-promoter and pGL3-basic were used as positive and negative controls (I). Splenocytes from WT and Mst1 KO mice were stimulated with or without sAg for 10 minutes followed by immunoblot of pMob1, total Mob1, pYap and total Yap, and Tead2 (J). RT-PCR analysis of mob (K), yap (L), tead2 (M) in fresh isolated splenocytes from WT and Mst1 KO mice. Shown are the representative images and results from 3 independent experiments. *P < .01, **P < .001.
Mst1 regulates the CD19 transcriptional level. RT-PCR analysis of cd19 (A), cd21 (B), and btk (C) mRNA expression in fresh isolated B cells. Surface staining of CD19 (D) and CD21 (E) in fresh isolated B cells. Immunoblot of total Btk level in fresh isolated B cells (F). RT-PCR analysis of tead1, tead2, tead3, tead4 in fresh isolated B cells (G). Binding of TEAD2 to conserved motifs in the chr7:133 540 001-133 575 000 region (cd19 locus: chr7:133 551 962-133 558 384) in sorted CD19+ B cells from WT mice, analyzed by ChIP with antibody to TEAD2 (anti-TEAD2) or isotype-matched control antibody, IgG, followed by quantitative PCR; cyr 61 was used as a positive control (H). 293 cells were transfected with pcDNA3.1-tead2, pGL3-cd19-3′UTR, or pGL3-cd19-3′UTR-mutant and pRL-TKB (internal control) followed by luciferase reporter assay; pGL3-promoter and pGL3-basic were used as positive and negative controls (I). Splenocytes from WT and Mst1 KO mice were stimulated with or without sAg for 10 minutes followed by immunoblot of pMob1, total Mob1, pYap and total Yap, and Tead2 (J). RT-PCR analysis of mob (K), yap (L), tead2 (M) in fresh isolated splenocytes from WT and Mst1 KO mice. Shown are the representative images and results from 3 independent experiments. *P < .01, **P < .001.
CD19 overexpression rescues the signaling and differentiation defects of Mst1 deficient B cells
Mst1 deficiency causes the dramatic reduction of CD19 on a transcriptional level, which leads to the disruption of MZ B cells and GC B cells. We determined whether overexpression of CD19 in Mst1 KO mice could rescue the defect of BCR signaling and differentiation of peripheral B cells. We used green fluorescent protein (GFP)-tagged retrovirus carrying the cd19 gene to transduce the bone marrow cells of Mst1 KO mice, and then transferred the bone marrow cells together with WT CD45.1 bone marrow cells at a 1:1 ratio into irradiated CD45.1 mice. By using flow cytometry, we found the expression of CD19 in Mst1 KO donor-derived GFP+ B cells transduced with cd19 gene (KO-CD19 Ov) was comparable to that of WT donor-derived GFP+ B cells transduced with retroviral vector only (WT), and much higher than that of Mst1 KO donor-derived GFP+ B cells transduced with retroviral vector only (KO) after reconstitution of bone marrow cells in CD45.1 recipient mice (supplemental Figure 4). First, we checked the effect of CD19 overexpression on the BCR clustering and B-cell spreading in Mst1 KO B cells by sorting donor-derived splenic GFP+ B cells. Interestingly, we found the B-cell spreading and BCR clustering were restored almost completely in CD45.2+GFP+ Mst1 KO B cells expressing CD19 (KO-CD19 Ov) compared with that of CD45.2+GFP+ WT B cells (WT) (Figure 6A-D). In concurrence with the restored B-cell spreading and BCR clustering, the level of pBtk was restored fully and that of pY was restored partially in the contact zone of KO-CD19 Ov B cells compared with that of WT B cells (Figure 6E-F). Furthermore, we checked whether the overexpression of CD19 can restore BCR signaling in the same way after stimulation with sAg. Not surprisingly, the level of pBtk and pY was significantly increased in KO-CD19 Ov B cells compared with that of Mst1 KO B cells and was restored to that of WT B cells (Figure 6G-J). In addition, the colocalization between pY and pBtk with BCR in KO-CD19 Ov B cells was also recovered to the level of WT B cells (Figure 6G-H,K). Moreover, the BCR internalization in KO-CD19 OV B cells was back to the normal level of WT B cells (Figure 6G-H), which indicates the disruption of BCR signaling caused by Mst1 deficiency at least partially accounts for the block of endocytosis of BCRs. Finally, we checked if the overexpression of CD19 can rescue the defect of Mst1 deficiency physiologically or not. The percentage of CD45.2 donor-derived GFP+ MZ B cells was examined as well as the number, and we found the percentage and number of MZ B cells were rescued to a large degree, although not completely in KO-CD19 OV B cells compared with that of WT B cells (Figure 6L-N). Furthermore, we immunized the recipient CD45.1 mice with NP14-OVA and checked the percentage and number of GC B cells of CD45.2 donor-derived GFP+ cells and found that the percentage and number of GC B cells were largely rescued in KO-CD19 OV B cells compared with that of WT B cells (Figure 6O-Q). Overall, the results have confirmed that Mst1 can control the CD19-mediated Btk signaling to regulate the BCR signaling, BCR endocytosis, as well as the differentiation of peripheral B cells.
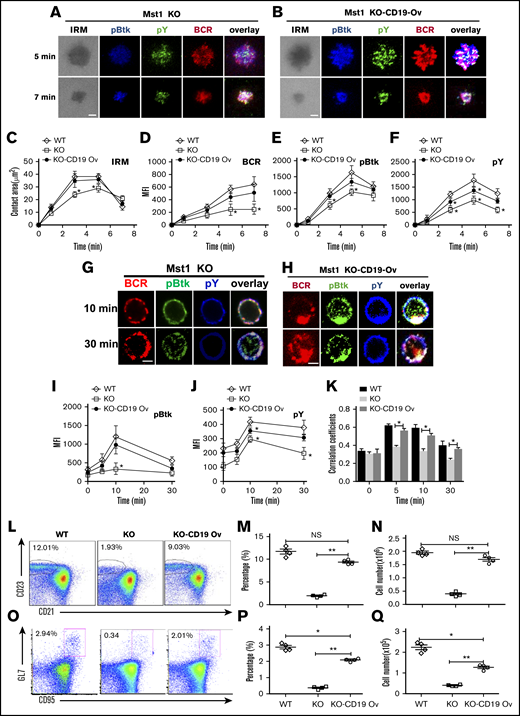
Overexpression of CD19 rescuesthe defect of Mst1 deficiency. WT bone marrow cells were transduced with GFP-tagged retroviral vector only. Mst1 KO bone marrow cells were transduced with GFP-tagged retroviral vector expressing with or without CD19, and then transferred into CD45.1 mice recipients together with CD45.1 WT bone marrow cells. After reconstitution, CD45.2 +GFP+ donor-derived splenic B cells were sorted and incubated with lipid bilayers at 37°C. Cells were fixed, permeabilized, and stained for pY and pBtk and then analyzed using TIRFm. Shown are representative images (A and B) and the average values (± SD) of the B cell contact area (C), the MFI of the BCR (D), and the MFI of the pBtk (E) and pY (F) in the contact zone. Sorted CD45.2 +GFP+ donor-derived splenic B cells were incubated with AF546–mB-Fab′–anti-Ig for 10 minutes at 4°C to label the BCR. Then, the cells were incubated with sAg at 37°C for varying lengths of time. After fixation and permeabilization, the cells were stained for pBtk and pY (G and H). The MFI of pBtk (I) and pY (J) and colocalization coefficients between BCR and pY and pBtk staining were determined using NIS-Elements AR 3.2 software (K). WT or Mst1 KO bone marrow cells were transduced with GFP-tagged retroviral vector expressing with or without CD19 and then transferred into CD45.1 mice recipients, and CD45.2 +GFP+-derived MZ B cells were analyzed by flow cytometry after bone marrow reconstitution (L). The quantification of percentage (M) and number (N) of CD45.2 +GFP+-derived MZ B cells in the spleen of WT and Mst1 KO chimera mice. WT or Mst1 KO bone marrow cells were transduced with GFP-tagged retroviral vector expressing with or without CD19 and then transferred into CD45.1 mice recipients subsequently immunized with OVA; CD45.2 +GFP+-derived GC B cells were analyzed by flow cytometry after bone marrow reconstitution (O). The quantification of percentage and number of CD45.2 +GFP+-derived GC B cells in the spleen of WT and Mst1 KO chimera mice (P-Q). Scale bars, 2.5 μm. *P < .01, **P < .001.
Overexpression of CD19 rescuesthe defect of Mst1 deficiency. WT bone marrow cells were transduced with GFP-tagged retroviral vector only. Mst1 KO bone marrow cells were transduced with GFP-tagged retroviral vector expressing with or without CD19, and then transferred into CD45.1 mice recipients together with CD45.1 WT bone marrow cells. After reconstitution, CD45.2 +GFP+ donor-derived splenic B cells were sorted and incubated with lipid bilayers at 37°C. Cells were fixed, permeabilized, and stained for pY and pBtk and then analyzed using TIRFm. Shown are representative images (A and B) and the average values (± SD) of the B cell contact area (C), the MFI of the BCR (D), and the MFI of the pBtk (E) and pY (F) in the contact zone. Sorted CD45.2 +GFP+ donor-derived splenic B cells were incubated with AF546–mB-Fab′–anti-Ig for 10 minutes at 4°C to label the BCR. Then, the cells were incubated with sAg at 37°C for varying lengths of time. After fixation and permeabilization, the cells were stained for pBtk and pY (G and H). The MFI of pBtk (I) and pY (J) and colocalization coefficients between BCR and pY and pBtk staining were determined using NIS-Elements AR 3.2 software (K). WT or Mst1 KO bone marrow cells were transduced with GFP-tagged retroviral vector expressing with or without CD19 and then transferred into CD45.1 mice recipients, and CD45.2 +GFP+-derived MZ B cells were analyzed by flow cytometry after bone marrow reconstitution (L). The quantification of percentage (M) and number (N) of CD45.2 +GFP+-derived MZ B cells in the spleen of WT and Mst1 KO chimera mice. WT or Mst1 KO bone marrow cells were transduced with GFP-tagged retroviral vector expressing with or without CD19 and then transferred into CD45.1 mice recipients subsequently immunized with OVA; CD45.2 +GFP+-derived GC B cells were analyzed by flow cytometry after bone marrow reconstitution (O). The quantification of percentage and number of CD45.2 +GFP+-derived GC B cells in the spleen of WT and Mst1 KO chimera mice (P-Q). Scale bars, 2.5 μm. *P < .01, **P < .001.
Discussion
This study examined the underlying mechanism by which Mst1 regulates BCR signaling. Our results have shown that Mst1 positively regulates BCR signaling via increasing the expression of CD19 on a transcriptional level. Mst1 deficiency causes a decreased mRNA level of CD19, consequently the reduced protein level, which leads to the reduced activation of Btk and SHIP-1. As the consequence of reduced CD19 expression in Mst1-deficient B cells, BCR clustering and B-cell spreading that is essential for BCR signaling is reduced. These results provide a new molecular mechanism by which Mst1 regulates BCR signaling.
Consistent with previously reported results,21 there is a severe reduction in MZ B cells in Mst1 KO mice. In addition to a reduced number of MZ B cells, we also found a reduction in GC B cells in immunized Mst1 KO mice. Because the reduction in MZ and GC B cells was rescued by the overexpression of CD19 in Mst1 KO B cells, our results indicate that that Mst1 regulates the generation of MZ and GC B cells by controlling the CD19-mediated Btk signaling. Our data further show the molecular mechanism by which Mst1 regulates CD19 expression. In the absence of Mst1, there will be lower levels of phosphorylation of signaling molecules downstream of Mst1, such as YAP, which protects from degradation and allows the translocation into the nucleus, where it binds and activates TEAD2. The activated transcriptional factor, TEAD2, binds to the 3′UTR consensus motif of cd19, repressing the transcriptional level of cd19. To our knowledge, this is the first report on the regulatory role of Mst1 regulating in the transcription of a critical and specific immune gene. We reveal this mechanism by demonstrating a direct binding of TEAD2 to the 3′UTR of cd19 in vitro with ChIP and luciferase reporter assay; it would be more meaningful to prove the interaction of TEAD2 with 3′UTR of cd19 in vivo or make cd19 3′UTR mutant transgenic mice to carry on further studies.
The effect of Mst1 deficiency on BCR clustering and B-cell spreading suggests that Mst1 can regulate the reorganization of actin cytoskeleton. Mst1 has been suggested to be involved in various cytoskeleton-mediated events, such as thymocyte migration and self-antigen recognition by lymphocyte function–associated antigen 1 and ICAM-1 within the medulla. We have previously shown that the actin nucleation promoting factors, Wiskott–Aldrich syndrome protein (WASP) and neural WASP (N-WASP), regulate BCR clustering and B-cell spreading by controlling actin remodeling.32,33 The inhibitory effects of Mst1 deficiency on B-cell spreading and BCR clustering indicate that Mst1 may directly or indirectly regulate actin regulators. These data implicate that Mst1 may regulate BCR-induced actin remodeling by linking the actin regulators such as WASP or N-WASP. Therefore, it is urgent to establish how Mst1 interplays with actin cytoskeleton to affect the B-cell function.
In summary, this study has revealed a new regulatory role for Mst1 in BCR signaling, which contributes to the differentiation of MZ and GC B cells. Mst1 regulates BCR signaling through controlling the transcription level of CD19 and BCR clustering and B-cell spreading. All of the studies would provide a therapeutic design for the treatment of immunodeficiency of STK4 patients.
Acknowledgments
C.L. gives heartfelt thanks to Hongbo Chi for his inculcated mentoring in his postdoctoral studies.
This work was supported by the Natural Science Foundation of China (31500709), National Basic Research Program of China (973 Program, 2013CB531506) (X. Zhou), Public Welfare Scientific Research Project of China (201402012), and startup funding from Huazhong University of Science and Technology.
Authorship
Contribution: C.L. carried out the initial analyses and drafted the initial manuscript; X.B., L.H., L.N., Y.Z., J.W., X.S., H.J., and Z.Z. performed the microscopic and flow cytometry assay; X. Zhou and H.M. designed the primers and reviewed and revised the manuscript; W.T., X. Zhou, X. Zhao, and C.L. conceptualized and designed the study and reviewed and revised the manuscript. All authors approved the final manuscript as submitted and agree to be accountable for all aspects of the work.
Conflict-of-interest disclosure: The authors declare no competing financial interests.
Correspondence: Chaohong Liu, Department of Pathogen Biology, Huazhong University of Science and Technology, 13 Hangkong Rd, Wuhan, Hubei 430030, China; e-mail: chaohongliu@hust.edu.cn; Xiaodong Zhao, Chongqing City Key Laboratory of Child Infection and Immunity, Children’s Hospital of Chongqing Medical University, No. 136, Zhongshan 2nd Rd, Yuzhong District, Chongqing 400014, China; e-mail: zhaoxd530@aliyun.com; and Xinyuan Zhou, Institute of Immunology, Third Military Medical University, Chongqing 400014, China; e-mail: xinyuanzhou@tmmu.edu.cn.

