Key Points
Plasmin YO inhibitors form extensive interactions with the prime sites, thus anchoring the TXA moiety inside the catalytic pocket.
Structural alignment analysis with urokinase and kallikrein gives insights into the molecular basis of the YO inhibitor specificity.
Abstract
The zymogen protease plasminogen and its active form plasmin perform key roles in blood clot dissolution, tissue remodeling, cell migration, and bacterial pathogenesis. Dysregulation of the plasminogen/plasmin system results in life-threatening hemorrhagic disorders or thrombotic vascular occlusion. Accordingly, inhibitors of this system are clinically important. Currently, tranexamic acid (TXA), a molecule that prevents plasminogen activation through blocking recruitment to target substrates, is the most widely used inhibitor for the plasminogen/plasmin system in therapeutics. However, TXA lacks efficacy on the active form of plasmin. Thus, there is a need to develop specific inhibitors that target the protease active site. Here we report the crystal structures of plasmin in complex with the novel YO (trans-4-aminomethylcyclohexanecarbonyl-l-tyrosine-n-octylamide) class of small molecule inhibitors. We found that these inhibitors form key interactions with the S1 and S3′ subsites of the catalytic cleft. Here, the TXA moiety of the YO compounds inserts into the primary (S1) specificity pocket, suggesting that TXA itself may function as a weak plasmin inhibitor, a hypothesis supported by subsequent biochemical and biophysical analyses. Mutational studies reveal that F587 of the S′ subsite plays a key role in mediating the inhibitor interaction. Taken together, these data provide a foundation for the future development of small molecule inhibitors to specifically regulate plasmin function in a range of diseases and disorders.
Introduction
The plasminogen (Plg)/plasmin (Plm) system plays critical roles in fibrinolysis, cellular migration,1 and cancer metastasis. Plg consists of a Pan-apple (PAp) domain, 5 kringle (KR1-5) domains, and a serine protease (SP) domain. These are arranged in a closed conformation that is maintained through interdomain interactions mediated by the canonical lysine-binding sites (LBSs) of the KR domains. The LBSs of the KRs also mediate binding of Plg to lysine-containing substrates or receptors. Once bound to substrate or receptor, Plg adopts an open conformation that can be activated to Plm by tissue plasminogen activators (tPAs) or urokinase plasminogen activators (uPAs). To control this process, active Plm released from the clot or the cell surface is rapidly inhibited by α2-antiplasmin and α2-macroglobulin.2
Currently, the Plm inhibitors aprotinin and tranexamic acid (TXA) are used clinically to manage severe hemorrhages.3-5 Aprotinin is a Kunitz-type serine protease inhibitor that cross-reacts with other proteases, including trypsin, chymotrypsin, and kallikrein,6 and is associated with severe adverse effects that limit its clinical utility. TXA is a relatively well-tolerated lysine analog that binds to the LBSs, resulting in the formation of open Plg. Once bound, TXA inhibits Plm activation by preventing it from binding to substrates and/or receptors. TXA is not thought to inhibit the activity of Plm that has already formed, the activity of which can result in catastrophic complications in patients suffering excessive blood loss.7
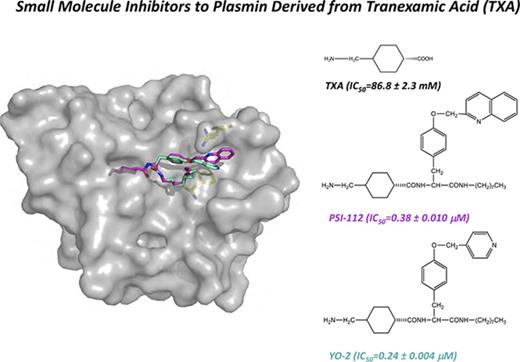
The development of Plm inhibitors remains challenging because they often cross-react with other plasma serine proteases. Some of the most specific small molecule inhibitors developed to date are the YO (trans-4-aminomethylcyclohexanecarbonyl-l-tyrosine-n-octylamide) inhibitors, a class of molecules derived from TXA8 (Figure 1). Interestingly, animal studies demonstrated that the lead compound (YO-2; trans-4-aminomethylcyclohexanecarbonyl-l-(O-picolyl)tyrosine-n-octylamide)) attenuates cell migration; metastasis in xenografts of colon carcinoma, melanoma, and T-cell lymphoma9,10 ; and blocks inflammatory cell infiltration in acute graft-versus-host disease.11 Published data revealed that YO-2 has a higher inhibitory activity for Plm than for uPA and plasma kallikrein (with a concentration that inhibits 50% of enzyme activity [IC50] of 0.53, 5.3, and 30 μM, respectively).8 However, the molecular basis for the specificity of YO inhibitors has yet to be determined.
Crystal structure of μPlm inhibitor binary complexes. Tripodal structures of (A) YO-2 along with the functional groups TXA, tyrosine (Tyr), octylamide, and pyridinylmethyl and (D) PSI-112 with the functional group quinolinylmethyl. The center panels show major interactions of (B) YO-2 and (E) PSI-112 with μPlm (supplemental Figures 1 and 4; supplemental Tables 2 and 3). YO-2 and PSI-112 are shown as sticks and colored in magenta, waters are depicted as spheres (red), and H-bonds are shown as black dotted lines. Also shown are electrostatic potential surfaces (blue, basic; red, acidic) with the 2Fo-Fc omit maps (mesh, dark gray) of (C) μPlm/YO-2 and (F) μPlm/PSI-112 with subsites marked (S1-S3 and S1′-S3′). Data collection and refinement statistics are provided in supplemental Table 1. Protein Data Bank identifiers of the complex structures are 5UGD for YO-2 and 5UGG for PSI-112.
Crystal structure of μPlm inhibitor binary complexes. Tripodal structures of (A) YO-2 along with the functional groups TXA, tyrosine (Tyr), octylamide, and pyridinylmethyl and (D) PSI-112 with the functional group quinolinylmethyl. The center panels show major interactions of (B) YO-2 and (E) PSI-112 with μPlm (supplemental Figures 1 and 4; supplemental Tables 2 and 3). YO-2 and PSI-112 are shown as sticks and colored in magenta, waters are depicted as spheres (red), and H-bonds are shown as black dotted lines. Also shown are electrostatic potential surfaces (blue, basic; red, acidic) with the 2Fo-Fc omit maps (mesh, dark gray) of (C) μPlm/YO-2 and (F) μPlm/PSI-112 with subsites marked (S1-S3 and S1′-S3′). Data collection and refinement statistics are provided in supplemental Table 1. Protein Data Bank identifiers of the complex structures are 5UGD for YO-2 and 5UGG for PSI-112.
To understand the molecular basis of the inhibitor function, we determined the X-ray crystal structure of 2 YO inhibitors (YO-2 and a second molecule called PSI-112) in complex with the SP domain of plasmin (μPlm). We found that the YO inhibitors interact with F587 and K607 of the S3′ of the catalytic site. However, mutational studies reveal that only F587 plays a key role in mediating inhibitor binding. By using nuclear magnetic resonance (NMR) spectroscopy, we showed that the TXA moiety alone interacts with the catalytic domain of Plm, and at high concentrations, it inhibits Plm activity. Finally, we analyzed structure and function data with respect to the inhibitory function in uPA and kallikrein.
Materials and Methods
Synthesis of YO-2 and PSI-112 was as described.8,12,13 DNA sequence encoding residues 543-791 of Plg were cloned into pPICZα and pSecTag2A vectors for protein expression in Pichia pastoris (Invitrogen) and Expi293 cells (Thermo Fisher Scientific), respectively. The following oligos were used for mutagenesis: F587A: 5′TTCGGCATGCACGCTTGCGGCGGCACC and 5′GGTGCCGCCGCAAGCGTGCATGCCGAA; K607A: 5′CACTGTCTGGAAGCGTCCCCCAGACCC and 5′GGGTCTGGGGGACGCTTCCAGACAGTG. The resulting mutants are catalytic functional proteases with Km largely consistent with that of the wild-type μPlm (Table 1). P pastoris–expressed μPlg was purified from the culture medium as previously described.14 μPlm was generated by treating μPlg with tPA at 37°C.
Inhibitory activity of YO compounds on binding site mutants
| μPlm binding site mutants . | Activity (Km) (μM) . | IC50 (μM) . | |
|---|---|---|---|
| YO-2 . | PSI-112 . | ||
| Wild-type | 227 ± 8.3 | 0.24 ± 0.004 | 0.38 ± 0.010 |
| F587A | 326.5 ± 9.8 | 1.15 ± 0.044 | 1.48 ± 0.037 |
| K607A | 266.6 ± 16.3 | 0.17 ± 0.006 | 0.37 ± 0.016 |
| F587A/K607A | 321.4 ± 17.7 | 1.10 ± 0.038 | 1.75 ± 0.066 |
Data are the mean and standard error derived from 3 or more independent experiments (see supplemental Data for details).
μPlm at 10 mg/mL was preincubated with YO-2 or PSI-112 before crystallization trials. Crystals were obtained in 10% (w/v) polyethylene glycol 6000, 4% (v/v) 2-methyl-2,4-pentanediol, and 0.1M 2-(N-Morpholino)ethanesulfonic acid (pH 5) at 20°C. Crystals were flash cooled in liquid N2 in the presence of 15% (v/v) glycerol.
Data sets were collected at the Australian Synchrotron and were processed, modeled, and refined as previously described.15,16 Figures were prepared by using PyMOL (www.pymol.org/). Other biophysical and biochemical studies are described in the supplemental Data.
Results and Discussion
The μPlm/YO-2 structure reveals an unexpected binding mode (Figure 1), in which the TXA moiety inserts into the S1 pocket and forms extensive canonical interactions with S736 and D735 at the base of the pocket in addition to the oxyanion hole (S741 and G739). The remainder of the inhibitor occupies the S1′-S3′ pockets, and a total of 2 additional hydrogen bonds and 57 van der Waal interactions are made between inhibitor and protease. Of note, the inhibitor forms particularly extensive interactions at the S3′ subsite where the tyrosine moiety forms a hydrogen bond with K607, and the pyridine moiety forms an imperfect face-to-face π stacking with the benzyl side chain of F587. The hydrophobic aliphatic octylamide does not have extensive interactions with the acidic S2′ site; instead, it points away from the protease. Binding of YO-2 does not have an impact on the geometry of the catalytic triad residues (H603, D646, and S741) because they remain in their catalytic conformations (Figure 1B; supplemental Figure 1). To study the role of F587 and K607 in the interaction with the YO compounds, we determined the IC50 using F587A and K607A single and double mutants (Table 1). The results reveal that although the IC50 for K607A is marginally lower than the wild-type, that for the F587A variant is much higher (four- to fivefold) than the wild-type. The IC50 for the double mutant (F587A/K607A) is similar to that of F587A. Taken together, these data suggest that F587 plays a substantive and important role in the inhibitor interaction.
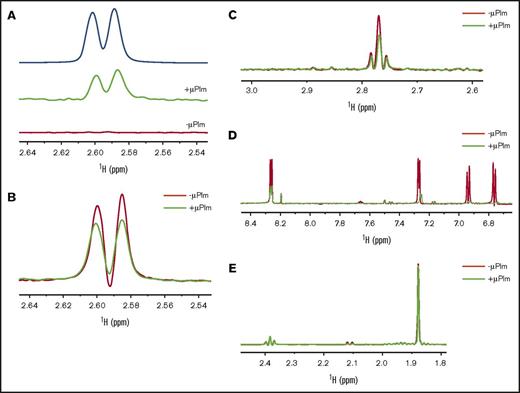
To investigate whether the lysine analog TXA alone could bind to Plm, both saturation-transfer differences NMR (STD-NMR) and Car-Purcell-Meiboom-Gill NMR (CPMG-NMR)17 were used. TXA showed positive STD signals at 2.60 and 2.58 ppm in the presence of μPlm but not in its absence (Figure 2A), which suggests that μPlm binds to TXA. The CPMG-NMR further validates this observation (Figure 2B); TXA signals were attenuated in the presence of μPlm (at 600 ms) compared with TXA alone. We also tested the binding of lysine to μPlm by CPMG (Figure 2C) in which positive CPMG signals were observed at 2.75 to 2.8 ppm from the methylene side chain in the presence of μPlm. We show the results on YO-2 and methionine as the positive and the negative controls, respectively, for the CPMG experiments (Figure 2D-E).
Inhibitor binding to Plm determined by NMR. (A) Saturation-transfer difference (STD) spectra reveal binding of TXA to μPlm. The top line (blue) shows the reference spectrum of TXA alone. The middle line (green) shows the STD signals of TXA in the presence of μPlm; positive STD signal at 2.6 and 2.58 ppm of TXA with an intensity of 5% is indicative of TXA binding to μPlm. The bottom line (red) shows the STD spectrum in the absence of μPlm; there are no signals, as expected. (B) Purcell-Meiboom-Gill (CPMG) spectra confirm binding of TXA to μPlm. TXA signals are compared in the presence (green) and absence (red) of μPlm. TXA binding to μPlm is indicated by the reduction in peak intensity in the presence of μPlm. (C) CPMG spectra of lysine. The ligand signals in the presence of μPlm (green) at 2.8 to 2.75 ppm are attenuated, which indicates binding. (D) CPMG spectra of YO-2 as a positive control. The binding of the μPlm (green) leads to a reduction of signals and also a shift of the signal at 7.25, 6.94, and 6.75 ppm, which indicates strong binding of YO-2 to μPlm. (E) CPMG spectra of methionine as a negative control. In the presence of μPlm (green), the change of the intensity is insignificant, suggesting that methionine does not bind to μPlm.
Inhibitor binding to Plm determined by NMR. (A) Saturation-transfer difference (STD) spectra reveal binding of TXA to μPlm. The top line (blue) shows the reference spectrum of TXA alone. The middle line (green) shows the STD signals of TXA in the presence of μPlm; positive STD signal at 2.6 and 2.58 ppm of TXA with an intensity of 5% is indicative of TXA binding to μPlm. The bottom line (red) shows the STD spectrum in the absence of μPlm; there are no signals, as expected. (B) Purcell-Meiboom-Gill (CPMG) spectra confirm binding of TXA to μPlm. TXA signals are compared in the presence (green) and absence (red) of μPlm. TXA binding to μPlm is indicated by the reduction in peak intensity in the presence of μPlm. (C) CPMG spectra of lysine. The ligand signals in the presence of μPlm (green) at 2.8 to 2.75 ppm are attenuated, which indicates binding. (D) CPMG spectra of YO-2 as a positive control. The binding of the μPlm (green) leads to a reduction of signals and also a shift of the signal at 7.25, 6.94, and 6.75 ppm, which indicates strong binding of YO-2 to μPlm. (E) CPMG spectra of methionine as a negative control. In the presence of μPlm (green), the change of the intensity is insignificant, suggesting that methionine does not bind to μPlm.
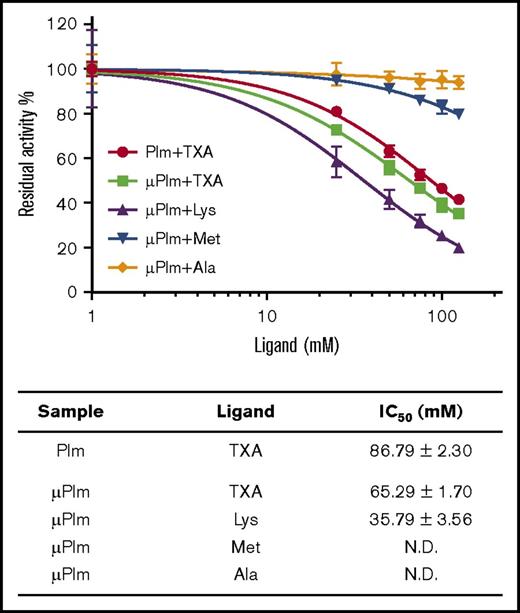
Next, we investigated the impact of TXA (at concentrations between 0 and 125 mM) on Plm and μPlm enzyme activity. Inhibition was observed for both enzymes at high concentrations (>10 mM; Figure 3). Although the inhibitory activity is weak (IC50, 86.79 ± 2.30 mM for Plm; IC50, 65.29 ± 1.70 mM for μPlm), these data suggest that TXA may function as an active site inhibitor in vivo when high doses (grams) are administered to patients.7
Inhibition of Plm enzyme activity by TXA and lysine. High concentration of TXA inhibits Plm activity. The enzyme assay was performed on both μPlm and Plm using the chromogenic substrate S2251. (Top panel) Activities of μPlm and Plm are shown as normalized residual activity of the initial rate and are attenuated in the presence of increasing concentration of TXA (0-125 mM), suggesting that TXA is also a weak active site inhibitor. Similar response was observed when lysine was tested but not with alanine as expected. Interestingly, at 100 mM, methionine inhibits up to 20% of the Plm activity. (Bottom panel) Also shown are the IC50 of TXA and lysine (Lys) on Plm activity derived from the experiment; that of methionine (Met) and alanine (Ala) is too low to be determined. See supplemental Data for details. N.D., not determined.
Inhibition of Plm enzyme activity by TXA and lysine. High concentration of TXA inhibits Plm activity. The enzyme assay was performed on both μPlm and Plm using the chromogenic substrate S2251. (Top panel) Activities of μPlm and Plm are shown as normalized residual activity of the initial rate and are attenuated in the presence of increasing concentration of TXA (0-125 mM), suggesting that TXA is also a weak active site inhibitor. Similar response was observed when lysine was tested but not with alanine as expected. Interestingly, at 100 mM, methionine inhibits up to 20% of the Plm activity. (Bottom panel) Also shown are the IC50 of TXA and lysine (Lys) on Plm activity derived from the experiment; that of methionine (Met) and alanine (Ala) is too low to be determined. See supplemental Data for details. N.D., not determined.
We also found that, like TXA, lysine itself inhibits μPlm activity with an IC50 of 35.79 ± 3.56 mM. In contrast, methionine and alanine showed minimal reductions of Plm activity, even at 125 mM (<20% and 5%, respectively; Figure 3).
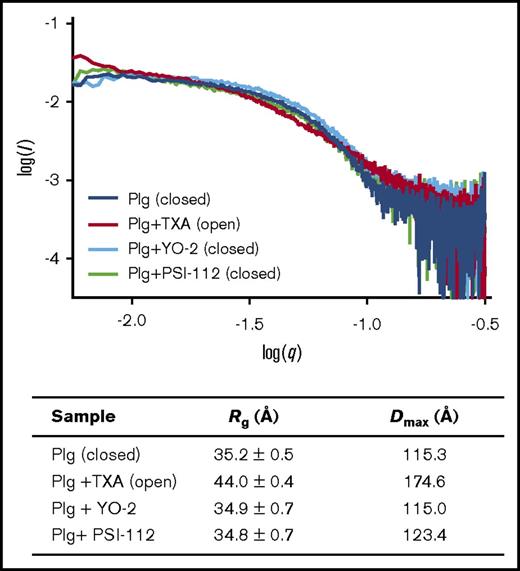
We next investigated whether YO could trigger a conformational change in closed Plg as seen with TXA. Here we used small-angle X-ray scattering (SAXS); the scattering profile of closed Plg is distinctively different from the open form (supplemental Figure 2) as depicted by the derived radius of gyration (Rg) and maximum dimension of Plg in solution (Dmax) (Figure 4). The SAXS data revealed that in the presence of YO inhibitors, full-length Plg remained in the closed form, suggesting that the YO inhibitors are unlikely to interact with the LBSs of Plg or Plm.
Impact of YO compounds on Plg conformation. (Top panel) SAXS experiment shows that YO inhibitors do not have an impact on the conformation of full-length Plg. In the presence of TXA (1 mM), Plg switches from the closed (Plg) to the open conformation (Plg + TXA), as reflected by the change in the scattering profile (shape of the curve; supplemental Figure 2). The profile of Plg remains unaltered after incubating with YO inhibitors (Plg + YO-2 and Plg + PSI-112) as detailed in supplemental Data, suggesting that the YO inhibitors cannot trigger conformational change of Plg and therefore, they do not interact with the LBS of KR domains. The SAXS profiles shown are the average of >15 individual images. (Bottom panel) Shown are the radius of gyration (Rg) and maximum dimension of Plg in solution (Dmax) derived from the experiment (see supplemental Data and supplemental Figure 2 for details). Both Rg and Dmax of closed and open Plg are significantly different (P < .0001).
Impact of YO compounds on Plg conformation. (Top panel) SAXS experiment shows that YO inhibitors do not have an impact on the conformation of full-length Plg. In the presence of TXA (1 mM), Plg switches from the closed (Plg) to the open conformation (Plg + TXA), as reflected by the change in the scattering profile (shape of the curve; supplemental Figure 2). The profile of Plg remains unaltered after incubating with YO inhibitors (Plg + YO-2 and Plg + PSI-112) as detailed in supplemental Data, suggesting that the YO inhibitors cannot trigger conformational change of Plg and therefore, they do not interact with the LBS of KR domains. The SAXS profiles shown are the average of >15 individual images. (Bottom panel) Shown are the radius of gyration (Rg) and maximum dimension of Plg in solution (Dmax) derived from the experiment (see supplemental Data and supplemental Figure 2 for details). Both Rg and Dmax of closed and open Plg are significantly different (P < .0001).
Finally, we determined the crystal structure of a second YO class inhibitor, PSI-112. The μPlm/PSI-112 binary complex structure further confirms the binding mode of the YO inhibitors (Figure 1E-F; supplemental Figures 1 and 3). Here, the double aromatic ring quinoline moiety of PSI-112 rotates to the side and upward (by ∼54° and ∼35°, respectively; supplemental Figure 1) compared with the pyridine moiety in YO-2. Consequently, the pyridine ring of the quinoline moiety forms a perfect face-to-edge π stack with the benzyl side chain of F587. The electron density map also reveals discrete disorder around the quinoline moiety and K607, suggesting a number of different possible binding modes between PSI-112 and K607.
Analysis of the interactions of PSI-112 with mutants of μPlm further confirmed our previous findings for YO-2 (Table 1). Our data revealed that K607A has an IC50 similar to that of the wild-type, whereas those of the mutants F587A and F587A/K607A are much higher, approximately fivefold that of the wild-type. Together, these data confirm that F587 plays a key role in the inhibitor interaction.
Our results (Table 1) further show that, in contrast to published findings,13 the IC50 for PSI-112 (0.38 ± 0.020 μM) is 35% higher than that of YO-2 (0.25 ± 0.001 μM). However, given that PSI-112 has a lower affinity for uPA (IC50 >25 μM) than YO-2 (IC50 3.99 ± 0.2 μM; supplemental Figure 3), it is still a more specific inhibitor than YO-2 for Plm.
By using the 2 structures, we next investigated the structural basis for the specificity of the inhibitors for Plm over uPA and plasma kallikrein. Superposition of the Plm/YO complex structures with uPA (Protein Data Bank identifier 4JNI) reveals that substitution of several residues in uPA may interfere with effective binding of the inhibitors. First, the key residue F587 is substituted by V41 in uPA; we argue that this change may explain the reduced IC50. However, the equivalent position to K607 is Y60 in uPA. We reason that the Y60 may play the key role in coordinating the pyridine moiety of YO-2. Conversely, the quinoline moiety of PSI-112 would clash with Y60 (supplemental Figure 4B) and also the side chain of R35. Together, these data provide a rationale for the reduced activity of PSI-112 against uPA in contrast to the YO-2/uPA complex (Figure 1).
YO inhibitors are ineffective against plasma kallikrein in enzyme assays. Superposition analysis suggests that the lower activity of the YO inhibitors against kallikrein may also arise through the S3′ pockets. Specifically, F587 and K607 are substituted by L41 and G60, respectively. We reason that the aromatic moiety of the YO inhibitor would not be able to form π stacking interactions with either amino acid, thus resulting in poor binding of YO inhibitor to kallikrein (supplemental Figure 4C).
Taken together, these data reveal a number of features that could be exploited to improve both the activity and specificity of the YO inhibitors. Most notably, we suggest that substitutions of the hydrophobic aliphatic octylamide moiety with basic groups would better take advantage of the extensive acidic S2′ pocket. Furthermore, inhibitors with moieties that bind to the S2-S4 pocket may provide further chemical opportunities to refine specificity and activity. Such highly specific and efficacious small molecule inhibitors would be of great value in clinical applications in which specific inhibition of Plm activity is required.
The full-text version of this article contains a data supplement.
Acknowledgments
This work was supported by fellowships from the Australian National Health and Medical Research Council to R.S.N. and J.C.W.
Authorship
Contribution: R.H.P.L. and G.W. designed and conducted the study and cowrote the manuscript; K.H. and Y.T. produced and provided critical reagents; A.J.Q. provided input on design and conducted SAXS experiments; T.T.C.-D. provided input on design of structural studies; D.J. conducted protein trial expression experiments; P.J.C. provided input on design of experiments; E.W.W.L. and R.S.N. provided input on design and conducted NMR experiments; N.M.K. provided input on SAXS studies; and J.C.W. provided input on study design and cowrote the manuscript.
Conflict-of-interest disclosure: The authors declare no competing financial interests.
Correspondence: Ruby H. P. Law, Department of Biochemistry and Molecular Biology, Monash University, Clayton, VIC 3800, Australia; e-mail: ruby.law@monash.edu; and James C. Whisstock, Department of Biochemistry and Molecular Biology, Monash University, Clayton, VIC 3800, Australia; e-mail: james.whisstock@monash.edu.
References
Author notes
R.H.P.L. and G.W. contributed equally to this work.


