Key Points
Accumulation of defective depolarized mitochondria affects all T-cell subsets in CLL and is exacerbated during disease progression.
Ex vivo reprogramming of CLL T-cell mitochondrial activity enhances CAR T-cell efficacy and persistence in an immunocompetent murine model.
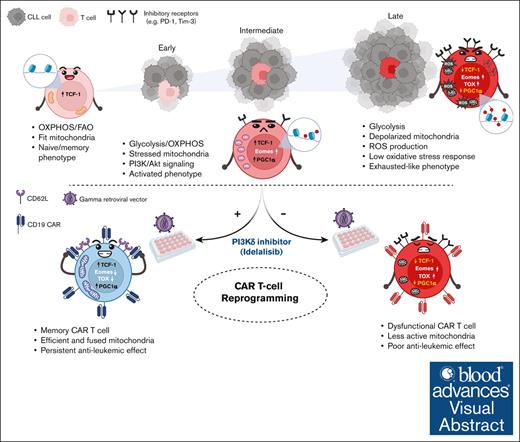
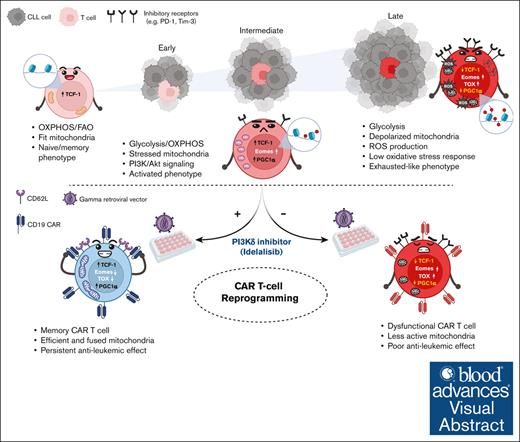
Visual Abstract
Created in BioRender. Gamal, W. (2025) https://BioRender.com/f82z772
Created in BioRender. Gamal, W. (2025) https://BioRender.com/f82z772
An unmet clinical need in chronic lymphocytic leukemia (CLL) is emerging due to the rapidly expanding group of patients with double refractory (Bruton's tyrosine kinase- and B-cell lymphoma 2-inhibitor) disease. So far, autologous T-cell–based therapies, including chimeric antigen receptor (CAR) T cells, have limited success in CLL, which has been attributed to an acquired CLL-mediated T-cell dysfunction and subset skewing toward effector cells at the expense of memory formation. T-cell responses rely on dynamic metabolic processes, particularly mitochondrial fitness. Although mitochondrial disruptions have been observed in solid tumor–infiltrating lymphocytes, their impact on T-cell immunity in lymphoproliferative disorders is unknown. Recent findings indicate that mitochondrial mass in CAR T cells correlates with CLL clinical outcomes. This prompted our investigation into the mitochondrial fitness in CLL T cells. Integrated metabolic and functional analyses revealed impaired, depolarized mitochondria across all T-cell subsets in untreated patients with CLL, leading to further ex vivo and in vivo mouse studies on the underlying signaling alterations. Multiomics profiling of transcriptome and epigenome revealed significant alterations in mitochondrial signaling, diminished adenosine monophosphate-activated protein kinase and autophagy activity, and upregulated glycolysis coupled with hyperactivation of Akt. Inhibition of the phosphatidylinositol 3-kinase (PI3K)/Akt pathway during CLL T-cell culture induced metabolic reprogramming, enhancing mitochondrial activity, expression of peroxisome proliferator-activated receptor-gamma coactivator 1-alpha, and memory differentiation. Underscoring clinical relevance, supplementation with the PI3Kδ inhibitor idelalisib during CAR T-cell manufacturing improved persistence and long-term leukemia-free remissions in an immunocompetent murine model. Our study suggests that modulating the abnormal CLL T-cell metabolism can enhance the efficacy of autologous T-cell therapies.
Introduction
Chimeric antigen receptor (CAR) T cells have been practice changing in aggressive B-cell malignancies,1,2 yet the complete response rate in chronic lymphocytic leukemia (CLL) is limited to 20%.3 This limited response is attributed to the acquired T-cell dysfunction involving skewed differentiation toward effector phenotypes, impaired immune synapse formation, decreased proliferation, and cytotoxicity.4-8 Although solid tumor–infiltrating lymphocytes (TILs) are subject to exhaustion with distinct transcriptional and epigenetic signatures induced by chronic antigen exposure,9-11 CLL T-cell abnormalities diverge from classical exhaustion as they retain cytokine production,5 suggesting a unique dysfunctional state.
T-cell differentiation is energy demanding and heavily influenced by metabolic restrictions within the tumor microenvironment. Thus, TIL exhaustion is associated with metabolic impairments including disrupted glucose metabolism, mitochondrial dysfunction and defective mitophagy.12,13 Although T-cell metabolic dysfunction in CLL remains unclear, we previously identified altered mitochondrial metabolism dependent on CLL-cell interactions, with higher mitochondrial mass linked to better CAR T-cell therapy responses.14,15 However, the link between metabolic disturbances and specific T-cell phenotypes, as well as the molecular mechanisms, including epigenetics, regulating T-cell metabolism in CLL, remain unknown.
Phosphatidylinositol 3-kinase (PI3K)/Akt is a key signaling pathway regulating T-cell metabolism after antigen recognition.16 In adoptive cell therapy (ACT), ex vivo T-cell stimulation strongly induces PI3K/Akt signaling,17 eventually promoting terminal differentiation. Ex vivo PI3K/Akt inhibition has been shown to enhance T-cell memory and metabolic fitness,18 promoting cell survival and antitumor efficacy of ACT in solid tumor models.18-21 These studies focused on naïve antigen-specific T cells, a population which is minor in CLL due to skewed T-cell differentiation. Inhibiting PI3K in T cells from patients with CLL has been shown to improve CAR T-cell outcomes, with a suggested link to metabolic activity.22,23 However, the use of immunocompromised models in these previous studies significantly limited relevance to CLL, which strongly depends on microenvironmental interactions.
The Eμ-TCL1 murine model mirrors the skewed T-cell differentiation in patients,24 however, it had not been previously validated for metabolic studies. Herein, we validated the model to recapitulate our previous findings in patients with CLL. Concurrently, we conducted in-depth profiling of patient samples to specify T-cell metabolic dysfunctions further. Our analysis revealed novel metabolic dysregulations tied to CLL progression, including autophagy and AMP-activated protein kinase (AMPK) signaling linked to abnormalities in PI3K signaling in Eμ-TCL1 T cells. These findings correlated with changes in key transcription factors (TFs; thymocyte selection-associated high mobility group box protein [TOX], T-box expressed in T cells [Tbet], eomesodermin [Eomes], and T-cell factor 1 [TCF-1]). This validation enabled us to use the Eμ-TCL1 model for the first time to our knowledge to optimize an ex vivo ACT protocol, reprogramming the metabolic and differentiation plasticity of CLL T cells using the PI3Kδ inhibitor idelalisib. The approach yielded persistent CAR T-cell products with significant antileukemic activity in immunocompetent mice, establishing the Eμ-TCL1 model as a valuable tool for CAR T-cell validation.
Methods
Full details can be found in supplemental Methods.
Cell culture of primary patient material
Peripheral blood mononuclear cells from untreated patients with CLL or age-matched healthy donors (HDs) were examined at baseline or after in vitro culture. T-cell activation was performed using anti-CD3/anti-CD28 soluble antibodies for 48 hours or 10 days. In certain experiments, isolated T cells were treated with idelalisib (5 μM; Selleckchem) 2 hours after activation and replenished every 2 to 3 days.
Eμ-TCL1 adoptive transfer (AT) mouse model
To induce CLL, 10 × 106 to 25 × 106 leukemic splenocytes were isolated from aged Eμ-TCL1 transgenic mice (aged >8 months with >70% peripheral CD5+ B cells) and IV injected into female syngeneic C57BL/6 mice (aged 6-8 weeks).
Eμ-TCL1 cell preparation and culture
Submandibular blood was collected from mouse cohorts. Splenocyte single-cell suspensions were prepared by mechanically homogenizing spleens. After washing and red blood cell lysis, cells were used for flow cytometry or T-cell isolation. T-cell activation was done using anti-CD3/anti-CD28 dynabeads (ThermoFisher) and 60 IU/mL recombinant human interleukin 2 (PeproTech) for the indicated time. For drug treatment, indicated concentration of idelalisib was added to T cells 1 to 2 hours after activation and replenished every 2 to 3 days.
Mitochondrial assessments by flow cytometry
For measuring mitochondrial membrane potential, biomass, and reactive oxygen species (ROS), cells were probed with 12.5- to 25-nM MitoTracker Orange CMTMRos (Thermo Fisher) or tetramethylrhodamine methyl ester (TMRM; Thermo Fisher), 5- to 50-nM MitoTracker Green (MTG) FM (Cell Signaling), or 2.5 μM MitoSOX (Thermo Fisher), respectively, in complete Roswell Park Memorial Institute 1640 (Corning) or 1× Hanks' balanced salt solution (Gibco) medium at 37°C and 5% CO2 for 15 to 45 minutes. After mitochondrial probing, cells were stained with viability dye and surface antibodies.
Transmission electron microscopy
Transmission electron microscopy analyses were conducted at the Lisa Muma Weitz Microscopy Core, University of South Florida, using JEOL 1400 transmission electron microscope. Resting CD8+ T cells were negatively selected using the EasySep isolation kit (STEMCELL Technologies), fixed, dehydrated, and embedded in resin. Ninety-nanometer thick sections were collected on copper grids and stained with 2% uranyl acetate aqueous solution (Electron Microscopy Sciences) for 10 minutes.
Molecular analyses
Flow cytometry, western blotting, NanoString, and the assay for transposase-accessible chromatin with sequencing (ATAC-seq) are detailed in supplemental Methods.
Seahorse analysis
AT Eμ-TCL1 CD8+ T cells were harvested 5 to 6 days after in vitro activation. CLL and HD T cells were collected from peripheral blood mononuclear cells after 48 hours with/without stimulation or from isolated T-cell cultures after 10-day stimulation with/without idelalisib. Isolated T cells were plated on poly-D-lysine–coated Seahorse plates. Oxygen consumption rate (OCR) and extracellular acidification rate (ECAR) in response to oligomycin, FCCP (mouse)/BAM15 (human), and rotenone/antimycin A were measured using the Agilent XFe96 or XF HS mini extracellular flux analyzer.
Statistical analysis
Data were analyzed using GraphPad Prism software version 10.1.2 and presented as mean ± standard deviation or standard error of the mean. For 2-group comparisons, paired or unpaired 2-tailed Student t test was performed. For multiple-group analysis, 2-way or 1-way analysis of variance (ANOVA) test was performed, followed by Tukey or Sidak multiple comparisons test with matched data. Log-rank (Mantel-Cox) test was used for survival comparison in mice. P value <.05 was considered statistically significant.
Results
T cells from patients with CLL display an accumulation of defective depolarized mitochondria
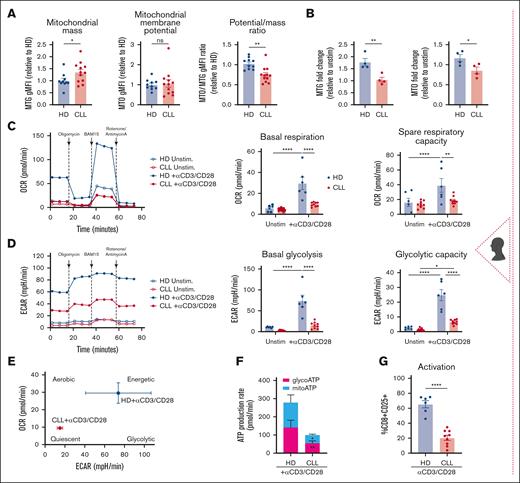
Mitochondrial mass and membrane potential are crucial for T-cell metabolic adaptation during differentiation,25 with abnormalities linked to T-cell dysfunction in solid tumors.12,13 Compared with age-matched HDs, CLL CD8+ T cells displayed increased mitochondrial mass (MitoTracker Green, MTG) but unchanged membrane potential (MitoTracker Orange, MTO) and reduced potential-to-mass ratio, indicating mitochondrial depolarization and dysfunction13 (Figure 1A). Unlike HD cells, T-cell receptor (TCR)-stimulated CLL T cells failed to increase mitochondrial mass and membrane potential (Figure 1B) and showed reduced basal OCR, a direct readout of mitochondrial oxidative phosphorylation, and spare respiratory capacity (SRC), a measure of mitochondrial ability to respond to increased energy demand (Figure 1C). Glycolysis, measured by ECAR, was decreased in both basal and oligomycin-inhibited conditions (glycolytic capacity; Figure 1D). Consequently, stimulated CLL T cells displayed a quiescent metabolic phenotype (Figure 1E), reduced glycolytic and mitochondrial adenosine triphosphate (ATP) production, and decreased activation (Figure 1F-G).
The Eμ-TCL1 murine model recapitulates the T-cell mitochondrial dysfunction found in patients with CLL
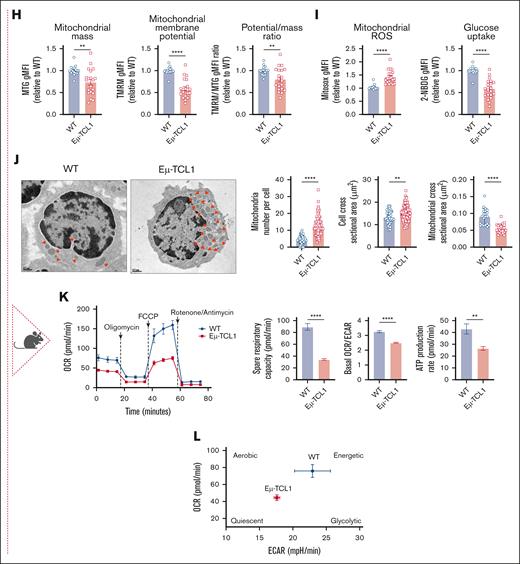
Using the AT Eμ-TCL1 murine model,26 we found that CD8+ T cells exhibited reduced mitochondrial mass and membrane potential (measured by TMRM), alongside mitochondrial depolarization (low TMRM:MTG ratio) and increased ROS levels (Figure 1H-I; supplemental Figure 1A). Glucose uptake capacity was significantly diminished (Figure 1I), particularly in the spleen and peripheral blood (supplemental Figure 1B). Electron microscopy revealed smaller but more abundant mitochondria than in wild-type (WT) cells (Figure 1J), potentially indicating increased mitochondrial fission activity, a metabolic feature of effector T cells,27 and/or impaired mitophagy causing an accumulation of dysfunctional mitochondria.28 Consistent with human data, Eμ-TCL1 T cells showed decreased mitochondrial OCR and SRC upon ex vivo activation (Figure 1K), indicative of a quiescent metabolic phenotype (Figure 1L). Moreover, the OCR:ECAR ratio decreased, suggesting increased reliance on glycolytic metabolism. Collectively, our human and murine findings suggest defective mitochondrial function in CLL T cells both at baseline and after in vitro TCR activation.
CLL progression drives the T-cell transcriptional program toward an exhausted-like phenotype
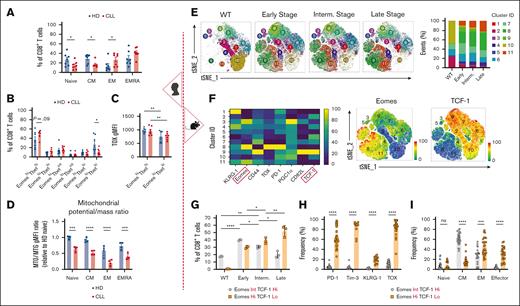
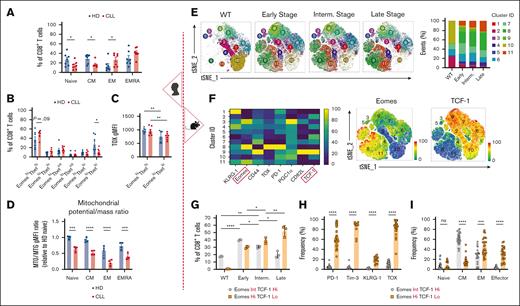
Although some studies have explored transcriptional dysregulation in CLL T cells,29-31 further research is needed to link it to T-cell metabolic reprogramming. Phenotypical and TF profiling demonstrated a shift toward an effector phenotype in T cells of patients with CLL (Figure 2A; supplemental Figure 1C), consistent with previous reports,32,33 with increased EomeshiTbethi (effector memory [EM] and terminally differentiated EM phenotypes [EMRA]) and decreased EomesloTbetlo (central memory [CM]) populations (Figure 2B; supplemental Figure 1D). Higher TOX expression, indicating exhaustion, was noted in the EomeshiTbethi population of both HD and CLL T cells (Figure 2C). Mitochondrial depolarization was observed in differentiated T-cell subsets in both HD and CLL T cells, and it was significantly more pronounced in CLL than in HD in all subsets (Figure 2D).
CLL progression drives T-cell transcriptional program toward an exhausted-like phenotype. Analysis of patient samples (left section, A-D). (A) Quantification of CD8+ T-cell memory subsets at baseline in HD and CLL PBMCs, based on the surface expression of CD45RA and CD27: naïve, CD45RA+CD27+; central memory (CM), CD45RA–CD27+; effector memory (EM), CD45RA–CD27–; and terminally differentiated EM (EMRA), CD45RA+CD27–. (B) Quantification of CD8+ T-cell subsets based on Tbet and Eomes expression in HD and CLL. (C) TOX expression levels within the EomeshiTbethi and EomesloTbetlo populations. (D) Ratio of mitochondrial membrane potential to mitochondrial mass (MTO:MTG) within naïve, CM, EM, and EMRA CD8+ T-cell subsets in samples from HDs and patients with CLL. Analysis of murine samples (right section, E-I). (E) Flow cytometry t-distributed stochastic neighborhood embedding (tSNE) and Xshift clustering analyses of splenic CD8+ T cells from WT or AT Eμ-TCL1 mice at different disease stages (left) with the quantification of the frequency of each cluster (right). (F) Expression levels of surface markers (PD-1, KLRG-1, CD44, and CD62L), TFs (Eomes, TOX, and TCF-1), and transcription coactivator (PGC1α) used in the tSNE analysis (left). Distinct expression of Eomes and TCF-1 within major clusters is shown (right). (G) Quantification of CD8+ T-cell populations in WT and at different disease stages based on the expression levels of Eomes and TCF-1. Quantitative results of exhaustion-related markers expression (H) and memory phenotypes:naïve, CD44–CD62L+; CM, CD44+CD62L+; EM, CD44+CD62L–; and effector, CD44–CD62L–. (I) within the Eμ-TCL1 T-cell Eomes/TCF-1 gates mentioned in panel G. Data are cumulative results from ≥3 experiments in panels H-I or representative of 3 independent experiments in panels E-G. Experiments were replicated using intermediate (interm)- and late-stage AT Eμ-TCL1 mice. Each symbol represents an individual animal in panels G-I. Data are presented as mean ± SEM in panels A-C,H-I; or mean ± SD in panels D,G. Differences were analyzed using a 2-way ANOVA with Sidak multiple correction test in panels A-D,G; or a 2-tailed, unpaired t test in panels H-I. ∗P < .05; ∗∗P < .01; ∗∗∗P < .001; ∗∗∗∗P < .0001. AT, adoptive transfer; gMFI, geometric mean fluorescence intensity; ns, non-significant; PBMCs, peripheral blood mononuclear cells; TFs, transcription factors.
CLL progression drives T-cell transcriptional program toward an exhausted-like phenotype. Analysis of patient samples (left section, A-D). (A) Quantification of CD8+ T-cell memory subsets at baseline in HD and CLL PBMCs, based on the surface expression of CD45RA and CD27: naïve, CD45RA+CD27+; central memory (CM), CD45RA–CD27+; effector memory (EM), CD45RA–CD27–; and terminally differentiated EM (EMRA), CD45RA+CD27–. (B) Quantification of CD8+ T-cell subsets based on Tbet and Eomes expression in HD and CLL. (C) TOX expression levels within the EomeshiTbethi and EomesloTbetlo populations. (D) Ratio of mitochondrial membrane potential to mitochondrial mass (MTO:MTG) within naïve, CM, EM, and EMRA CD8+ T-cell subsets in samples from HDs and patients with CLL. Analysis of murine samples (right section, E-I). (E) Flow cytometry t-distributed stochastic neighborhood embedding (tSNE) and Xshift clustering analyses of splenic CD8+ T cells from WT or AT Eμ-TCL1 mice at different disease stages (left) with the quantification of the frequency of each cluster (right). (F) Expression levels of surface markers (PD-1, KLRG-1, CD44, and CD62L), TFs (Eomes, TOX, and TCF-1), and transcription coactivator (PGC1α) used in the tSNE analysis (left). Distinct expression of Eomes and TCF-1 within major clusters is shown (right). (G) Quantification of CD8+ T-cell populations in WT and at different disease stages based on the expression levels of Eomes and TCF-1. Quantitative results of exhaustion-related markers expression (H) and memory phenotypes:naïve, CD44–CD62L+; CM, CD44+CD62L+; EM, CD44+CD62L–; and effector, CD44–CD62L–. (I) within the Eμ-TCL1 T-cell Eomes/TCF-1 gates mentioned in panel G. Data are cumulative results from ≥3 experiments in panels H-I or representative of 3 independent experiments in panels E-G. Experiments were replicated using intermediate (interm)- and late-stage AT Eμ-TCL1 mice. Each symbol represents an individual animal in panels G-I. Data are presented as mean ± SEM in panels A-C,H-I; or mean ± SD in panels D,G. Differences were analyzed using a 2-way ANOVA with Sidak multiple correction test in panels A-D,G; or a 2-tailed, unpaired t test in panels H-I. ∗P < .05; ∗∗P < .01; ∗∗∗P < .001; ∗∗∗∗P < .0001. AT, adoptive transfer; gMFI, geometric mean fluorescence intensity; ns, non-significant; PBMCs, peripheral blood mononuclear cells; TFs, transcription factors.
Using the AT Eμ-TCL1 model, we investigated the transcriptional and metabolic dynamics of splenic CD8+ T cells across disease stages (early [∼25% CD5+CD19+B220lo peripheral CLL cells], intermediate [∼50%], and late [∼85%]), compared with T cells from WT animals. Multiparameter flow cytometry assessing T-cell activation, memory, and exhaustion profiles via the expression of 4 surface markers (PD-1, KLRG-1, CD44, and CD62L), 3 intracellular TFs (Eomes, TOX, and TCF-1), and a transcriptional coactivator (PPAR-γ coactivator 1α [PGC1α]) revealed changes in 11 CD8+ T-cell clusters (Figure 2E; supplemental Figure 1E). Eomes and TCF-1 showed distinct expression patterns in the most dynamic clusters (Figure 2F). Clusters 8 and 11, absent in WT, accumulated with disease progression and showed high Eomes and low TCF-1 expression. In contrast, clusters 2 and 10, with low Eomes and high TCF-1, progressively diminished in diseased mice. Clusters 6, 7, and 9, with intermediate Eomes and high TCF-1, were more abundant in early and/or intermediate stages than in late stage. For a more comprehensive analysis, we categorized CD8+ T cells based on Eomes and TCF-1 expression to further characterize their phenotype. T cells from late-stage leukemic mice showed an accumulation of the EomeshiTCF-1lo population (Figure 2G; supplemental Figure 1F), enriched in exhaustion-related markers (TOX, PD-1, Tim-3, and KLRG-1) and EM/terminally differentiated phenotypes (Figure 2H-I). This exhaustion-related signature was not only observed in EM cells but also in CM populations (supplemental Figure 2A), aligning with increased Eomes, Tbet, and TOX in both EM and CM T cells from patients with CLL compared with HDs (supplemental Figure 2B-C). These findings suggest that altered expression of exhaustion-related markers in CLL T cells is not merely due to the overrepresentation of effector cells. Despite this, T cells from late-stage leukemic mice maintained higher interferon gamma (IFNγ), granzyme B, and perforin expression while exhibiting decreased tumor necrosis factor-α (TNFα) production (supplemental Figure 2D). Thus, we refer to late-stage AT Eμ-TCL1 T cells as “exhausted-like” due to their persistent cytokine production despite phenotypical exhaustion (EomeshiTCF-1loTOXhiPD-1+Tim-3+), a term specific to our study.
T-cell metabolic abnormalities are associated with CLL progression
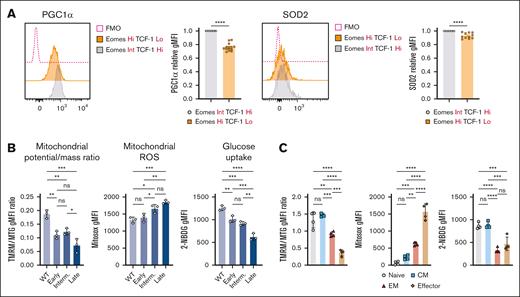
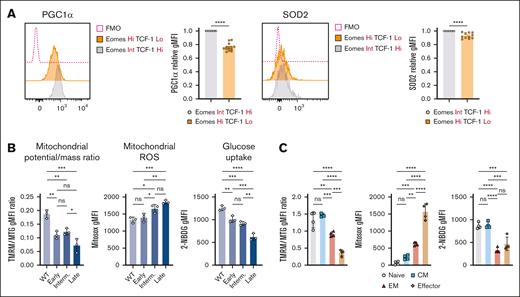
Mitochondrial biogenesis is regulated by the transcriptional coactivator PGC1α,34,35 which is also crucial for cellular antioxidant responses.36 Exhausted-like EomeshiTCF-1lo Eμ-TCL1 T cells exhibited significant downregulation of PGC1α and mitochondrial antioxidant superoxide dismutase 2 (SOD2) compared with TCF-1hi cells (Figure 3A), consistent with our previous findings in patients.15 Additionally, as CLL progressed, mitochondrial depolarization and ROS production increased, whereas glucose uptake decreased (Figure 3B).
T-cell metabolic abnormalities are associated with CLL progression. (A) Representative histograms and quantification of relative intracellular PGC1α and SOD2 expression within AT Eμ-TCL1 CD8+ T-cell populations with distinct Eomes and TCF-1 expression. Each data point (EomesHiTCF-1Lo) was normalized to its individual control (EomesInt.TCF-1Hi) to combine mean fluorescence intensity (MFI) data from multiple independent experiments. Analysis of mitochondrial membrane potential-to-mass ratio (TMRM:MTG), ROS production (MitoSOX), and glucose uptake (2-NBDG) in CD8+ T cells of WT and AT Eμ-TCL1 mice at different disease stages (B) and in different memory populations of Eμ-TCL1 T cells (C). Data are cumulative results from ≥3 experiments in panel A or representative of 3 independent experiments in panels B-C. Experiments were replicated using the intermediate (interm)- and late-stage AT Eμ-TCL1 mice. Each symbol represents an individual animal in panels A-C. Data are presented as mean ± SEM in panel A; or mean ± SD in panels B-C. Differences were analyzed using a 2-tailed, unpaired t test in panel A; or an ordinary 1-way ANOVA with a Tukey multiple correction test in panels B-C. ∗P < .05; ∗∗P < .01; ∗∗∗P < .001; ∗∗∗∗P < .0001. AT, adoptive transfer; FMO, fluorescence minus one; gMFI, geometric mean fluorescence intensity; ns, non-significant.
T-cell metabolic abnormalities are associated with CLL progression. (A) Representative histograms and quantification of relative intracellular PGC1α and SOD2 expression within AT Eμ-TCL1 CD8+ T-cell populations with distinct Eomes and TCF-1 expression. Each data point (EomesHiTCF-1Lo) was normalized to its individual control (EomesInt.TCF-1Hi) to combine mean fluorescence intensity (MFI) data from multiple independent experiments. Analysis of mitochondrial membrane potential-to-mass ratio (TMRM:MTG), ROS production (MitoSOX), and glucose uptake (2-NBDG) in CD8+ T cells of WT and AT Eμ-TCL1 mice at different disease stages (B) and in different memory populations of Eμ-TCL1 T cells (C). Data are cumulative results from ≥3 experiments in panel A or representative of 3 independent experiments in panels B-C. Experiments were replicated using the intermediate (interm)- and late-stage AT Eμ-TCL1 mice. Each symbol represents an individual animal in panels A-C. Data are presented as mean ± SEM in panel A; or mean ± SD in panels B-C. Differences were analyzed using a 2-tailed, unpaired t test in panel A; or an ordinary 1-way ANOVA with a Tukey multiple correction test in panels B-C. ∗P < .05; ∗∗P < .01; ∗∗∗P < .001; ∗∗∗∗P < .0001. AT, adoptive transfer; FMO, fluorescence minus one; gMFI, geometric mean fluorescence intensity; ns, non-significant.
Eμ-TCL1 T cells showed reduced mitochondrial membrane potential across all memory subsets compared with WT cells (supplemental Figure 3A). Mitochondrial depolarization, high ROS and low glucose uptake were observed in EM and terminal effector populations of Eμ-TCL1 T cells (Figure 3C). Moreover, the metabolic abnormalities were linked to PD-1 and Tim-3 expression (supplemental Figure 3B), echoing a previous study using a model of chronic infection.37
Transcriptional signature pinpoints metabolic and signaling changes associated with T-cell exhaustion along CLL progression
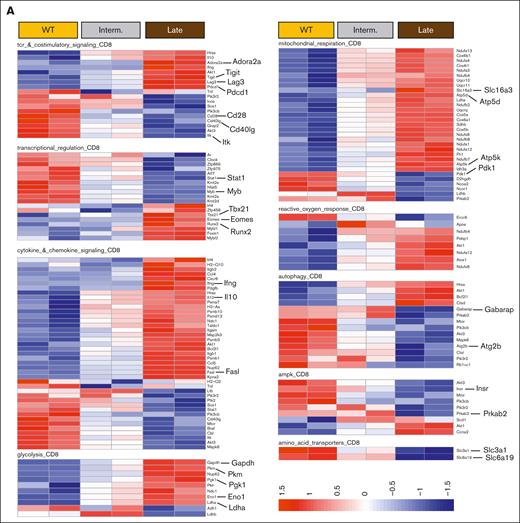
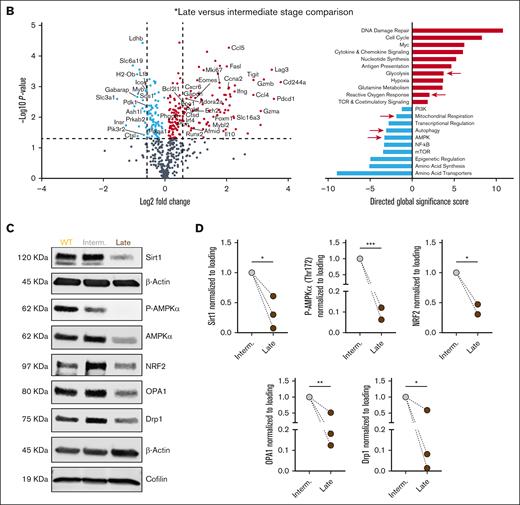
To explore the impact of CLL progression on T-cell gene expression, we performed NanoString analysis on CD8+ T cells from AT Eμ-TCL1 mice at intermediate and late disease stages. Late-stage cells upregulated exhaustion-related genes (Pdcd1, Lag3, Tigit, and Cd244A) and TF genes involved in differentiation and effector function (Eomes, Tbx21, and Runx2), and downregulated genes encoding for TCR and costimulatory signaling molecules (CD28 and CD40lg), potentially reflecting responses to chronic stimulation (Figure 4A-B). Functional analysis revealed increased proliferation and effector genes (Mki67, Ifng, Gzma, and Gzmb) in T cells from late-stage leukemic mice, along with elevated Il10, suggesting an immune suppression signature (Figure 4A-B).
Transcriptional regulation of T-cell metabolism showed upregulated glycolysis genes (Gapdh, Pkm, Pgk1, Eno1, and Ldha) in T cells from late-stage leukemic mice, alongside increased mitochondrial respiration genes (several subunits of the NADH-ubiquinone oxidoreductase (Nduf) gene family, Atp5d, Atp5k and Slc16a3) in intermediate and late stages, as compared to T cells from WT mice (Figure 4A). However, late-stage T cells showed a negative gene set analysis significance score for mitochondrial respiration compared with cells from intermediate-stage leukemic mice (Figure 4B), with genes such as Pdk1, D2hgdh, and Sod2 significantly downregulated. Response to reactive oxygen species increased progressively with disease, consistent with mitochondrial depolarization. Moreover, downregulation of autophagy and AMPK pathways was observed, suggesting impaired mitochondrial clearance38,39 (Figure 4A-B). Immunoblotting confirmed dysregulated AMPK signaling (low Sirt1, AMPKα, phosphorylated AMPKα, and NRF2) and decreased mitochondrial proteins OPA1 and Drp1 in T cells isolated from late-stage leukemic mice (Figure 4C-D). This confirms the overall decrease in mitochondrial activity and oxidative stress response in Eμ-TCL1 T cells at late disease stages.
Epigenetic signature reveals the hierarchical programming of CLL T cells toward terminal differentiation and metabolic imbalance
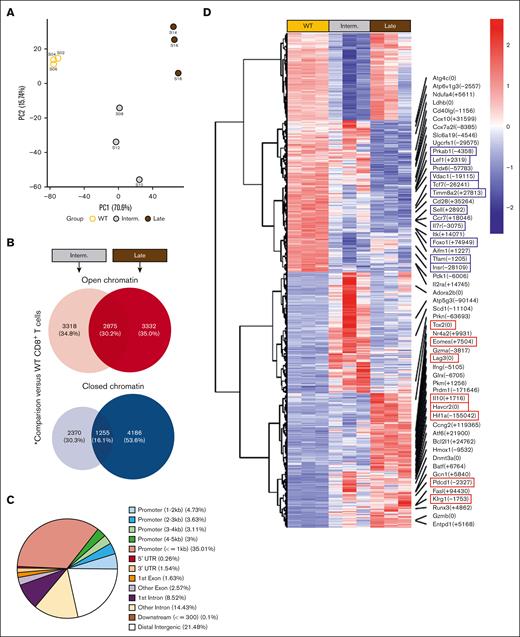
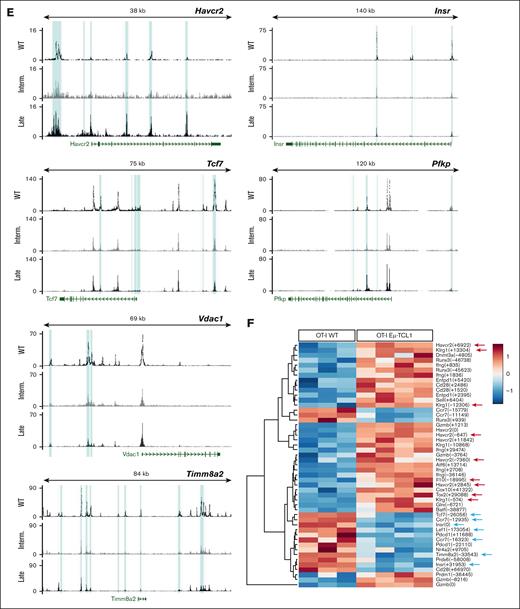
NanoString analysis revealed gradual downregulation of histone methyltransferase genes in Eμ-TCL1 T cells (supplemental Figure 3C), indicating epigenetic changes. ATAC-seq data revealed distinct epigenetic clustering of T cells by disease stage (Figure 5A). CD8+ T cells from late-stage leukemic mice showed more closed chromatin regions than intermediate stage, particularly in distal regulatory elements such as enhancers (Figure 5B-C), aligning with the epigenetic signature of T-cell exhaustion.40 Together, late-stage samples showed more accessible chromatin regions (ACRs) near genes associated with terminal differentiation and immune suppression (Tox2, Eomes, Prdm1, Nr4a2, Pdcd1, Havcr2, Lag3, and Klrg1) and functional capacity (Ifng, Gzmb, and Gzma; Figure 5D-E). In contrast, ACRs near memory/self-renewal genes (Tcf7, Lef1, Foxo1, Sell, Il7r, and Ccr7) and TCR signaling/costimulation genes (CD28, CD40lg, and Il2ra) were gradually decreased in Eμ-TCL1 T cells (Figure 5D-E). Previously, the CLL bystander effect on acute T-cell response using the OT-I CD8+ T-cell murine model was investigated,32 demonstrating a similar epigenetic signature to Eμ-TCL1 T cells, that is, increased terminal differentiation and reduced T-cell memory (Figure 5F). This indicates that the skewed T-cell phenotype in CLL is not necessarily antigen-dependent.
We next investigated metabolism-related chromatin changes in Eμ-TCL1 T cells and found significantly reduced ACRs near mitochondrial genes (Tfam, Timm8a2, and Vdac1) and autophagy/AMPK-related genes (Atg4c, Prkab1, and Insr; Figure 5D-E). Conversely, ACRs near glycolytic genes (Hif1α, Pkm, and Pfkp) increased, alongside changes in redox genes (Glrx and Hmox1, more accessible; Prdx6, less accessible; Figure 5D-E). These findings indicate that the metabolic reprogramming of CLL T cells is epigenetically regulated during disease progression.
A central regulator of T-cell metabolism, integrating TCR signaling with downstream transcriptional reprogramming, is PI3K/Akt signaling. Thus, it was a potential candidate to examine in Eμ-TCL1 T cells, which had shown defective expression of TCR costimulatory genes and central metabolic players. The focus on PI3K inhibition in this study was guided by preliminary ex vivo comparisons with ibrutinib, a Bruton's tyrosine kinase/ITK inhibitor, which suggested that PI3K inhibition had a superior impact on restoring memory phenotype skewing and mitochondrial capacity in Eμ-TCL1 T-cell differentiation experiments (supplemental Figure 4A-C).
PI3Kδ inhibition enhances mitochondrial activity and memory differentiation of CLL T cells
Here, we aimed to ex vivo manipulate T-cell metabolism using a representative approach. PI3K/Akt signaling is an overarching pathway that shifts T-cell metabolism from oxidative phosphorylation and lipid oxidation to aerobic glycolysis after activation.41 However, sustained activation of this pathway promotes terminal T-cell differentiation.42 Thus, we reasoned that chronic T-cell activation in CLL might increase Akt signaling, leading to terminal differentiation and metabolic disturbance. Consistent with the opposing roles of AMPK and Akt on cellular metabolism,43 we observed upregulated phosphorylation of Akt and downstream FOXO1/3a in Eμ-TCL1 CD8+ T cells (supplemental Figure 5A-B). In line with the role of PI3K in T-cell activation, treating T cells of patients with CLL with 5 μM dose of idelalisib (PI3Kδ inhibitor) during ex vivo stimulation reduced activation levels (CD25), Akt, and S6 protein phosphorylation after 48 hours (supplemental Figure 5C). However, activation levels were comparable on day 10 after activation (supplemental Figure 5D). Additionally, after 10 days, idelalisib-treated cells showed a trend toward decreased mitochondrial membrane potential, associated with more quiescent metabolic phenotype, increased SRC and maximum OCR:ECAR ratio, and a significant reduction in glycolytic capacity, aligning with memory T-cell characteristics44 (Figure 6A-B; supplemental Figure 5E). Treated cells shifted toward a CM phenotype, with decreased EomeshiTbethi (effector) and increased EomesloTbetlo (memory) populations and decreased TOX expression (Figure 6C-E). Moreover, idelalisib increased the EomesloTCF-1hi population, with enhanced PGC1α expression (Figure 6F-G; supplemental Figure 5F), indicative of increased stemness and mitochondrial metabolism.
We next established the ex vivo effects of idelalisib in the AT Eμ-TCL1 model. Although a 10 μM dose has been shown to improve ACT in vivo effects,18,19 we used 5 μM dose because it maintained T-cell expansion (supplemental Figure 5G-H). Idelalisib-treated CD8+ T cells exhibited increased mitochondrial SRC, membrane potential, ROS production, and PGC1α expression (Figure 6H-J). This was accompanied by increased Sirt1 and P-AMPKα and reduced P-Akt and P-FOXO1/3a (supplemental Figure 6A-B). Idelalisib treatment increased OPA1 and reduced Drp1 expression, suggesting enhanced mitochondrial fusion, previously linked to CM programming,27 and downregulated Glut1 expression, indicating reduced glucose dependence (supplemental Figure 6A-B). Idelalisib induced CM phenotypes with high CD62L expression, decreased exhaustion-related markers (Tim-3, Eomes, and TOX), and increased TCF-1 levels (Figure 6K-M; supplemental Figure 7A). Altogether, these findings show that idelalisib promotes memory-like differentiation in CLL T cells and induces metabolic reprogramming that can promote the effectiveness of ACT.
PI3Kδ inhibition allows for persistent CAR T cells in CLL in vivo in an immunocompetent mouse model
We next evaluated PI3Kδ inhibition during ACT product generation. Total T cells from leukemic AT Eμ-TCL1 mice were expanded and transduced with an anti-CD19 CAR construct containing a CD28 costimulatory domain in the continuous presence of idelalisib (Figure 7A). Idelalisib supported cell expansion and improved viral transduction efficiency, even in T cells from aged transgenic Eμ-TCL1 mice (supplemental Figure 7B-C). Both vehicle- and idelalisib-treated CAR T cells showed an in vitro capacity to kill 3T3 target cells expressing mouse CD19 (supplemental Figure 7D). CLL-bearing AT Eμ-TCL1 mice were injected IV with idelalisib/vehicle-treated CAR T cells or untransduced T cells. Confirming the exhausted-like phenotype, vehicle-treated CAR T cells failed to expand in the recipient mice and lacked antileukemic effects, resulting in poor mice survival (Figure 7B-D). In contrast, idelalisib-treated CAR T cells showed superior expansion peak and longer persistence in peripheral blood, leading to significant elimination of CLL cells and prolonged mice survival for up to 209 days (Figure 7B-D). One week after infusion, idelalisib-treated CAR T cells were enriched in the CM phenotype, which shifted to predominantly EM cells by week 2, possibly coinciding with increased activation status (supplemental Figure 8A). By comparing the endogenous T-cell profile across all groups, idelalisib group exhibited more CM and fewer EM and terminal effector phenotypes (supplemental Figure 8B).
PI3Kδ inhibition allows for persistent CAR T cells in CLL in vivo. (A) Experimental design for the generation and ex vivo reprogramming of AT Eμ-TCL1 CAR T cells using idelalisib (idela), followed by infusion into different groups of AT Eμ-TCL1 mice with established disease. (B) Percentages of GFP+ CAR T cells (of total T cells) in peripheral blood (PB) for 7 weeks since the start of CLL AT in mice (arrow pointing to the time point when cyclophosphamide [CTX] and CAR T cells were injected). (C) Representative dot plots showing gating on CD19+ B cells and CD3+ T cells, alongside quantification of absolute CLL cell (CD19+CD5+B220lo) counts in PB. (D) Kaplan-Meier survival analysis of CAR T-cell–treated mice compared with control mice receiving untransduced (UT) T cells. (E) Spleen analysis 4 weeks after CAR T-cell injection, showing representative spleen sizes and tabulated weights, absolute CLL cell counts, and GFP+ CAR T-cell counts. (F) Quantitative results of endogenous T-cell memory phenotypes in the spleens of treated mice (naïve, CD44–CD62L+; CM, CD44+CD62L+; EM, CD44+CD62L–; and effector, CD44–CD62L). (G) Bone marrow (BM) analysis 4 weeks after CAR T-cell injection, showing absolute CLL cell counts and GFP+ CAR T-cell counts. The experiments included 12 mice for the idela CAR T-cell group, 11 mice for the DMSO CAR T-cell group, and 9 mice for the UT control group. On week 4 after CAR T-cell infusion, 3 randomly selected mice from each group were euthanized for spleen and BM analyses. Data are representative of 2 independent experiments. Each symbol represents an individual animal. Data are presented as mean ± SD. Differences analyzed using an ordinary 1-way ANOVA with Tukey multiple correction test in panels B-C,E-G. Log-rank (Mantel-Cox) test was used for survival study comparisons. ∗P < .05; ∗∗P < .01; ∗∗∗P < .001; ∗∗∗∗P < .0001. Panel A was created with BioRender.com. AT, adoptive transfer; GFP, green fluorescent protein; ns, non-significant; Untransd, untransduced.
PI3Kδ inhibition allows for persistent CAR T cells in CLL in vivo. (A) Experimental design for the generation and ex vivo reprogramming of AT Eμ-TCL1 CAR T cells using idelalisib (idela), followed by infusion into different groups of AT Eμ-TCL1 mice with established disease. (B) Percentages of GFP+ CAR T cells (of total T cells) in peripheral blood (PB) for 7 weeks since the start of CLL AT in mice (arrow pointing to the time point when cyclophosphamide [CTX] and CAR T cells were injected). (C) Representative dot plots showing gating on CD19+ B cells and CD3+ T cells, alongside quantification of absolute CLL cell (CD19+CD5+B220lo) counts in PB. (D) Kaplan-Meier survival analysis of CAR T-cell–treated mice compared with control mice receiving untransduced (UT) T cells. (E) Spleen analysis 4 weeks after CAR T-cell injection, showing representative spleen sizes and tabulated weights, absolute CLL cell counts, and GFP+ CAR T-cell counts. (F) Quantitative results of endogenous T-cell memory phenotypes in the spleens of treated mice (naïve, CD44–CD62L+; CM, CD44+CD62L+; EM, CD44+CD62L–; and effector, CD44–CD62L). (G) Bone marrow (BM) analysis 4 weeks after CAR T-cell injection, showing absolute CLL cell counts and GFP+ CAR T-cell counts. The experiments included 12 mice for the idela CAR T-cell group, 11 mice for the DMSO CAR T-cell group, and 9 mice for the UT control group. On week 4 after CAR T-cell infusion, 3 randomly selected mice from each group were euthanized for spleen and BM analyses. Data are representative of 2 independent experiments. Each symbol represents an individual animal. Data are presented as mean ± SD. Differences analyzed using an ordinary 1-way ANOVA with Tukey multiple correction test in panels B-C,E-G. Log-rank (Mantel-Cox) test was used for survival study comparisons. ∗P < .05; ∗∗P < .01; ∗∗∗P < .001; ∗∗∗∗P < .0001. Panel A was created with BioRender.com. AT, adoptive transfer; GFP, green fluorescent protein; ns, non-significant; Untransd, untransduced.
Four weeks after CAR T-cell injection, idelalisib group showed remarkably smaller spleens with low CLL burden, higher CAR T-cell counts (Figure 7E; supplemental Figure 8C), and increased frequencies of endogenous T-cell CM subsets (Figure 7F), as compared to both DMSO CAR or untransduced groups. Bone marrow analysis showed similar results (Figure 7G; supplemental Figure 8C). Additionally, endogenous splenic CD8+ T cells in the idelalisib group exhibited increased mitochondrial membrane potential and reduced ROS levels compared with control groups, highlighting the reduced metabolic stress on these cells (supplemental Figure 8D).
Discussion
Ex vivo T-cell reprogramming can enhance ACT efficacy18,45-47 but requires an understanding of the tumor-specific factors influencing T-cell differentiation and metabolic activity.12,13 In CLL, T-cell dysfunction4-8 limits ACT success.3 Although we introduced defective metabolism as part of this dysfunction,15 the specific bottlenecks remained unclear, necessitating investigation into the molecular pathways involved. Here, we identified defects in mitochondrial metabolism, including baseline depolarization, as key drivers of T-cell terminal differentiation in patients with CLL, mirroring observations in solid tumors and chronic infections.12,13,37 These findings were replicated in the Eμ-TCL1 model, constituting, to our knowledge, its first validation for studying T-cell metabolic defects. Ex vivo activation of CLL T cells revealed persistent mitochondrial dysfunction, with lower OCR and SRC. Moreover, the high ROS levels suggest a link to mitochondrial depolarization and T-cell exhaustion.13
Exhausted T cells develop as heterogeneous subsets regulated by TFs such as TCF-1, Tbet, Eomes, and TOX.48-50 Progenitor exhausted cells (TCF-1+) respond to checkpoint blockade, unlike terminally exhausted cells.51-54 In CLL, transcriptional and epigenetic dynamics of exhaustion are underexplored. Hanna et al identified 2 CD8+ T-cell populations: PD-1intTCF-1+ (progenitor-like) and PD-1hi (terminally exhausted).30 We extend this knowledge by showing elevated Tbet, Eomes, and TOX in T cells of patients with CLL. In Eμ-TCL1 mice, CLL progression correlated with TCF-1 loss and increased EomeshiTCF-1lo populations, resembling terminal exhaustion.11,48,55 Accordingly, T cells from late-stage leukemic Eμ-TCL1 mice displayed an epigenetic signature of terminal differentiation and loss of stemness, overlapping with ATAC-seq data on ovalbumin-specific T cells in CLL,32 indicating that terminal differentiation is not solely driven by CLL antigen specificity. Notably, T cells from late-stage mice retained IFNγ and granzyme production, as seen in patients with CLL,5 suggesting that T-cell exhaustion involves distinct states, some retaining cytokine production.56 Although our results show exhaustion-related signatures in both EM and CM cells, the transcriptional and epigenetic analyses in this study were performed on total Eμ-TCL1 CD8+ T cells, potentially reflecting effector skewing during disease progression. Replicating these studies using naïve-depleted T-cell populations is warranted.
We explored T-cell metabolic dynamics during CLL development. Mitochondrial depolarization and ROS production in Eμ-TCL1 T cells were associated with terminally differentiated/effector subsets. Mitochondrial depolarization was observed even in early disease stages, indicating a potential causal relationship with effector skewing in CLL. Naïve/CM cells typically have a higher mitochondrial potential-to-mass ratio due to elongated mitochondria with organized cristae.27,57,58 Our results revealed mitochondrial depolarization in more differentiated HD T-cell populations; however, patients with CLL displayed increased depolarization across all subsets, indicating an intrinsic defect. Because mitochondrial dysfunction can trigger exhaustion without continuous antigen stimulation,59 CLL T cells might be predisposed toward terminal differentiation early upon activation. Reduced PGC1α and SOD2 expression in EomeshiTCF-1lo T cells likely underlie these mitochondrial defects. Additionally, CLL progression altered the epigenetic regulation of T-cell metabolism, with decreased ACRs near mitochondrial-related genes (Tfam, Vdac1, and Timm8a2) and increased ACR near Hif1α, indicating glycolytic signature, aligning with a prior report.59
AMPK regulates metabolic stress response, mitochondrial biogenesis39 and mitophagy60,61 and inhibits anabolic growth through mTORC1 suppression.62 We observed progressive downregulation of autophagy and AMPK pathways in T cells from late-stage leukemic Eμ-TCL1 mice, with decreased AMPKα phosphorylation and downregulation of related targets, Sirt1 and NRF2. These energy-sensing defects likely contribute to mitochondrial dysfunction in CLL T cells, warranting further mechanistic studies.
PI3K/Akt/mTOR signaling has an overarching role in T-cell metabolism,16,62 which can oppose AMPK activity.43,63 AMPK and mTOR signaling balance is essential for memory T-cell metabolic/mitochondrial “fitness” required for survival and recall responses.57,62 In Eμ-TCL1 T cells, we observed increased basal Akt signaling associated with mitochondrial disturbance, akin to solid tumor microenvironment,12 suggesting a predisposition to terminal differentiation during ex vivo expansion. Despite elevated Akt phosphorylation, we found downregulated PI3K transcriptional signature in Eμ-TCL1 T cells, which can suggest a negative feedback response to overactivation.64,65 Considering PI3K/Akt role in T-cell metabolism, we explored PI3K inhibition as a model to reprogram CLL T-cell metabolism and improve ACT outcomes. Although small molecule PI3Kδ inhibitors, used to target the malignant cells in CLL treatment regimens, modulate the T-cell compartment and trigger immune adverse events,66,67 their ex vivo application enhanced ACT in solid tumors by promoting T-cell persistence and metabolism.18,19 Using idelalisib in ex vivo CLL T-cell culturing increased CM cell frequency, upregulated TCF-1, downregulated exhaustion-related TFs, and reprogrammed metabolism by enhancing SRC and maximal mitochondrial capacity relative to glycolytic activity, resembling memory T-cell programming.57 In Eμ-TCL1 T cells, idelalisib increased mitochondrial membrane potential, SRC and PGC1α expression, with increased AMPKα phosphorylation and Sirt1 expression potentially enhancing PGC1α and memory T-cell development.43 Idelalisib further promoted mitochondrial fusion, indicating Eμ-TCL1 T-cell programming toward CM fate.27 T cells from patients with CLL exhibited a more quiescent metabolic state upon idelalisib treatment, possibly due to variations in stimulation techniques and inherent murine-human T-cell biology differences.
Despite the limited application of PI3K inhibition in CLL ACT production, the PI3Kδ/γ inhibitor duvelisib recently demonstrated improved CLL CAR T-cell persistence in NOG mouse model.22 However, this model may be suboptimal due to poor peripheral engraftment of the OSU-CLL cell line and lack of CLL microenvironment components. To address this, we used immunocompetent Eμ-TCL1 mice for testing CAR T-cell priming with idelalisib. Using Eμ-TCL1 T cells for CAR T-cell generation is of translational value, representing the skewed starting material used for autologous CLL T-cell therapy. Idelalisib-treated CAR T cells exhibited significant antileukemic effects and prolonged survival. Consequently, the reduced CLL burden also normalized endogenous T-cell differentiation and mitochondrial polarization.
In conclusion, this study links metabolism, differentiation, and function in CLL-specific T-cell dysfunction. Ex vivo PI3K inhibition significantly improves CAR T-cell outcomes, offering clinical potential without requiring in vivo drug treatment and the associated adverse events. Further research is needed to optimize more resilient CAR constructs and explore other metabolic modulators revealed by this study, beyond PI3K.
Acknowledgments
The authors thank the patients for their blood donations and cooperation in the studies. The authors also thank Julie Dubois, Dennis de Rooij, Ilse Ligtenberg, and Inoka Twickler from the Amsterdam B-cell biobank. The authors acknowledge Carlo Croce for kindly providing the Eμ-TCL1 mouse model. The authors also thank Jorge and Silvia Ferioli for their generous philanthropic contributions to this project. Additionally, the authors extend their sincerest appreciation to Lisa Hale for her generous philanthropic contribution.
This work was supported by the European Research Council (ERC) Consolidator: BOOTCAMP (864815), Lymph and Co: 2018-LYCo-008, Cancer Center Amsterdam (CCA-2023-9-92), and National Institutes of Health/National Cancer Institute (NCI; grant R01CA240434). This work has been supported in part by the Flow Cytometry, Molecular Genomics, and the Biostatistics and Bioinformatics Core Facilities at the H. Lee Moffitt Cancer Center & Research Institute, an NCI-designated Comprehensive Cancer Center (P30-CA076292).
Authorship
Contribution: W.G., N.B.G., H.S.-M., E.S., J.P.-I., A.P.K., and P.C.R. conceptualized the study; W.G., N.B.G., H.S.-M., M.M.-V., A.U.-P., and F.S.P. were responsible for methodology; W.G., N.B.G., H.S.-M., M.M.V., A.U.-P., F.S.P., K.M., and J.P., performed investigations; J.P.-I. and A.P.K. were responsible for patient samples; W.G., N.B.G., H.S.-M., M.M.-V., A.O., T.I.S., A.U.-P., and F.S.P. were responsible for visualization; J.P.-I., A.P.K., J.C.C., and J.R.C.-G. acquired funding; J.P.-I., E.S., A.P.K., J.C.C., and H.S.-M. performed project administration; J.P.-I., E.S., A.P.K., and H.S.-M. supervised the study; and W.G., N.B.G., H.S.-M., E.S., J.P.-I., and A.P.K wrote the original manuscript draft and reviewed and edited the manuscript.
Conflict-of-interest disclosure: T.I.S. has pending patent applications in the field of adoptive cellular therapy for cancer. The remaining authors declare no competing financial interests.
Correspondence: Javier Pinilla-Ibarz, H. Lee Moffitt Cancer Center & Research Institute, 12902 USF Magnolia Dr, Tampa, FL 33612; email: javier.pinilla@moffitt.org; and Eva Sahakian, H. Lee Moffitt Cancer Center & Research Institute, 12902 USF Magnolia Dr, Tampa, FL 33612; email: eva.sahakian@moffitt.org.
References
Author notes
W.G., N.B.G., and H.S.-M. are joint first authors.
E.S., J.P.-I., and A.P.K. are joint senior authors.
Original data are available on request from the corresponding authors, Javier Pinilla-Ibarz (javier.pinilla@moffitt.org) and Eva Sahakian (eva.sahakian@moffitt.org).
The full-text version of this article contains a data supplement.

![PI3Kδ inhibition allows for persistent CAR T cells in CLL in vivo. (A) Experimental design for the generation and ex vivo reprogramming of AT Eμ-TCL1 CAR T cells using idelalisib (idela), followed by infusion into different groups of AT Eμ-TCL1 mice with established disease. (B) Percentages of GFP+ CAR T cells (of total T cells) in peripheral blood (PB) for 7 weeks since the start of CLL AT in mice (arrow pointing to the time point when cyclophosphamide [CTX] and CAR T cells were injected). (C) Representative dot plots showing gating on CD19+ B cells and CD3+ T cells, alongside quantification of absolute CLL cell (CD19+CD5+B220lo) counts in PB. (D) Kaplan-Meier survival analysis of CAR T-cell–treated mice compared with control mice receiving untransduced (UT) T cells. (E) Spleen analysis 4 weeks after CAR T-cell injection, showing representative spleen sizes and tabulated weights, absolute CLL cell counts, and GFP+ CAR T-cell counts. (F) Quantitative results of endogenous T-cell memory phenotypes in the spleens of treated mice (naïve, CD44–CD62L+; CM, CD44+CD62L+; EM, CD44+CD62L–; and effector, CD44–CD62L). (G) Bone marrow (BM) analysis 4 weeks after CAR T-cell injection, showing absolute CLL cell counts and GFP+ CAR T-cell counts. The experiments included 12 mice for the idela CAR T-cell group, 11 mice for the DMSO CAR T-cell group, and 9 mice for the UT control group. On week 4 after CAR T-cell infusion, 3 randomly selected mice from each group were euthanized for spleen and BM analyses. Data are representative of 2 independent experiments. Each symbol represents an individual animal. Data are presented as mean ± SD. Differences analyzed using an ordinary 1-way ANOVA with Tukey multiple correction test in panels B-C,E-G. Log-rank (Mantel-Cox) test was used for survival study comparisons. ∗P < .05; ∗∗P < .01; ∗∗∗P < .001; ∗∗∗∗P < .0001. Panel A was created with BioRender.com. AT, adoptive transfer; GFP, green fluorescent protein; ns, non-significant; Untransd, untransduced.](https://ash.silverchair-cdn.com/ash/content_public/journal/bloodadvances/9/10/10.1182_bloodadvances.2024014822/2/m_blooda_adv-2024-014822-gr7.jpeg?Expires=1769310078&Signature=i3ZVeuBHRtwYKC3ItHgh4CeOtFS1LiBzi3JNJzb8gSBnpf7cewX36cVcFg7KNn6dbD9Zo4ZYLGXRhVH24GDFHIIgZw-A6rwcICQqc5W8ja6pr1S1k4qXwvxDstBfmNiYgNpIqymN2RskWIPM7iAjpL0zdDyxmRmuIe2VnNiL4qpR4jI9eXzcJqoVcTHPBBxMfp4q-SbOqgq3V2pGG-TQUnlhaFIMcmrZKx8zLPJEad--RpMJDAwcdUoeyV0M-u96c4GGp9HUYhDwQBBbvqV8qPmPnR7qZkqJEyXemoCr0i~uJhh74UO9i7qum1AsjdVRONTPUmbyKhjRN15n~AGB7g__&Key-Pair-Id=APKAIE5G5CRDK6RD3PGA)

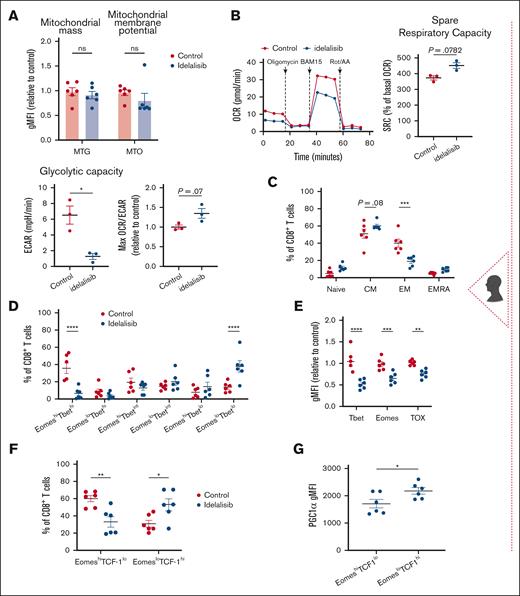
![PI3Kδ inhibition enhances mitochondrial activity and memory differentiation of CLL T cells. Analysis of patient samples (A-G). Isolated CLL T cells treated with/without 5 μM idelalisib over a 10-day stimulation period with anti-CD3/anti-CD28 soluble antibodies. (A) Mitochondrial mass (MTG) and membrane potential (MTO) relative to the control (untreated) mean. (B) Extracellular flux analysis (T-cell metabolic profiling test) performed on treated and untreated T cells. Representative OCR kinetic graph is provided. Percentage of SRC, glycolytic capacity, and maximal OCR:ECAR ratio were calculated. When indicated, data were calculated relative to the control mean. (C) CD8+ T-cell subsets assessed according to the surface expression of CD45RA and CD27: naïve, central memory (CM), effector memory (EM), and terminally differentiated effector memory (EMRA). (D) CD8+ Tbetlo-int-hi and Eomeslo-hi populations were identified. (E) The expression levels of Tbet, Eomes, and TOX were quantified relative to the control mean. (F) Frequency of EomesloTCF-1hi and EomeshiTCF-1lo CD8+ T-cell populations. (G) PGC1α levels within the EomesloTCF-1hi and EomeshiTCF-1lo populations. Analysis of murine samples (H-M). Isolated AT Eμ-TCL1 CD8+ T cells were expanded for 6 to 7 days using anti-CD3/anti-CD28 dynabeads with/without 5 μM idelalisib. (H) Representative OCR kinetic graph and tabulated metabolic parameters of expanded CD8+ T cells. (I) Representative histograms and tabulated results of mitochondrial mass (MTG), membrane potential (TMRM), and ROS production (MitoSOX). (J) Representative histogram and tabulated PGC1α expression levels in CD8+ T cells. (K) Quantification of memory CD8+ T-cell phenotypes (naïve, CD44–CD62L+; CM, CD44+CD62L+; EM, CD44+CD62L–; and effector, CD44–CD62L–). (L) Representative histogram and tabulated CD62L expression levels in CD8+ T cells. (M) Quantitative results for the relative expression levels of exhaustion-related markers. Data are cumulative from ≥3 experiments in panels I-M or representative of 3 independent experiments in panel H. Each symbol represents an individual animal in panels I-M. Each data point (idelalisib) was normalized to its individual control (dimethyl sulfoxide [DMSO]) to combine MFI data from multiple independent experiments in panels I-J,L-M. Data are presented as mean ± SEM in panels A-G,I-M; or mean ± SD in panel H. Differences were analyzed using a 2-way ANOVA with Sidak multiple correction test in panels B-F; or a 2-tailed, paired t test in panels A-B,G-M. ∗P < .05; ∗∗P < .01; ∗∗∗P < .001; ∗∗∗∗P < .0001. FMO, fluorescence minus one; gMFI, geometric mean fluorescence intensity; ns, non-significant.](https://ash.silverchair-cdn.com/ash/content_public/journal/bloodadvances/9/10/10.1182_bloodadvances.2024014822/2/m_blooda_adv-2024-014822-gr6hm.jpeg?Expires=1769310079&Signature=YjdvZhXRiEIRAfAurVs0K45co0XRNbvebj6SGgwbbmZptu6dtq0XgYascJeIgFKjZ~q5T1RNV8JRrOq4sQbDc9CnFAGqEe-v~rtdE4n5aeIni8wdX~274H8LQ0WGey6-BvDdaj9bQgIh4AEuazIVp5f6ag2aGLrVVukZaiXgbdgVcrvEMsH2HDUy03fgwtRXBUHcOtxkrkKNY~MiKoLXS5E-4Pblupk2umVQHDRCME0xbkcyzpuov2v9Hkmk3yD-k86v5QlzqkPgUwriwAucz~0V-yWsayLOyWVQl-vXYssyx3EuQ8IqM9Y-CW~E1kEwht-y6pZG38AAK~VpxXd6Eg__&Key-Pair-Id=APKAIE5G5CRDK6RD3PGA)
![PI3Kδ inhibition allows for persistent CAR T cells in CLL in vivo. (A) Experimental design for the generation and ex vivo reprogramming of AT Eμ-TCL1 CAR T cells using idelalisib (idela), followed by infusion into different groups of AT Eμ-TCL1 mice with established disease. (B) Percentages of GFP+ CAR T cells (of total T cells) in peripheral blood (PB) for 7 weeks since the start of CLL AT in mice (arrow pointing to the time point when cyclophosphamide [CTX] and CAR T cells were injected). (C) Representative dot plots showing gating on CD19+ B cells and CD3+ T cells, alongside quantification of absolute CLL cell (CD19+CD5+B220lo) counts in PB. (D) Kaplan-Meier survival analysis of CAR T-cell–treated mice compared with control mice receiving untransduced (UT) T cells. (E) Spleen analysis 4 weeks after CAR T-cell injection, showing representative spleen sizes and tabulated weights, absolute CLL cell counts, and GFP+ CAR T-cell counts. (F) Quantitative results of endogenous T-cell memory phenotypes in the spleens of treated mice (naïve, CD44–CD62L+; CM, CD44+CD62L+; EM, CD44+CD62L–; and effector, CD44–CD62L). (G) Bone marrow (BM) analysis 4 weeks after CAR T-cell injection, showing absolute CLL cell counts and GFP+ CAR T-cell counts. The experiments included 12 mice for the idela CAR T-cell group, 11 mice for the DMSO CAR T-cell group, and 9 mice for the UT control group. On week 4 after CAR T-cell infusion, 3 randomly selected mice from each group were euthanized for spleen and BM analyses. Data are representative of 2 independent experiments. Each symbol represents an individual animal. Data are presented as mean ± SD. Differences analyzed using an ordinary 1-way ANOVA with Tukey multiple correction test in panels B-C,E-G. Log-rank (Mantel-Cox) test was used for survival study comparisons. ∗P < .05; ∗∗P < .01; ∗∗∗P < .001; ∗∗∗∗P < .0001. Panel A was created with BioRender.com. AT, adoptive transfer; GFP, green fluorescent protein; ns, non-significant; Untransd, untransduced.](https://ash.silverchair-cdn.com/ash/content_public/journal/bloodadvances/9/10/10.1182_bloodadvances.2024014822/2/m_blooda_adv-2024-014822-gr7.jpeg?Expires=1769310079&Signature=CgyjYex30DQ44Fa8tK4sOX0odBAKEg5x~V0oe4tJchpnCj8jZTLN6DHZGUG0r6aSdm9nn0zlATcC7PIhRnftrEG3eBX8JOt~SIXQ0BhSqRjqrjwTRAD9uuNmIj8Ii7IRgVHga73dbAiaEbbpOnvGIn2njTDL12sMUKIOuxZTQlrTrPlwBv89ovpc43N--GlsEIyYsipMUJSIwH5hEWfSmRoZS3kHefAaq9D82WA2vVFq8jlPD3ELMkOv6xhif8GncfApG6ZN8dLLUnNK3fmr3QFfduvkjMjQtvUmNz-~awELXU7MSDH7isD2yX2zvZzir-a3ImbMdEexPtxr~mYCBA__&Key-Pair-Id=APKAIE5G5CRDK6RD3PGA)