

Key Points
The platelet proteome distinguishes platelets from 2 different preclinical ITP mouse models and may be of use in profiling human disease.
The platelet proteomes suggest a slow turnover of platelets in chronic ITP and basal degranulation in acute ITP due to hyporesponsiveness.
Abstract
Immune thrombocytopenia (ITP) is an autoimmune disease characterized by enhanced platelet clearance and defective platelet production. Diagnosis by exclusion and trial-and-error treatment strategies is common practice, and despite the advancement in treatment options, many patients remain refractory. Although the existence of different pathophysiological entities is acknowledged, we are still far from stratifying and understanding ITP. To investigate, we sought to dissect the platelet proteome dynamics in so-called passive and active preclinical ITP mouse models, with which we propose to phenocopy respectively acute/newly diagnosed and persistent/chronic stages of ITP in humans. We obtained the platelet proteome at the thrombocytopenic stage and after platelet count recovery (reached naturally or by IVIg-treatment, depending on the model). Although most of the proteomic alterations were common to both ITP models, there were model-specific protein dynamics that accompanied and explained alterations in platelet aggregation responses, as measured in the passive ITP model. The expression dynamics observed in Syk may explain, extrapolated to humans and pending validation, the increased bleeding tendency of patients with ITP when treated with fostamatinib as third or later– as opposed to second line of treatment. We propose that the platelet proteome may give diagnostic and prognostic insights into ITP and that such studies should be pursued in humans.
Introduction
Primary immune thrombocytopenia (ITP) is an autoimmune condition characterized by low platelet counts, related to both platelet-impaired production and destruction. The causes behind its onset and progression are not yet fully understood.1,2 The management of ITP comprises several treatment lines (immunosuppressants, thrombopoietin receptor agonists, and splenectomy) that are applied in a trial-and-error manner, alone or combined.3 A deeper insight into the disease at the molecular level may aid in developing better, personalized treatment regimens, and platelet proteomics may provide valuable data.4,5
Herein, we characterize the platelet proteome in 2 different ITP (passive and active) mouse models at the thrombocytopenic stage and after platelet count recovery (reached naturally or through IVIg-treatment, depending on the model). These 2 models could phenocopy, as we propose, the acute/newly diagnosed and persistent/chronic stages, respectively, of ITP in humans.6 Our results support the notion that the platelet proteome may be used to distinguish ITP models and thrombocytopenic stages and suggest that the alterations observed in the ITP platelet proteome may reflect potential fine tuning of megakaryopoiesis and/or platelet priming in the circulation.
Methods
Mice
Mice were maintained in the animal care facilities of Lund University or the Netherlands Cancer Institute under specific-pathogen–free conditions. All animal experiments were approved by their respective animal ethics committees (see supplemental Methods).
Platelet functional assays, protein extraction, mass spectrometry, and data analysis
See supplemental methods.
Results and discussion
We obtained the platelet proteome from 2 ITP mouse models at the thrombocytopenic and recovered-platelet-count stages, to identify distinct protein signatures and dynamics in each model (Figure 1A). For quality control, we excluded samples with >35% missing values.7 Interestingly, ITP samples had more missing values, which could be considered an ITP-specific trait (supplemental Figure 1A; supplemental Table 1). Principal component analysis (PCA) of the proteomes after data adjustment (supplemental Figure 1B) separated the samples according to disease status (thrombocytopenia or recovery; PC1), and showed that day 3 and 7 controls (C D3 and C D7) clustered together, along with D7 passive ITP (P-ITP D7, recovered) samples (Figure 1B). Therefore, we combined the C D3 and C D7 samples to form a healthy platelet control proteome for further analyses. Thrombocytopenic ITP samples (P-ITP D3 and active ITP [A-ITP]) were separated from the rest (PC1), whereas the A-ITP IVIg samples were positioned closer to, but did not overlap the control or P-ITP D7 samples, suggesting that a normal platelet count may not reflect a complete proteome restoration after ITP induction (at the time points of the study and in the active model). PC2 distinguished both ITP models in the thrombocytopenic stage, showing that there were model-specific differences.
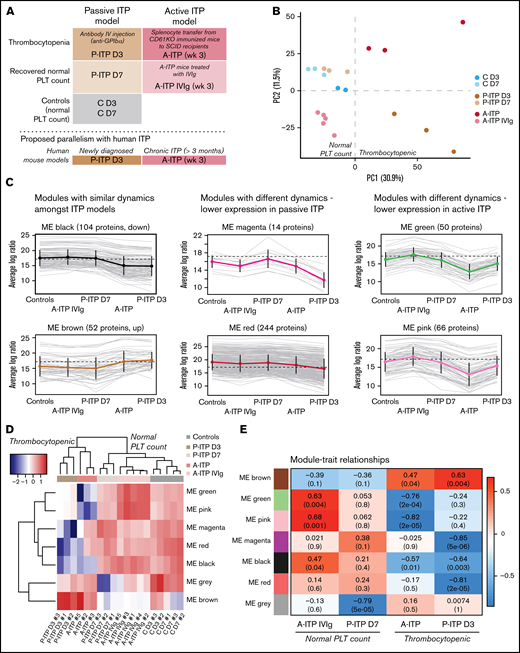
Experimental sample groups and proteome clustering. (A) Schematic representations of the preclinical mouse models of ITP and their respective study groups, and the proposed parallelism with human ITP. (B) PCA of the platelet proteomes (postadjustment data) from both ITP models, at the thrombocytopenic and recovered normal platelet-count stage, and controls. (C) Cluster profile for each expression module, grouped by their common dynamics. Each gray line represents 1 protein, and the thick colored line represents the average for all. (D) Eigen protein heat map and dendrograms. Eigen proteins for each module are calculated by singular value decomposition and can be seen as linear combinations of the actual module proteins. (E) Heat map showing the correlation between modules and each of the groups (except the control), where red and blue represent high and low correlations, respectively. Each cell is composed of the correlation coefficient and, in brackets, the corresponding P value. A-ITP samples shared the same most significant modules, green and pink, but in opposite directions, pointing to a recovery of the phenotype via IVIg treatment. In addition, both ITP groups correlated with the black module, indicating a potential global ITP signature. Distinctively, the P-ITP D3 group correlated with the magenta and red modules, and to a lesser extent, with the brown module. Last, the P-ITP D7 group was associated only with the gray module, which comprises the set of proteins that have not been clustered in any module. SCID, severe combined immunodeficiency.
Experimental sample groups and proteome clustering. (A) Schematic representations of the preclinical mouse models of ITP and their respective study groups, and the proposed parallelism with human ITP. (B) PCA of the platelet proteomes (postadjustment data) from both ITP models, at the thrombocytopenic and recovered normal platelet-count stage, and controls. (C) Cluster profile for each expression module, grouped by their common dynamics. Each gray line represents 1 protein, and the thick colored line represents the average for all. (D) Eigen protein heat map and dendrograms. Eigen proteins for each module are calculated by singular value decomposition and can be seen as linear combinations of the actual module proteins. (E) Heat map showing the correlation between modules and each of the groups (except the control), where red and blue represent high and low correlations, respectively. Each cell is composed of the correlation coefficient and, in brackets, the corresponding P value. A-ITP samples shared the same most significant modules, green and pink, but in opposite directions, pointing to a recovery of the phenotype via IVIg treatment. In addition, both ITP groups correlated with the black module, indicating a potential global ITP signature. Distinctively, the P-ITP D3 group correlated with the magenta and red modules, and to a lesser extent, with the brown module. Last, the P-ITP D7 group was associated only with the gray module, which comprises the set of proteins that have not been clustered in any module. SCID, severe combined immunodeficiency.
From the identified 1866 proteins, 544 were differentially expressed across all comparisons (supplemental Table 2). Weighted gene correlation analysis of differentially expressed proteins after dynamic tree cutting identified 10 coexpression clusters, which were reduced to 7 modules after cluster merging (supplemental Figure 1C). Cluster profiling of each module showed different dynamics across groups (Figure 1C). The gray module (not depicted) comprised proteins that do not cluster to any module. Sample clustering in the heat map of the module eigen proteins (Figure 1D) followed the PCA clustering (Figure 1B), where ITP samples in the thrombocytopenic stage, separate from controls and platelet-count–recovered respective samples, with the particularities mentioned earlier. The A-ITP IVIg samples, albeit closer to the control samples, have their own unique profile, pointing toward a partial recovery (or a persistent phenotype) of the platelet proteome after IVIg treatment. Furthermore, it showed that the ITP models possess common dynamics between them (black and brown modules), aside from their inherent, model-specific ones (green, pink, magenta, and red) (supplemental Table 3). These results were substantiated with module-trait correlation analyses performed against the control group (Figure 1E).
Functional and pathway enrichment analyses were performed module- and modelwise (shown in supplemental Figures 2 and 3; supplemental Table 4). Common to both models of ITP, the black module represented downregulated proteins that are involved in receptor signaling (Itgb1, Itgb3, Gp1ba, Gp1bb, Gp9, Clec1b (Clec2), Lyn, Src, Rac1, and Rap1a/b),8 metabolism (Ndufs, Acads, Aldh2, and Ak3),9,10 and exocytosis/endocytosis (Vamp3, Vps37b, Stx11/12, and Snap23).11 Upregulated proteins (brown module) were structural proteins, proteases (serpins)12 or immunomodulators (Orm1 and C1ra).13,14 It appears as if ITP platelets in general lose protein content through basal degranulation or vesiculation, and upregulated proteins are those of the structural components. Of note, upregulated proteins included histones, which could derive (potentially) from neutrophil extracellular traps or from megakaryocytes.15,16
Proteins linked to a more severe downregulation in P-ITP D3 samples (red and magenta modules) indicate significant dysfunction in the cytoskeleton compartment (Actb, Myh9, Capza’s, and Tubb’s),17 general metabolism (Pdi’s and Alox12),18,19 degranulation (Pf4, Mmrn1, Emilin1, Nbeal2, and vWF),20 and integrin signaling (Itga2b, Fermt3, Tln1, and Mylk; see also Figure 2A).21 Although these proteins are also downregulated in the A-ITP samples, they were markedly affected in the P-ITP D3 samples, suggesting that in chronic ITP there may be an accommodation or adaptation of the platelet phenotype as the disease progresses. These results suggest that the level of hyporesponsiveness related to platelet preactivation may be superior in P-ITP D3 platelets than in those from A-ITP mice.
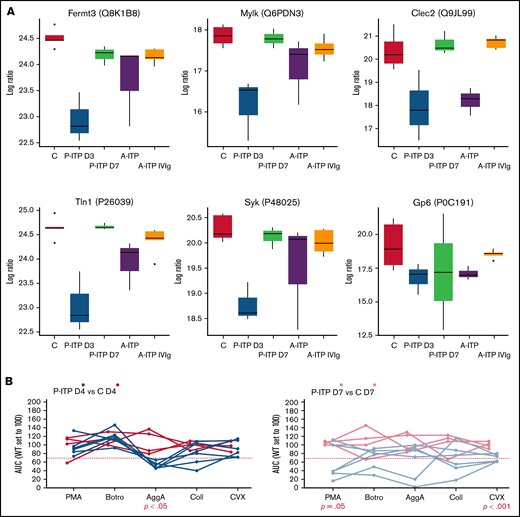
ITP affects specific platelet signalling pathways: proteomics and functional evidence. (A) Protein expression across ITP preclinical models of selected proteins and key players in hem-ITAM receptor (Gp6 and Clec2) signaling are represented. (B) Flow cytometry–based platelet aggregation assays were performed with platelets of the P-ITP model and respective controls at days 4 and 7 after platelet depletion. Studied single receptors by using the following agonists: PMA, botrocetin (Botro); aggretin A (AggA); collagen (Coll); convulxin (CVX). The area under the curve of each aggregation reaction was calculated and plotted after the average in control mice was set to 100, for each condition. The values obtained from platelets from the same mouse are joined by lines. At D4, P-ITP platelets had a homogeneous platelet aggregation profile, characterized by impairment toward AggA stimulation. At day 7, platelets from most of the mice showed a normal platelet aggregation profile, although not all mice had fully recovered platelets at that time point.
ITP affects specific platelet signalling pathways: proteomics and functional evidence. (A) Protein expression across ITP preclinical models of selected proteins and key players in hem-ITAM receptor (Gp6 and Clec2) signaling are represented. (B) Flow cytometry–based platelet aggregation assays were performed with platelets of the P-ITP model and respective controls at days 4 and 7 after platelet depletion. Studied single receptors by using the following agonists: PMA, botrocetin (Botro); aggretin A (AggA); collagen (Coll); convulxin (CVX). The area under the curve of each aggregation reaction was calculated and plotted after the average in control mice was set to 100, for each condition. The values obtained from platelets from the same mouse are joined by lines. At D4, P-ITP platelets had a homogeneous platelet aggregation profile, characterized by impairment toward AggA stimulation. At day 7, platelets from most of the mice showed a normal platelet aggregation profile, although not all mice had fully recovered platelets at that time point.
Proteins linked to a more severe downregulation in A-ITP samples (green and pink modules) showed a strong association with mitochondrial metabolism, impaired in the case of the A-ITP group, but recovered (partially) with IVIg treatment. On the one hand, the reduced levels of mitochondrial electron transport chain enzymes may induce overproduction of reactive oxygen species (although there are no signs of platelet damage or apoptosis) compromising platelet adenosine triphosphate synthesis,9 resulting in dysfunctional platelet activation. On the other hand, we cannot discard platelet mitochondria release, which has been reported as a bactericidal tool.10 Furthermore, strong downregulation of key proteins in the lineage, such as Pear1, Pecam1, and Stim1,8,22,23 appear unique to the chronic ITP stage.
Our results suggest that in ITP, platelets may be generally dysfunctional or hyporesponsive, probably because of the effects of basal activation and degranulation in the circulation. We performed platelet functional studies in P-ITP mice, which allowed for better monitoring of the timing of platelet count recovery and measured the platelet aggregation capacity toward 5 different agonists at days 4 and 7 after platelet depletion. Interestingly, results revealed a marked defect in the aggregation response upon aggretin A (AggA) stimulation (Clec2-mediated) in P-ITP D4 samples (Figure 2B) that was largely recovered in P-ITP D7 samples. These results are supported by the proteomics dynamics observed, as key players in the Clec2-mediated platelet aggregation, including Clec2 itself, are downregulated at D3 and recovered in P-ITP D7 platelets (Figure 2A). Of note, not all P-ITP D7 mice displayed a balanced platelet aggregation profile at that time point, suggesting that a longer period may be necessary for full recovery of platelet function (Figure 2B), which can be seen by the variation in the expression levels of other proteins, such as the other hem-ITAM receptor Gp6, which may affect responses toward other agonists, such as collagen or convulxin.
Furthermore, another level to consider is the “age” of the platelets analyzed in each model at the thrombocytopenic or recovered-platelet-count stages. The pathological dynamics of platelet clearance and platelet production in ITP may affect their quality and function, as well as their turnover. Interestingly, the mitochondrial defects we observed in active ITP are comparable to aging platelets.24 Noteworthy, a slower turnover of platelets has been reported in patients with ITP,25 which may be the reason behind the proteome differences identified in our active ITP model, characterized hypothetically by circulating older and hyporeactive platelets.
A previous proteomics analysis of bone marrow megakaryocytes showed the downregulation of 5 apoptosis-related proteins (HSPA6, HSPA8, ITGB3, YWHAH, and PRDX6) in patients with newly diagnosed ITP with no treatment.26 Four of those proteins (HSPA6 is not found in mice) are also differentially downregulated in P-ITP D3 samples, which we propose to be equivalent to newly diagnosed ITP. These data support the notion that, in addition to proteomic alterations caused in the circulation, some of the protein dynamics observed may occur at the megakaryocyte level. Another proteomics study achieved results similar to ours, but associated the resulting proteins to autophagy.27
Interestingly, treatment of ITP with fostamatinib, a Syk inhibitor, is more effective for platelet count recovery and results in less bleeding events when implemented as second line treatment, when compared with third or later lines of treatment28 (ie, chronic ITP). We observed downregulation of Syk in P-ITP D3 platelets (ie, acute) and partial restoration in A-ITP (ie, chronic). Extrapolated to humans, our results may explain why fostamatinib is safer in terms of bleeding as a second line treatment. It does not affect platelet functionality through Syk inhibition, because it is already downregulated in newly diagnosed ITP. However, variation in Syk levels in chronic ITP may result in an increased risk of bleeding events and reduced clinical responses.
Of note, differences related to blood collection methods and anticoagulation among the models, despite stringent data adjustment, may still impact our analysis. Our results have not yet been validated with orthogonal assays or by performing mass spectrometry analysis with independent experimental sets (that could account for the differences), which is a limitation to consider. However, our results highlight the potential of applying platelet proteomics in profiling human ITP. Validation of our data in humans will broaden the knowledge of the disease and may result in the identification of biomarkers that will improve tailored patient management.
Acknowledgments
This work was partially supported by the Center for Translational Molecular Medicine (http://www.ctmm.nl), project Innovative Coagulation Diagnostics (INCOAG, grant 01C-201), and the Dutch Heart Foundation (M.M. and I.M.D.C.); an RYC fellowship (RYC-2013-12587, Ministerio de Economía y Competitividad, Spain) and an I+D 2017 grant (SAF2017-85489-P, Ministerio de Ciencia, Innovación y Universidades, Spain and Fondos FEDER) (L.G.); and Severo Ochoa Grant (PA-20-PF-BP19-014, Consejería de Ciencia, Innovación y Universidades del Principado de Asturias, Spain) (P.M.-B.). J.A.E. is supported by the Interdisciplinary Center for Clinical Research (IZKF) of University of Münster (grant IZKF: Ebl4/009/21).
Authorship
Contribution: P.M.-B. analyzed the data and wrote the manuscript; M.M. and I.M.D.C. performed the experiments; J.A.E. provided reagents and critically reviewed the manuscript; J.W.S. performed the experiments and critically reviewed the manuscript; and L.G. designed the experiments, analyzed the data, and wrote the manuscript.
Conflict-of-interest disclosure: The authors declare no competing financial interests.
Correspondence: Laura Gutiérrez, Platelet Research Laboratory, Avenida de Roma S/N, 33011 Oviedo, Spain; e-mail: gutierrezglaura@uniovi.es.


