

Key Points
We show that the novel KCNN4 variant p.S314P is a gain-of-function mutation but is less severe than the previously reported p.R352H variant.
The clinical heterogeneity, blurred symptoms, and absence of specific diagnostic markers make the diagnosis of Gardos channelopathy challenging.
Introduction
The Gardos channel (hSK4, KCa3.1, KCNN4) was the first ion channel described in human red blood cells (RBCs), and its physiological function was mainly associated with cell death and volume homeostasis.1 An adaptive function of the Gardos channel when RBCs pass capillaries or constrictions has only recently evolved.2-4 Mutations in both the Gardos and the Piezo1 channels reportedly contribute to hereditary stomatocytosis.5-10
However, differences in clinical features and in RBC properties caused by mutations in these 2 channels prompt us and others to consider Gardos channelopathy as an independent disease.8-10 In fact, the majority of KCNN4 variants, falling near the calmodulin-binding site at different residues, lack clear signs of RBC dehydration, with a normal ektacytometry curve. Only p.V282M/E variants, reported in 2 isolate families,6,11,12 exhibit clear dehydration with a typical left-shifted ektacytometry curve similar to patients with PIEZO1 mutations.
Here we present a novel KCNN4 pathogenic variant (p.S314P). We characterized hematologic and functional parameters of patients from 2 unrelated families carrying this mutation. The intrafamily variability of clinical presentation, presence of blurred symptoms, and absence of specific diagnostic markers other than genotyping underline the diagnostic challenge of this disorder.
Case description
We report 2 unrelated Italian families with congenital hemolytic anemia of unknown origin and heterogeneous clinical presentation.
In family A, the proband (AIII.1) was studied at the age of 3 years for normocytic hemolytic anemia and received a suspected diagnosis of adenylate kinase deficiency based on enzymatic assay, not fully confirmed at the molecular level. The father (AII.1) displayed microcytic hemolytic anemia since infancy and was diagnosed as thalassemic trait due to mutations β39 and deletion α-3.7.
In family B, the proband (BII.2) had a previous diagnosis of hereditary spherocytosis not corrected by splenectomy; her mother (BI.1) was known to have microcytic anemia since childhood, and her twin sons were found to have silent hemolytic anemia during a family study at the age of 12 years. Moreover, a cousin of the proband was referred as being affected by congenital dyserythropoietic anemia type II.
Clinical and hematologic parameters are reported in detail in the supplemental Material.
Methods
A targeted next-generation sequencing (NGS) panel containing 40 genes causing hereditary hemolytic anemias was used to identify the underlying genetic cause in the patients. Ektacytometry Osmoscan analysis, Percoll gradients, and patch clamp analysis were performed as previously described.10,13,14 Measurement of the transmembrane potential was performed by incubating the RBCs with a proton ionophore in an unbuffered solution, and the pH value of the suspension was measured as initially introduced by Macey et al.15
The study was approved by the Ethical Committee of Fondazione IRCCS Ca’ Granda Ospedale Maggiore Policlinico Milan (Area 2-Milan-N. 606_2013). Detailed methods are given in the supplemental Material.
Results and discussion
A new heterozygous KCNN4 variant (NM_002250.2; c.940T>C; p.S314P) was detected in all the affected cases (Figure 1A-B) by NGS analysis and confirmed by Sanger sequencing. The mutation was not previously found in the Genome Aggregation Database (GnomAD) and 1000 Genomes Projects and was predicted in silico to be likely pathogenic (pathogenic moderate [PM2], pathogenetic supporting [PP1 and PP4], following American College of Medical Genetics and Genomics guidelines).16 It falls into the calmodulin-binding domain, affecting a highly conserved residue. NGS analysis did not show other abnormalities that may justify the clinical phenotype.
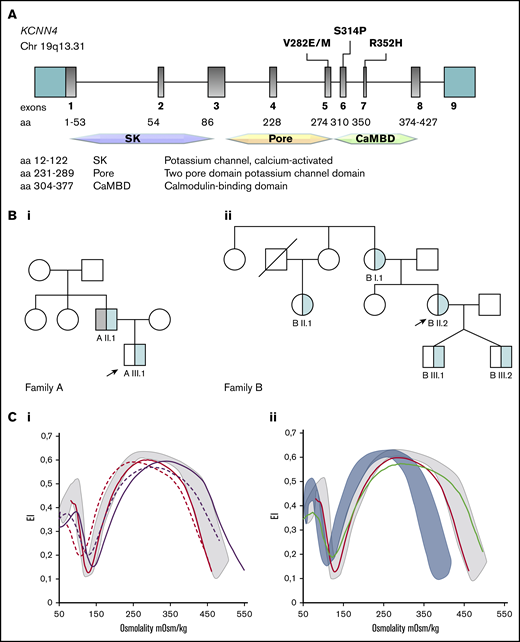
A new KCNN4 pathogenic variant and different Osmoscan curves in Gardos channelopathy and PIEZO1 hereditary xerocytosis. (A) Schematic representation of the KCNN4 gene and functional domains of the protein with the position of the variants associated with Gardos channelopathy. Family trees of family A (Bi) and family B (Bii); arrows indicate the index cases, light blue represents KCNN4 p.S314P mutation, and gray indicates HBB c.188 C>T, p.Q39X, and α −3.7del variants corresponding to thalassemic trait. (Ci) Osmoscan curve of patients AIII.1 (red solid line), AII.1 (red dashed line), BI.1 (purple solid line), and BII.2 (purple dashed line), compared with healthy control subjects (gray area). (Cii) Osmoscan curves of patient AIII.1 carrying the p.S314P variant (red line) and a patient with KCNN4 p.R352H mutation (green line) compared with healthy control subjects (gray area) and 10 patients carrying missense mutations in the PIEZO1 gene (light blue area).
A new KCNN4 pathogenic variant and different Osmoscan curves in Gardos channelopathy and PIEZO1 hereditary xerocytosis. (A) Schematic representation of the KCNN4 gene and functional domains of the protein with the position of the variants associated with Gardos channelopathy. Family trees of family A (Bi) and family B (Bii); arrows indicate the index cases, light blue represents KCNN4 p.S314P mutation, and gray indicates HBB c.188 C>T, p.Q39X, and α −3.7del variants corresponding to thalassemic trait. (Ci) Osmoscan curve of patients AIII.1 (red solid line), AII.1 (red dashed line), BI.1 (purple solid line), and BII.2 (purple dashed line), compared with healthy control subjects (gray area). (Cii) Osmoscan curves of patient AIII.1 carrying the p.S314P variant (red line) and a patient with KCNN4 p.R352H mutation (green line) compared with healthy control subjects (gray area) and 10 patients carrying missense mutations in the PIEZO1 gene (light blue area).
RBC deformability and hydration state were assessed by ektacytometry in both families. In all the patients analyzed (AIII.1, AII.1, BI.1, and B2.II), Osmoscan curves were close to that of healthy control subjects (Figure 1Ci). The father (AII.1) displayed a slight left shift of the curve due to the β-thalassemic trait. Patient BII.2 showed a slight decrease in the maximum elongation index (EImax) and an increased minimum elongation index (EImin) attributable to the effect of splenectomy.13
Together, these data suggest that RBC deformability in these patients was not compromised despite the abnormal morphologic appearance (Figure 1; supplemental Table 1), similarly to what was already reported for all the other KCNN4 variants with the exception of the p.V282M mutation,12 and it was clearly different from that observed in patients with hereditary stomatocytosis due to PIEZO1 mutations (Figure 1Cii). Additional evidence further confirming the different nature of these 2 disorders comes from a recent study comparing clinical features of 6 families with KCNN4 mutations and 49 with PIEZO1 mutations. Although the 2 diseases share anemia, iron overload, and inefficient splenectomy, patients with KCNN4 mutations exhibited more severe hemolysis, with no clear signs of RBC dehydration and no increased thrombotic risk after splenectomy.9
The functional assessments as discussed here were performed on patients AII.1 and AIII.1, with coherent results (family B was not available for further studies). However, due to the complex genotype of patient AII.1 (HBB, HBA, and KCNN4 variants), which makes it difficult to differentiate the effects of single mutations on cellular properties, results are presented on patient AIII.1.
Percoll density gradient separation revealed a clearly higher density than control RBCs for all fractions (Figure 2A) and substantially higher heterogeneity in density. These findings indicate dehydration of a fraction, but not all cells, and thus an increased Gardos channel activity in them. Furthermore, Gardos channel activity was directly evaluated by measuring membrane potential changes induced by Gardos channel activation using the method of Macey et al15 (Figure 2B) and by measuring whole-cell currents by patch clamp analysis (Figure 2C). The maximal channel activity was tested after stimulating the cells with the Ca2+-ionophore A23187 in the presence of 4 µM extracellular Ca2+. Figure 2Bi shows that resting membrane potential and the level of hyperpolarization induced by full activation of the Gardos channel (and sudden K+-conductance induced in this way) are not affected in RBCs with the p.S314P mutation. Nevertheless, the scenario is different when cells are stimulated with the activator NS30917 (NeuroSearch A/S, Ballerup, Denmark), which increases the Ca2+ sensitivity of the channel. Addition of NS309 (100 µM) leads to a submaximal stimulation of the Gardos channel with a hyperpolarization similar to that obtained with A23187. This higher reactivity was observed for all the concentrations of NS309 tested (10, 50, and 100 µM) (Figure 2Bii-iv). Indeed, whereas 100 µM of NS309 allows only slight hyperpolarization development when applied to control cells, 10 µM induces significant hyperpolarization in p.S314P-mutated cells. Such results indicate that either mutated p.S314P Gardos channels are intrinsically more sensitive to calcium than normal channels, or intracellular Ca2+ concentration is originally higher in p.S314P cells compared with control cells, or both.
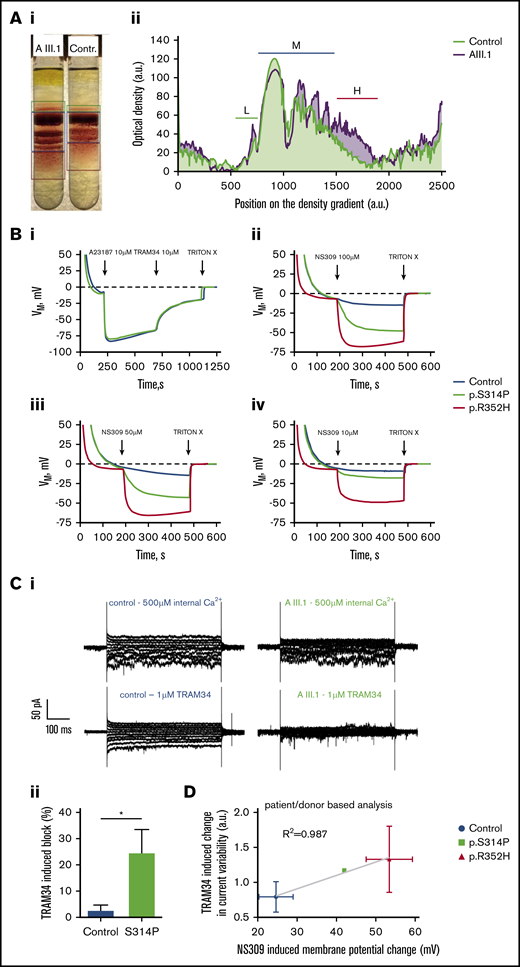
Functional tests of the new Gardos channel mutation p.S314P and relation to the mutation p.R325H. (A) Percoll density centrifugation of a blood sample from patient AIII.1 compared with a control subject. A methodologic description is given in the supplemental Material. (Ai) Image of the centrifuged tubes. (Aii) Profile of the cell distribution derived from intensity-based analysis of the image shown in panel Aa. Distance zero refers to light cells on top of the tube, and distance 2500 refers to the lowest measurable position in the tube. Low-density (L), medium-density (M), and high-density (H) fractions are marked with green, dark blue, and red bars, respectively. (B) Membrane potential measurements in RBC suspensions using the carbonyl cyanide-m-chlorophenylhydrazone method reported by Macey et al.15 A detailed description is provided in the supplemental Material. (Bi) Within approximately 3 minutes, RBCs reach an equilibrium at the RBC resting membrane potential of −10 mV. When the Ca2+ transporter A23187 at a concentration of 10 µM in the presence of 4 μM Ca2+ is added (equivalent to full Gardos channel activation), membrane potential drops immediately to approximately −80 mV due to the induced K+-conductance. Repolarization is accelerated when 10 µM of the Gardos channel inhibitor TRAM34 is added. Upon addition of TRITON X-100, which lyses the RBCs, a membrane potential no longer exists (0 mV). Here, mutated cells (KCNN4 p.S314P) react the same as healthy RBCs. (Bii) Within approximately 3 minutes, added RBCs reach an equilibrium at the RBC resting membrane potential of −10 mV. When 100 µM of the Gardos channel activator NS309 is added, the membrane potential of the healthy RBCs drops to approximately −15 mV, whereas in the mutated cells, the membrane potential reaches almost −50 mV (p.S314P) and −70 mV (p.R352H), hinting to gain-of-function mutations in both variants. At the end, TRITON X-100 is added to get the 0 mV calibration. Panels Biii and Biv are experiments performed in analogy to panel Bb but with the addition of 50 µM and 10 µM NS309, respectively. Blue lines represent normal control, green lines p.S414P mutated cells, and red lines p.R352H KCNN4 variant. (C) Whole-cell recordings of the Gardos channel currents from RBCs of a healthy subject and patient AIII.1 (p.S314P). A detailed methodologic description is presented in the supplemental Material. Currents were elicited by voltage steps from −130 mV to 50 mV for 500 ms in 20 mV increments at Vh = −30 mV and recorded in the absence and after application of 1 μM TRAM34, a specific Gardos channel blocker. (Ci) Raw current traces from a healthy subject’s RBCs in the absence (top left) and in the presence (bottom left) of 1 μM TRAM34 as indicated above the recordings. For comparison, raw current traces from the patient’s RBCs in the absence (top right) and in the presence (bottom, right) of 1 μM TRAM34 as indicated above the recordings. Note that in this particular example, the background current in the healthy control subject is higher than in patient AIII.1. (Cii) Comparison of the percent block by 1 μM TRAM34 of the mean currents at −110 mV in the healthy and mutated RBCs. Significance was checked based on an unpaired Student t test, *P < .05. (D) Correlation of TRAM34-induced change in current variability vs NS309-induced membrane potential change for healthy controls and cells with mutations p.S314P and p.R352H. The statistical values are patient based. Values of p.S314P variant are taken from panels B and C. Patch clamp recordings of p.R352H are from Fermo et al10 (n1 = 23 cells) and 2 additional patients (n2 = 9 cells; n3 = 7 cells). NS309-induced potential changes were measured in three p.R325H patients (exemplified in panel Ca).
Functional tests of the new Gardos channel mutation p.S314P and relation to the mutation p.R325H. (A) Percoll density centrifugation of a blood sample from patient AIII.1 compared with a control subject. A methodologic description is given in the supplemental Material. (Ai) Image of the centrifuged tubes. (Aii) Profile of the cell distribution derived from intensity-based analysis of the image shown in panel Aa. Distance zero refers to light cells on top of the tube, and distance 2500 refers to the lowest measurable position in the tube. Low-density (L), medium-density (M), and high-density (H) fractions are marked with green, dark blue, and red bars, respectively. (B) Membrane potential measurements in RBC suspensions using the carbonyl cyanide-m-chlorophenylhydrazone method reported by Macey et al.15 A detailed description is provided in the supplemental Material. (Bi) Within approximately 3 minutes, RBCs reach an equilibrium at the RBC resting membrane potential of −10 mV. When the Ca2+ transporter A23187 at a concentration of 10 µM in the presence of 4 μM Ca2+ is added (equivalent to full Gardos channel activation), membrane potential drops immediately to approximately −80 mV due to the induced K+-conductance. Repolarization is accelerated when 10 µM of the Gardos channel inhibitor TRAM34 is added. Upon addition of TRITON X-100, which lyses the RBCs, a membrane potential no longer exists (0 mV). Here, mutated cells (KCNN4 p.S314P) react the same as healthy RBCs. (Bii) Within approximately 3 minutes, added RBCs reach an equilibrium at the RBC resting membrane potential of −10 mV. When 100 µM of the Gardos channel activator NS309 is added, the membrane potential of the healthy RBCs drops to approximately −15 mV, whereas in the mutated cells, the membrane potential reaches almost −50 mV (p.S314P) and −70 mV (p.R352H), hinting to gain-of-function mutations in both variants. At the end, TRITON X-100 is added to get the 0 mV calibration. Panels Biii and Biv are experiments performed in analogy to panel Bb but with the addition of 50 µM and 10 µM NS309, respectively. Blue lines represent normal control, green lines p.S414P mutated cells, and red lines p.R352H KCNN4 variant. (C) Whole-cell recordings of the Gardos channel currents from RBCs of a healthy subject and patient AIII.1 (p.S314P). A detailed methodologic description is presented in the supplemental Material. Currents were elicited by voltage steps from −130 mV to 50 mV for 500 ms in 20 mV increments at Vh = −30 mV and recorded in the absence and after application of 1 μM TRAM34, a specific Gardos channel blocker. (Ci) Raw current traces from a healthy subject’s RBCs in the absence (top left) and in the presence (bottom left) of 1 μM TRAM34 as indicated above the recordings. For comparison, raw current traces from the patient’s RBCs in the absence (top right) and in the presence (bottom, right) of 1 μM TRAM34 as indicated above the recordings. Note that in this particular example, the background current in the healthy control subject is higher than in patient AIII.1. (Cii) Comparison of the percent block by 1 μM TRAM34 of the mean currents at −110 mV in the healthy and mutated RBCs. Significance was checked based on an unpaired Student t test, *P < .05. (D) Correlation of TRAM34-induced change in current variability vs NS309-induced membrane potential change for healthy controls and cells with mutations p.S314P and p.R352H. The statistical values are patient based. Values of p.S314P variant are taken from panels B and C. Patch clamp recordings of p.R352H are from Fermo et al10 (n1 = 23 cells) and 2 additional patients (n2 = 9 cells; n3 = 7 cells). NS309-induced potential changes were measured in three p.R325H patients (exemplified in panel Ca).
Figure 2Ci displays representative whole-cell current traces with 500 µM intracellular Ca2+ to activate the Gardos channel and after application of 1 µM TRAM34 to inhibit it. Statistical analysis shows that the amount of blocked current is higher in the mutated cells compared with healthy RBCs (Figure 2Cii).
Furthermore, we correlated for healthy control, p.S314P, and p.R352H (the most common KCNN4 variant, tested on 3 different patients) the NS309 sensitivity in membrane potential measurements and the current variability in TRAM34-based patch clamp measurements (Figure 2D). A good correlation (R2 = 0.99) was observed between 2 different and independent experimental approaches. All panels of Figure 2 indicate that p.S314P is also a gain-of-function mutation, although slightly less severe compared with p.R352H (Figure 2B-D).
Our data enforce the hypothesis that Gardos channelopathy due to calmodulin-binding site variants differs from PIEZO1 hereditary xerocytosis in molecular mechanisms and diagnostic features, and may require differential treatment. Further investigations are required to elucidate PIEZO1/KCNN4 molecular interactions in cell volume homeostasis3,18 and in particular the role of the intracellular calcium.10
Although the complexity of genotype detected in family A may explain the observed clinical variability, this is not the case in family B, whose members displayed only the p.S314P KCNN4 variant, and present clinical phenotypes in line with what was reported in larger cohorts of patients with KCNN4 mutations.8,9 Despite this, 3 of the 5 affected members received an incorrect diagnosis, and in 2, anemia was not suspected until 12 years of age, with the possible consequence of unrecognized iron accumulation in adulthood.
The new variant was submitted to the ClinVar database (accession number SCV001433005).
Acknowledgments
The study was supported by the European Framework Horizon 2020 under grant agreement number 860436 (EVIDENCE) and by Fondazione IRCCS Ca’ Granda Policlinico Milano, project number RC2020 175/05. This work is generated within the European Reference Network on Rare Hematological Diseases (ERN-EuroBloodNet), FPA no. 739541.
Authorship
Contribution: E.F., P.B., and L.K. were responsible for study design and preparation of the draft; E.F., P.B., and A.P.M. performed patients’ diagnostic evaluations and NGS molecular analyses; D.M.-A., L.P., G.B., and S.E. performed the Gardos channel functional tests via the carbonyl cyanide-m-chlorophenylhydrazone method; P.P.-K. and L.K. performed the Gardos channel functional tests via patch clamp evaluation; A.M. and A.B. performed the RBC density evaluation; F.L., G.G., and W.B. were responsible for patient follow-up; and all authors contributed to the critical revision of the manuscript.
Conflict-of-interest disclosure: The authors declare no competing financial interests.
Correspondence: Paola Bianchi, UOS Fisiopatologia delle Anemie, UOC Ematologia, IRCCS Fondazione Ca’ Granda Ospedale Maggiore Policlinico Milano, Via F Sforza, 35, 20122 Milan, Italy; e-mail: paola.bianchi@policlinico.mi.it.


