
Abstract
In patients with acute lymphoblastic leukemia (ALL), treatment response is increasingly evaluated with minimal residual disease (MRD) assays. ALL cells can be recognized by their clonal rearrangement of immunoglobulin and T-cell receptor genes, expression of gene fusions, and leukemia-associated immunophenotypes. Assays based on polymerase chain reaction or flow cytometry can detect one ALL cell among 10,000 to 100,000 normal cells in clinical samples. The vast majority of cases have antigen-receptor gene rearrangements and leukemia immunophenotypes for MRD monitoring; about half of the cases currently have suitable gene fusions. The clinical significance of MRD has been conclusively demonstrated in both childhood and adult ALL. In most studies, MRD positivity is defined by the presence of 0.01% or more ALL cells; the risk of relapse is generally proportional to the level of MRD, particularly when measured during or at the end of remission-induction therapy. The prevalence of MRD during early therapy differs among genetic and biologic ALL subtypes. However, being a measurement of drug resistance in vivo and reflecting multiple cellular, host, and treatment variables, MRD is typically an independent prognostic factor. MRD is now used in several clinical trials for risk assignment and to guide clinical management overall. The time points at which MRD testing is performed and the threshold levels that trigger treatment intensification vary according to the methodology available, the results of preclinical correlative studies, and protocol design.
Rationale
A tenet of the clinical management of patients with acute lymphoblastic leukemia (ALL) is that intensity of treatment should be commensurate with aggressiveness of the disease. Thus, hematologists have strived to identify prognostic factors that could predict relapse, introducing the most reliable ones in clinical protocols for “risk-adapted” therapy. Presenting clinical and biologic features are widely used, but their association with relapse is generally not perfect and varies as treatment evolves. A slow clearance of leukemic cells by the initial course of chemotherapy, as measured by the morphologic analysis of peripheral blood or bone marrow smears 1 to 3 weeks from diagnosis, predicts a higher risk of relapse, but can be inaccurate because ALL blast cells are remarkably similar in appearance to bone marrow lymphoid precursors (alias hematogones) and, in some instances, to mature lymphocytes.
The first demonstration that bone marrow samples apparently devoid of ALL cells may, in fact, contain measurable levels of leukemia (ie, “minimal residual disease” or MRD) was provided soon after the advent of polyclonal antisera against leukocyte antigens: combinations of cell markers were used to distinguish T-lineage ALL cells from normal immature and mature lymphocytes by immunofluorescence microscopy.1 Over the following three decades, the quest for MRD investigators was to take MRD studies to the clinic. Central to this process were the development of sensitive and reliable methods that can be used to study MRD in virtually all patients with ALL, and the demonstration of the independent predictive power of MRD in correlative studies with treatment outcome (reviewed in Campana2 ).
Methodologic Principles of MRD Assays for ALL
Antigen-Receptor Gene Rearrangements
During B-cell development, the V, D, and J segments of the immunoglobulin genes are rearranged, with deletion and random insertion of nucleotides at the junctional sites, generating a unique gene sequence for each cell and its progeny. The genes encoding the components of the T-cell receptors undergo a similar process in T-cell precursors. Because ALL cells arise from the oncogenic transformation of a single lymphoid precursor, they have clonal antigen-receptor (immunoglobulin and/or T-cell receptor) gene rearrangements in most cases, which can be used to distinguish ALL cells from normal lymphoid cells (expressing gene rearrangements with different sequences) and nonlymphoid cells (lacking the rearrangements).3 As expected, immunoglobulin gene rearrangements are predominant in B-lineage ALL, whereas T-cell receptor gene rearrangements are predominant in T-lineage ALL. Because ALL cells maintain recombination activity, T-cell receptor gene rearrangements can also be found in up to 90% of B-lineage ALL cases, and immunoglobulin gene rearrangements can be found in about 20% of T-lineage ALL.3
For MRD studies, the specific rearrangements must be sequenced in each case upfront. One of the most common approaches involves an initial screening of diagnostic (or relapse) DNA using polymerase chain reaction (PCR) with primers matched to the V and J regions of the various antigen-receptor genes to determine if rearrangements are present, and heteroduplex analysis to establish their clonality.4 If clonal, the ALL-derived PCR product is then sequenced to define the junctional regions of the rearranged gene, and the sequence is used to design allele-specific oligonucleotides.4 The optimal PCR conditions are then established and applied to analyze mononuclear cells from specimens collected during therapy for MRD determination. Quantitation of MRD is most frequently performed by using “real-time” quantitative PCR (RQ-PCR),4 with parallel tests using mixtures of diagnostic leukemic and normal DNA to gauge the sensitivity of the assay. An alternative to the patient-specific primer approach is the identification of clonal rearrangements by their size.3 The PCR peak corresponding to rearrangement in ALL cells is identified in remission samples by comparison with that obtained at diagnosis. This is a rapid and practical method, but sensitivities rarely surpass 0.1%.
In the ALL 2000 trial of the Associazione Italiana Ematologia Oncologia Pediatrica (AIEOP) and Berlin-Frankfurt-Munster (BFM) groups, only 88 (3%) of the 3341 diagnostic samples examined lacked suitable gene rearrangements for PCR analysis, whereas an additional 217 (7%) had sequences not sufficiently distinct to reach a sensitivity of 0.01%.5 In a study performed at St. Jude Children's Research Hospital, 475 of 539 (88.1%) bone marrow samples from patients with newly diagnosed B-lineage ALL had clonal rearrangements suitable for PCR monitoring of MRD with a sensitivity of at least 0.001%.6 In a study of the German Multicenter Study Group for Adult ALL (GMALL), 21 (7%) of 290 high- and standard-risk adult ALL patients had no clonal marker, and an additional eight patients (3%) had markers not suitable for MRD quantification.7 Thus, sensitive MRD studies targeting antigen-receptor genes can be performed in the vast majority of patients. Because antigen-receptor genes might undergo continuing rearrangements, subclones with distinct sequences could be undetected at diagnosis, but become predominant later. Thus, it has been recommended to monitor two or more different rearrangements.4 This policy, however, is likely to be too stringent, because it would reduce the number of patients amenable to MRD monitoring (71% of patients had two sensitive targets in the AIEOP-BFM ALL 2000 study),5 and productive MRD studies can be performed, even in cases where there is only one suitable gene rearrangement. In these cases, the use of another MRD assay (flow cytometry or gene fusion PCR) in tandem with antigen-receptor gene PCR, may help reduce the risk of false-negative results.
Gene Fusions
ALL cells also carry genetic abnormalities that can be used to recognize them among healthy cells. The most widely used for MRD detection are gene fusions, such as BCR-ABL1, MLL-AFF1, TCF3-PBX1, and ETV6-RUNX1, resulting in the expression of aberrant mRNA transcripts. Recurrent abnormalities suitable for routine MRD studies in clinical samples are present in approximately 40% of children and adults with ALL.2,3 Among more recently identified abnormalities that could, in principle, be used for monitoring MRD, are gene fusions involving CRLF2 (eg, IGH@-CRLF2 and P2RY8-CRLF2). These are present in about 15% of adult ALL and in high-risk pediatric B-lineage ALL cases that lack traditional gene fusions, as well as in approximately half of patients with ALL associated with Down syndrome.8,9
PCR studies targeting gene fusions do not require the laborious sequencing, patient-specific primer synthesis, and standardization steps involved with antigen-receptor gene rearrangements because fixed sets of primers can be applied to all cases with a given gene fusion.10 Other strengths of this method are the stable association between gene fusion and the leukemic clone, with a potential for detecting preleukemic cells. Contrary to PCR studies with antigen-receptor genes that rely on DNA, PCR studies of gene fusions typically (although not always) start from mRNA because the breakpoints of the gene fusions commonly targeted in ALL can occur over large DNA segments in different patients.10 Thus, a reverse transcription step is required to generate the cDNA for PCR analysis, and the number of target gene copies must be normalized using a ubiquitously expressed housekeeping gene as a reference, with the number of chimeric transcripts expressed as a ratio of the number of copies of the reference gene transcripts.10 The use of mRNA introduces two potential complications. First, it is more prone to degradation than DNA. Second, the amount of transcript in patients with the same genetic subtype of ALL and each cell of the same clone may be variable.10 Therefore, even with RQ-PCR, quantitation of MRD by this method typically lacks the precision achieved when antigen-receptor genes are targeted. In principle, a 0.001% sensitivity is achievable but, in practice, 0.01% is more common.
Immunophenotypes
ALL cells express cell markers that clearly disclose their origin as B- or T-lymphoid precursors.2 Because the latter reside in the thymus and do not circulate, the expression of cell markers characteristic of T-cell progenitors is sufficient to identify T-lineage ALL cells in blood or bone marrow. B-cell progenitors reside in the bone marrow, but are generally absent during the first 2–3 weeks of remission induction therapy, owing to their extreme sensitivity to chemotherapy.11 In this case, immature B-cell markers can be sufficient for measurements of treatment response.11 Nevertheless, at any other time point during treatment, additional markers must be used to differentiate normal and leukemic B cells. Because the leukemogenic process results in “asynchronous” or “aberrant” expression of cell markers, leukemia-associated composite immunophenotypes can be identified in more than 95% of B-lineage ALL cases.2
Leukemia-associated immunophenotypes are recognized by flow cytometry. The instruments used in many of the published MRD studies allowed the detection of four markers at the most, but current instruments extend this range to eight or more markers. This enhanced capability facilitates the discrimination between normal and leukemic cells, has the potential for increasing the sensitivity of MRD detection, and also allows the study of biologic features of MRD cells, such as expression of molecules related to proliferation, apoptosis, signaling, and drug resistance.2 Leukemia-associated immunophenotypes must be identified at diagnosis in each case by comparing the cell marker profile of leukemic blasts to that of reference bone marrow samples, including those from patients receiving or recovering from chemotherapy. In principle, it should be possible to attempt MRD studies without prior knowledge of the immunophenotype of the leukemic cells, by using large panels of antibody combinations, but a negative MRD result would be difficult to interpret. Transient fluctuations in cell marker profile may occur during chemotherapy,12 although the confounding effect of these on data interpretation can be minimized by using multiple sets of markers in each case. Flow cytometry has a routine sensitivity of detection of 0.01%. It is critical to analyze a sufficient number of cells (eg, 100,000 mononuclear cells) for each antibody combination; 2 mL of bone marrow or 5 to 10 mL of peripheral blood typically provide sufficient cells for multiple tests. Of the 2143 patients with B-lineage ALL enrolled on 9900 series treatment protocols of the Children's Oncology Group (COG), a test with the sensitivity of at least 0.01% on day 29 could be performed in 92% of patients.13 In the St Jude Total XV study, MRD could be monitored by flow cytometry, with a 0.01% sensitivity in 482 of 492 patients (98%).14
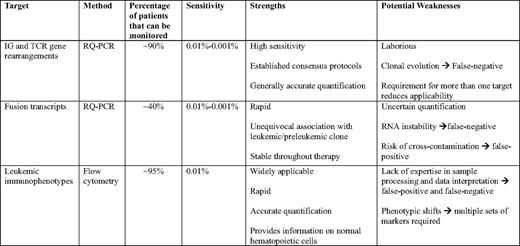
Flow cytometry and PCR amplification of antigen-receptor genes yield remarkably similar measurements, if MRD is present at a ≥ 0.01% level.15,16 Thus, we regard these methods as complementary, each with specific strengths and potential weaknesses (Table 1). In the St Jude Total XV trial, the two methods in combination could be applied to study 491 of 492 patients (99.8%).14 The single patient with no available immunophenotypic or antigen-receptor gene rearrangements had a MLL gene fusion and was monitored by RQ-PCR using that marker. In our current Total XVI trial, we preferentially use flow cytometry, reserving PCR amplification of antigen-receptor genes (or gene fusions) to cases where immunophenotypes for reliable and sensitive monitoring of MRD are not identifiable.
Clinical Significance of MRD
Childhood ALL
MRD tests during the early phases of treatment provide crucial prognostic information in children and adolescents with newly diagnosed ALL (reviewed in Campana2 ). In fact, MRD often nullifies the prognostic impact of presenting clinical and biologic parameters and of morphologic estimates of treatment response. For example, a study of 3184 B-lineage ALL patients enrolled in the AIEOP-BFM ALL 2000 protocol demonstrated that a risk classification algorithm based on MRD measurements by PCR amplification of antigen-receptor gene rearrangements on days 33 and 78 of treatment was superior to that of previous stratification criteria based on leukocyte count, age, early response to prednisone, and genetic subtype.17 Other recent studies also pointed to the predictive value of MRD for otherwise homogeneous subgroups of ALL patients, such as infants,18 and those with intrachromosomal amplification of chromosome 21.19
Within a particular clinical protocol, poorer clearance of the disease as reflected by higher MRD levels at a certain time point is generally associated with a proportional increase of the risk of relapse. For example, in a study by flow cytometry in 815 patients from the AIEOP group,20 MRD on day 15 was less than 0.1% in 42% of patients, between 0.1% and 10% in 47% and 10% or more in 11%; 5-year cumulative incidence of relapse was 7.5%, 17.5%, and 47.2%, respectively. A commonly used cutoff level to define MRD positivity is 0.01%. Patients who attain MRD less than 0.01% early during therapy have high odds to remain in continuous complete remission with contemporary postremission therapy. Thus, in our early study with patients enrolled in the Total XIII study, those with rapid leukemia cell clearance (ie, MRD <0.01% on day 19 of treatment; 46%) had a 5-year cumulative incidence of relapse (± SE) of 6.0% (± 3.4%).21 Similarly, in the AIEOP-BFM ALL 2000 study, patients with MRD less than 0.01% on day 33 (42%) had a 5-year event-free survival of 92.3% (± 0.9%).17 In some patients, MRD can be detected below the 0.01% threshold level. We found that even very low levels of MRD (ie, between 0.001% and 0.01%), as detected by PCR amplification of antigen-receptor genes at the end of remission-induction therapy, were associated with an increased risk of relapse.6 A high level of MRD (ie, ≥ 1%) at the end of remission induction predicts a particularly poor outcome.2 This MRD level remained an unfavorable predictor of outcome in the St Jude Total XV study (the only independent adverse predictor together with CNS3 status), despite MRD-based treatment intensification.14
MRD is a strong prognostic factor also for children and adolescents with first-relapse ALL who achieve a second remission,2 and for those with an apparently “isolated” extramedullary relapse.22 Investigators of the COG AALL01P2 study measured MRD by flow cytometry in 124 patients with first-relapse ALL.23 MRD 0.01% or more was detected at the end of block 1 in 75% (± 7%) of those with an early first relapse and 51% (± 8%) of those with a late relapse (P = .04); 12-month event-free survival was 80% (± 7%) versus 58% (± 7%) in MRD– versus MRD+ patients (P < .001).23 Detection of MRD before allogeneic hematopoietic stem cell transplantation is associated with an increase risk of relapse posttransplant.2,24
Adult ALL
There is solid evidence indicating that MRD testing is clinically useful in adult ALL. Investigators of the GMALL used PCR amplification of antigen-receptor genes to study MRD in 196 patients defined as “standard risk” by the absence of MLL-AFF1 or BCR-ABL1 gene fusion, B-lineage ALL with leukocyte counts less than 30 × 109/L or T-ALL, with counts less than 100 × 109/L, age 15 to 65 years, and achievement of complete remission after the first phase of induction therapy.7 They identified a low-risk group (10% of patients) with MRD lower than 0.01% on days 11 and 24, and a 3-year relapse rate of 0%; a high-risk group (23%) with MRD 0.01% or more until week 16 and a relapse rate of 94%; and an intermediate-risk group (all remaining patients) with a relapse rate of 47%. This team of investigators also reported results of a study of postconsolidation samples in 105 patients. Inclusion criteria were hematologic remission, completion of the first-year chemotherapy, and MRD-negativity prior to enrollment. At the time of the analysis, relapse had occurred in only 5 of the 77 patients who remained MRD–, compared with 17 relapses observed among the 28 patients who converted to MRD positivity.25 MRD was measurable in 15 of these patients while in hematologic remission: 13 relapsed after a median interval of 4.1 months (the two remaining patients being censored for out-of-protocol allogeneic hematopoietic stem cell transplantation), leading to the adoption of molecular relapse as an eligibility criteria for transplant in this study group. MRD was studied by PCR amplification of gene fusions and/or antigen-receptor gene rearrangements in patients enrolled in the Northern Italy Leukemia Group-ALL 09/00.26 At the end of consolidation, 58 were MRD– (< 0.01%) and 54 were MRD+; 5-year overall disease-free survival estimates were 72% in the MRD– group versus 14% in MRD+ group regardless of clinical risk factors, and MRD was the most significant predictor of relapse. The same group reported a study of 43 patients undergoing allogeneic hematopoietic stem cell transplantation; relapse rates at 36 months posttransplant was 0% for the 12 patients who were MRD– before transplant and 46% for those who were MRD+.27 MRD was studied by PCR amplification of antigen-receptor genes in 161 patients with non–T-lineage, BCR-ABL1– ALL enrolled in the UKALL XII trial.28 MRD 0.01% or more at several time points during the first year of therapy predicted a shorter relapse-free survival in patients treated with chemotherapy alone; MRD positivity after phase 2 induction carried an 8.95 (2.85–28.09)-fold higher risk of relapse. Interestingly, MRD positivity prior to transplant was an adverse risk factor for patients receiving autologous transplant, but not for those receiving an allogeneic transplant while in first complete remission.
MRD was studied by flow cytometry in 116 patients with Philadelphia chromosome-negative ALL enrolled in the Polish Adult Leukemia Group ALL 4–2002 trial: MRD 0.1% or more after remission induction therapy was an independent predictor of relapse, regardless of presenting features (age, leukocyte counts, and cell lineage) or attainment of remission after two cycles to chemotherapy.29 The European Study Group for Adult ALL evaluated the prognostic significance of MRD measured either by flow cytometry or by PCR in 123 patients enrolled in four different studies before autologous transplant and found that the 5-year probability of leukemia-free survival was significantly higher for patients with MRD less than 0.1%, compared with that of patients with higher MRD (57% vs 17%)—a difference that was primarily accounted for by the results of the 46 patients with T-lineage ALL (62% vs 8%).30 High MRD level was the only independent factor associated with increased risk of failure, although the interpretation of these results is complicated by the retrospective nature of the study and the heterogeneous treatment that patients received.
Early studies indicated that MRD monitoring in patients with Philadelphia-positive ALL receiving imatinib therapy was predictive of treatment outcome.31,32 More recently, Yanada et al33 studied MRD in 100 adult patients with BCR-ABL1 ALL treated with imatinib-containing chemotherapy using RQ-PCR targeting BCR-ABL1 transcripts. Negative MRD at the end of induction therapy was not associated with longer relapse-free survival or a lower relapse rate. However, increasing MRD levels were followed by relapse in 12 of the 13 patients who did not receive allogeneic transplant, compared with six relapses among the 16 patients who received transplant.
Current Applications of MRD for Risk Assignment
MRD testing is now included in most major childhood ALL protocols and in an increasing number of adult ALL trials. There is considerable variability in the time points selected for MRD studies and in the levels of MRD used to define risk of relapse. The current status of MRD monitoring in European ALL trials was comprehensively discussed in a recent review.3 The clinical significance of MRD and its use for treatment stratification are intimately related to protocol design. It is, therefore, not entirely unexpected that different groups assign risk groups using single or multiple MRD tests, measure MRD at various time points (eg, days 33 and 78; days 15 and 29; day 14; day 28; day 35; day 71; week 10 and week 16; week 16 and week 30 or later), and apply different MRD levels (eg, 0.01%, 0.05%; 0.1%; and 1%) to define risk categories. The current COG protocol for children with standard risk B-lineage ALL includes MRD measurements at the end of remission induction therapy (day 29), and the cutoff levels used to assign risk are 0.1% and 1%.34 At St Jude Children's Research Hospital, we use MRD levels in bone marrow on day 15 and day 42 for treatment assignment. Patients with MRD of 1% or more on day 15 receive intensified remission induction therapy; further intensification is reserved for patients with 5% or more leukemic cells. Patients with MRD less than 0.01% on day 15 receive a slightly less intensive reinduction therapy and lower cumulative doses of anthracyclin. Patients with standard-risk ALL who have MRD of ≥ 0.01% on day 42 are reclassified as high risk; patients with MRD ≥ 1% are eligible for allogeneic transplant in first remission. Postremission studies of MRD in B-lineage ALL patients are performed only in those who are MRD+ on day 42, whereas all patients with T-lineage ALL are periodically monitored postremission using peripheral blood: persistent or emerging MRD is a criteria for transplant.
MRD at the end of remission reinduction is also used by our team to guide treatment for patients with first-relapse ALL. Those with MRD 0.01% or more are eligible for allogeneic hematopoietic stem cell transplantation, while achievement of MRD negativity (in the context of other favorable clinical features) is an indication for chemotherapy. For any patient scheduled for transplant, additional courses of chemotherapy may be administered in efforts to reduce MRD. Finally, monitoring MRD posttransplant informs decisions about reduction of immunosuppressive therapy, administrations of donor lymphocyte infusions, and preparation for another transplant.
Conclusions
Overwhelming evidence supports the prognostic importance of MRD. Although MRD is an independent predictor of relapse, its prevalence varies among different ALL subtypes. Although the association with clinical presenting features is generally weak or absent, association with genetic and biologic subtypes is more evident. In children with B-lineage ALL, MRD is less prevalent among patients with ETV6-RUNX1, hyperdiploidy (> 50 chromosomes) and TCF3-PBX1 ALL, and more prevalent among those with BCR-ABL1 and IKZF1 deletions35,36 ; in patients with T-lineage ALL, MRD is particularly high in those with early T-cell precursor ALL (Figure 1).37 MRD is also associated with gene expression profiles of leukemic cells,38 as well as germline or leukemia-associated gene polymorphisms.39 These correlations raise the question as to whether MRD studies could eventually be replaced by risk classification schemas based solely on presenting features. This seems unlikely, because MRD measurements directly estimate drug sensitivity in vivo that reflects the composite impact of myriad presenting features, as well as therapeutic variables (eg, drug dosages and timing, pharmacokinetics, and compliance). Rather, one would predict that risk assignment will increasingly rely on the combined information on presenting biologic features and MRD.14,40 Beyond its use as a prognostic factor, MRD can also be used to recognize leukemia relapse before it is morphologically overt, to determine the leukemia burden before transplant, and to assess the efficacy of a treatment regimen in relation to that of its predecessor. Therefore, MRD studies may contribute to improve clinical management of patients with leukemia in many ways.

Relation between MRD during and at the end of remission induction therapy with presenting features. Shown is the percentage of MRD on week 2 and week 6 of treatment according to presenting features in a cohort of 989 patients with newly diagnosed childhood ALL enrolled in St Jude Children's Research Hospital Total XIII-XV studies. Asterisks indicate P < .01 by chi square or Fisher's exact test; for genetic and biologic features, analyses were performed by comparing data from cases with a given feature to those of all other B-lineage cases, or T-lineage for early T-cell precursor ALL (ETP-ALL). Note that among the 23 BCR-ABL1 ALL patients studied on week 6, there were seven who were MRD– and these included four of the five patients who received imatinib after day 19 of remission induction therapy. In the remaining patient who received imatinib-containing therapy, MRD went from 18.5% on week 2 to 0.06% on week 6.
Relation between MRD during and at the end of remission induction therapy with presenting features. Shown is the percentage of MRD on week 2 and week 6 of treatment according to presenting features in a cohort of 989 patients with newly diagnosed childhood ALL enrolled in St Jude Children's Research Hospital Total XIII-XV studies. Asterisks indicate P < .01 by chi square or Fisher's exact test; for genetic and biologic features, analyses were performed by comparing data from cases with a given feature to those of all other B-lineage cases, or T-lineage for early T-cell precursor ALL (ETP-ALL). Note that among the 23 BCR-ABL1 ALL patients studied on week 6, there were seven who were MRD– and these included four of the five patients who received imatinib after day 19 of remission induction therapy. In the remaining patient who received imatinib-containing therapy, MRD went from 18.5% on week 2 to 0.06% on week 6.
Some contend that leukemic relapse is driven by rare leukemic stem cells and that current MRD methods cannot determine whether the signals detected originate from stem cells or cells incapable of durable self-renewal. Whether rare ALL stem cells exist and whether they express distinctive phenotypes are controversial. In any case, in the face of strong correlation between MRD levels and relapse, this argument has little weight from a clinical standpoint. Even if MRD signals are not derived from leukemic stem cells, in most cases they expose the persistence of leukemic lymphoblasts that are resistant to further chemotherapy and are capable of causing the recurrence of clinically overt leukemia.
Acknowledgments
This work was supported by grants CA60419 and CA21765 from the National Cancer Institute, and by the American Lebanese Syrian Associated Charities (ALSAC).
Disclosures
Conflict-of-interest disclosure: The author declares no competing financial interests.
Off-label drug use: None disclosed.
Correspondence
Dario Campana, MD, PhD, Department of Oncology, St. Jude Children's Research Hospital, 262 Danny Thomas Place, Memphis, TN 38105; Phone: (901) 595-2528; Fax: (901) 595-5947; e-mail: dario.campana@stjude.org
