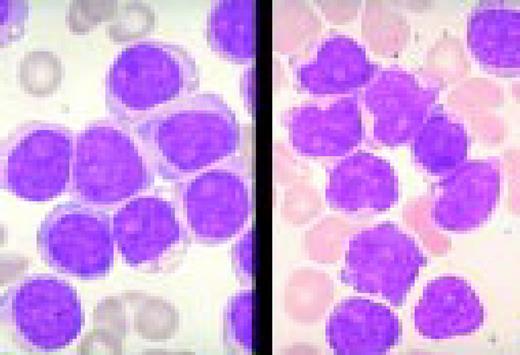
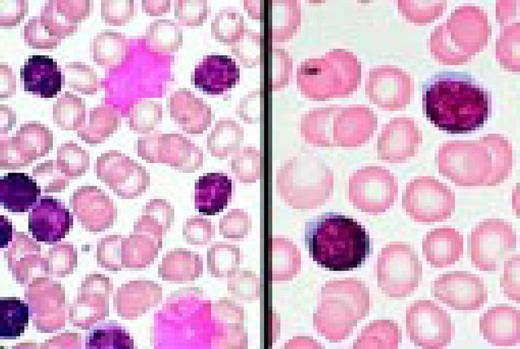
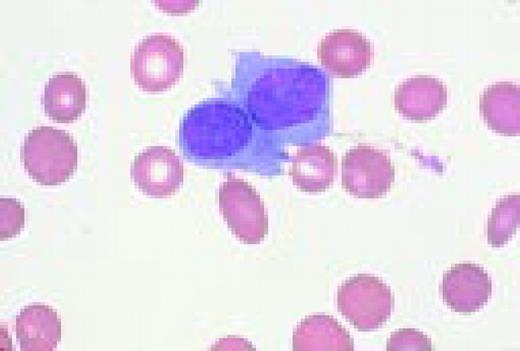
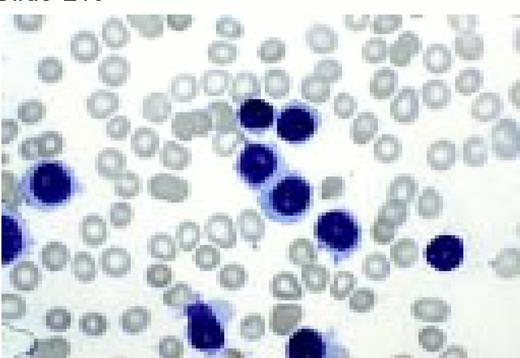
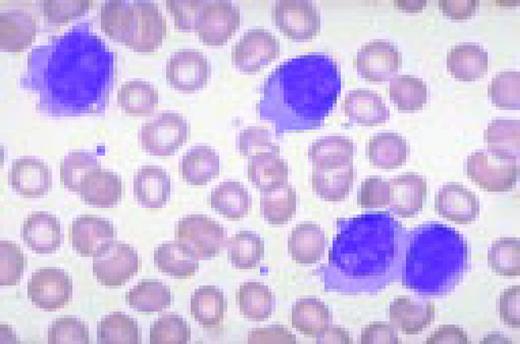
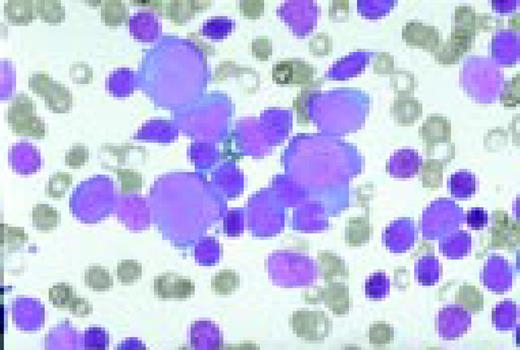
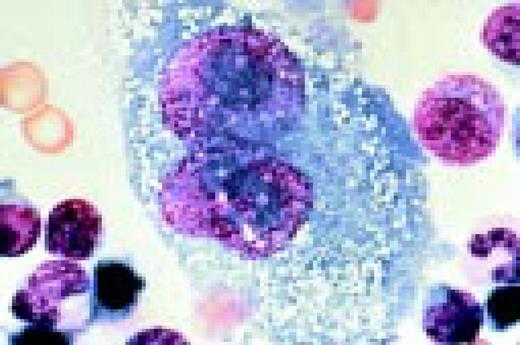
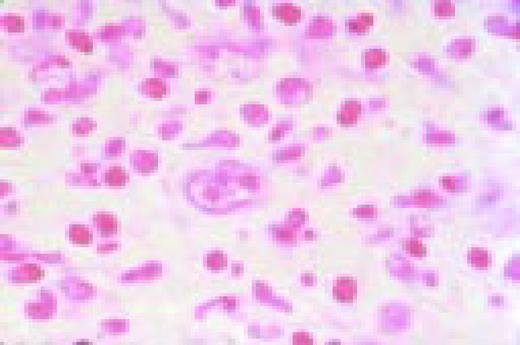
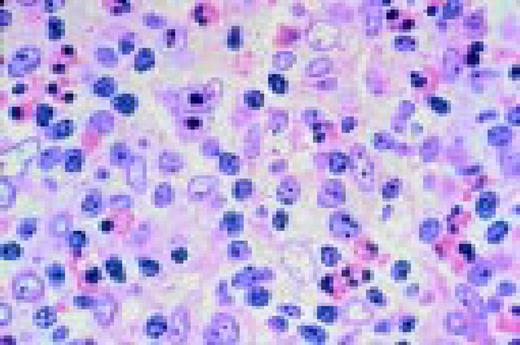
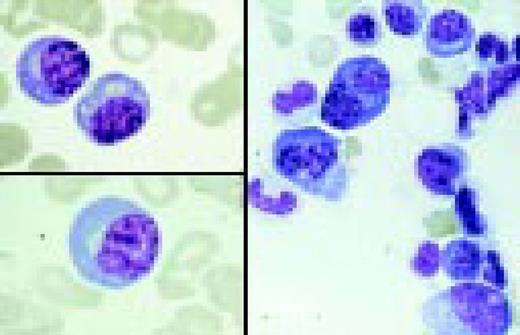
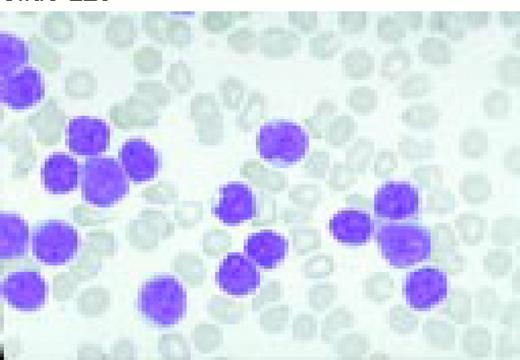
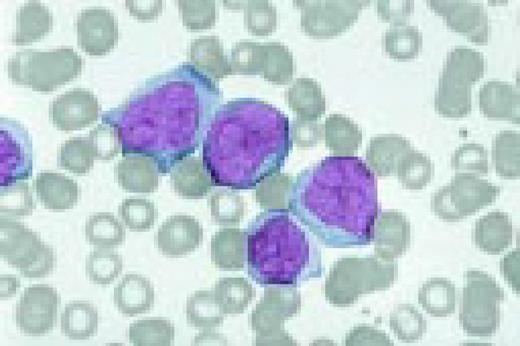
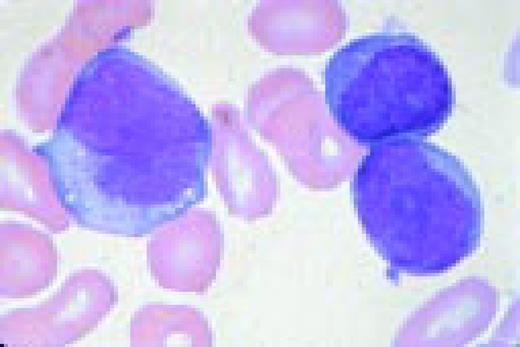
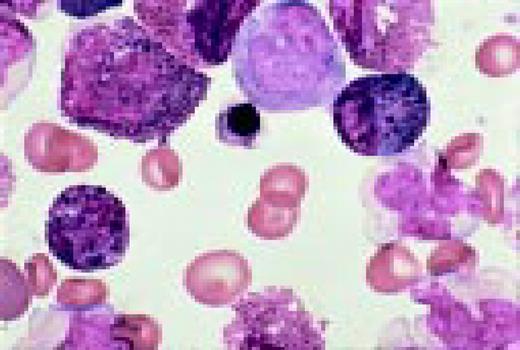
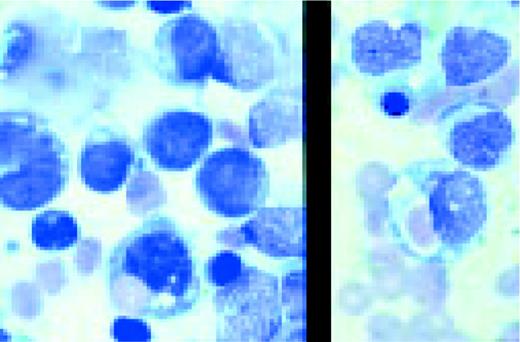
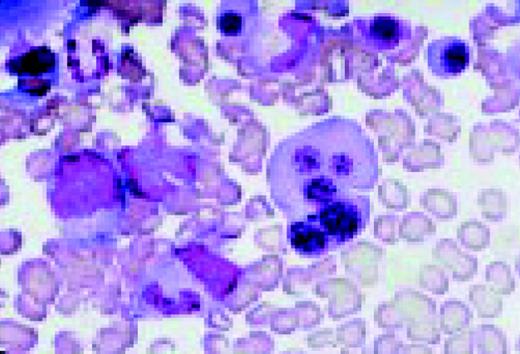
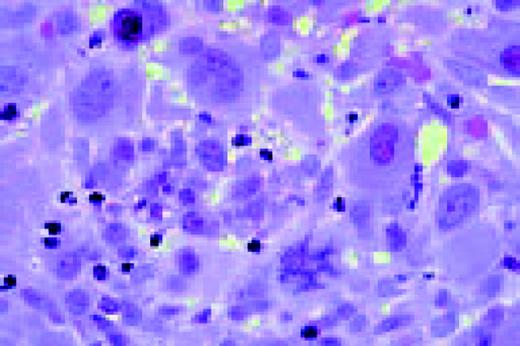
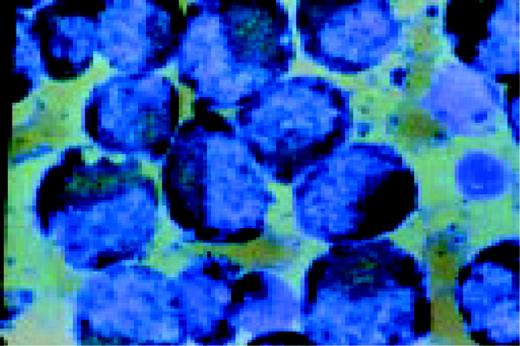
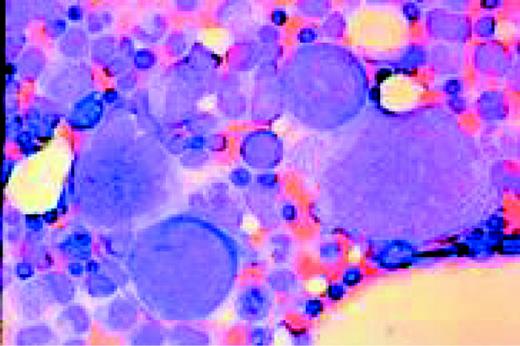
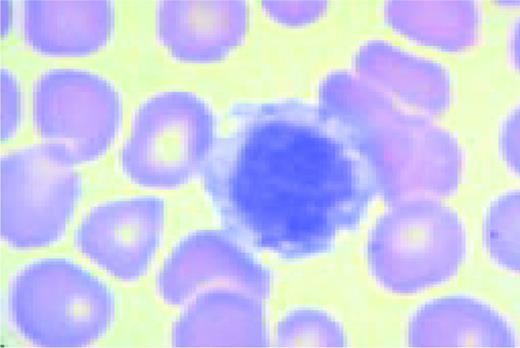
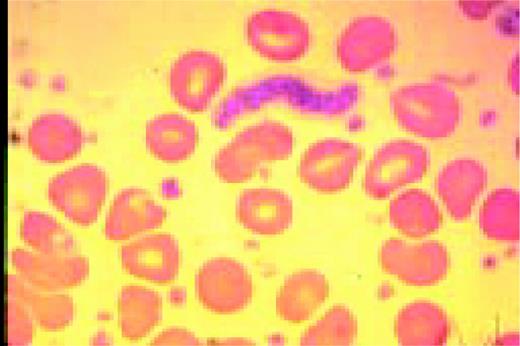
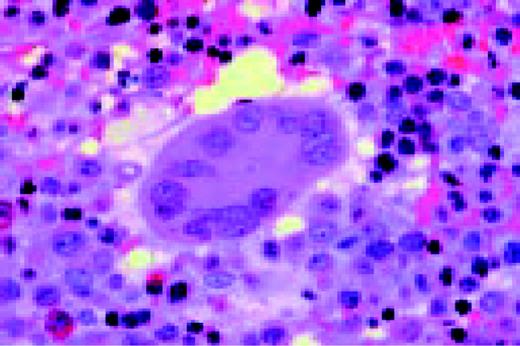
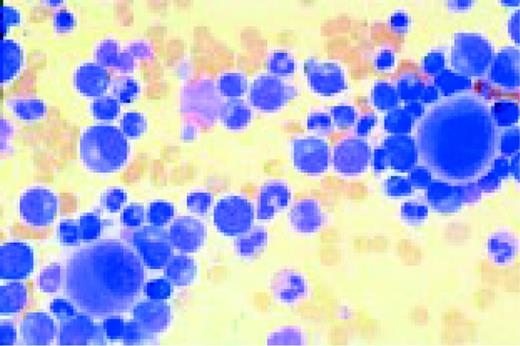
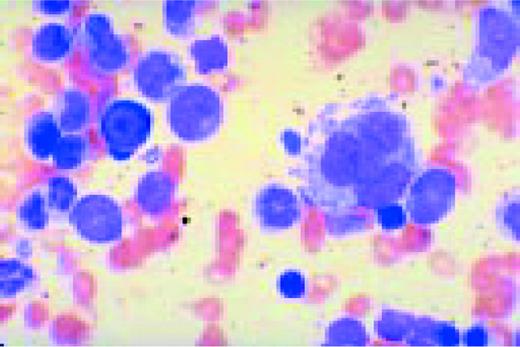
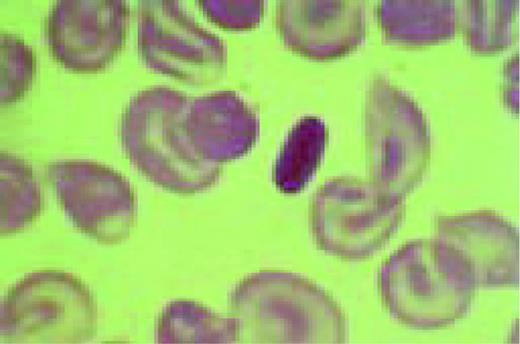
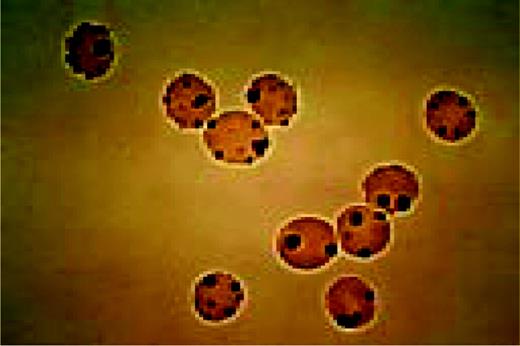
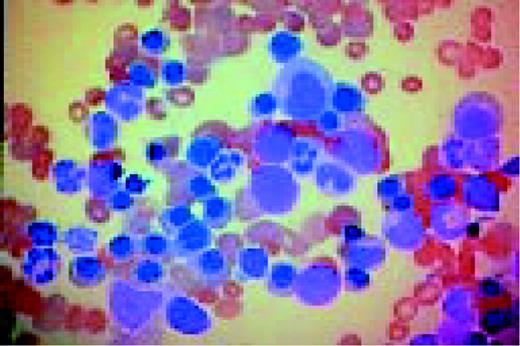
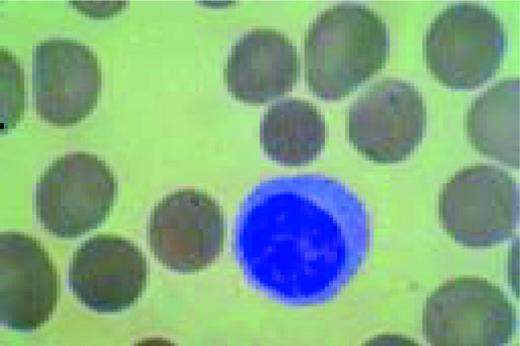
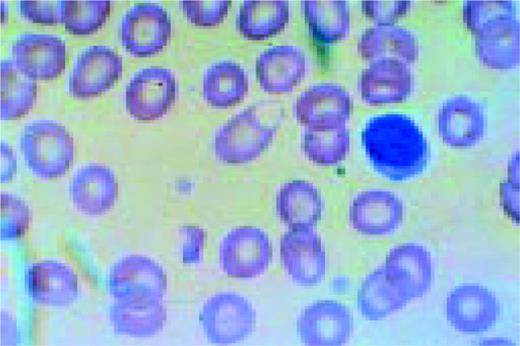
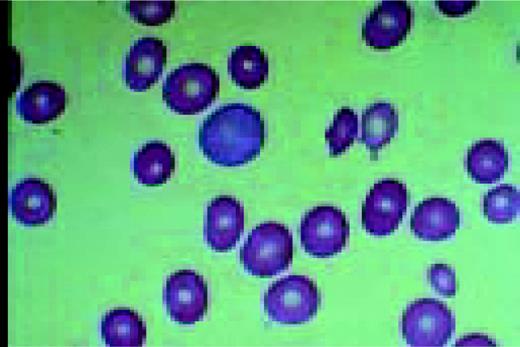
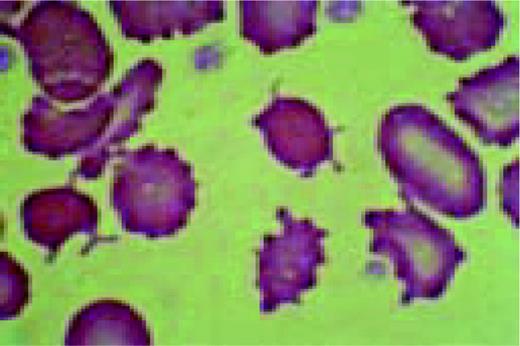
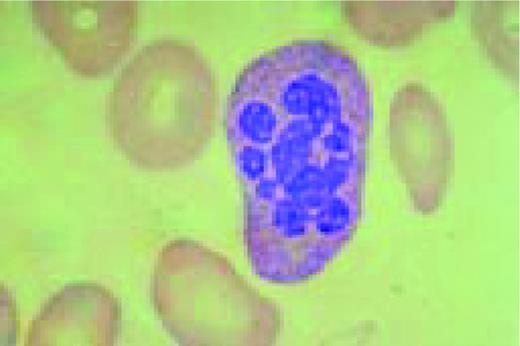
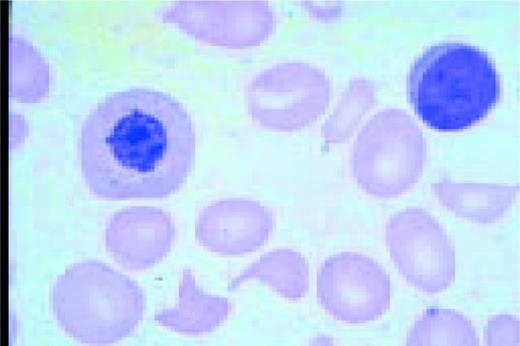
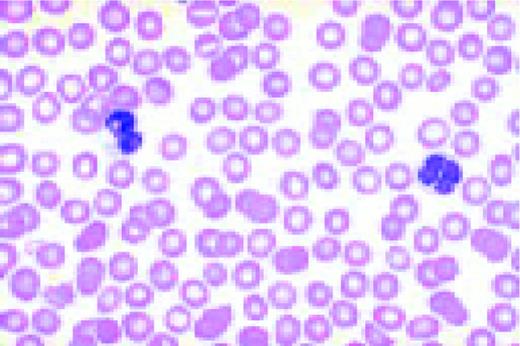
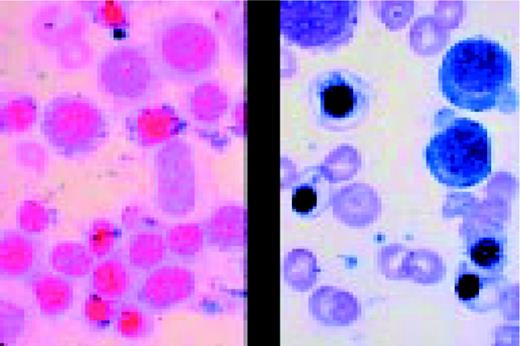
In this morphology “glossary” are found examples of many of the items discussed in the body of this book. The collection was originally assembled for the Interamerican Division Regional Update in Leukemia course in Puebla, Mexico (Dr. G.J. Ruiz-Argüelles and Dr. E. Torré-Lopez). It has subsequently been used in Ankara, Turkey (Dr. E. Kansu) and Cordoba, Argentina (Dr. C. Ponzinibbio). Developments in informatics have enabled the cost-effective reproduction of these images.
The glossary has been rearranged and enlarged since its ASH Education Program introduction—principally with slides used in the Morphology Panel of the ISH Amsterdam congress (Drs. Bain, Brunning, Castoldi, Kluin, Matutes, McArthur, den Ottolander, and Verhoef). It is now divided into four major sections: lymphoid, myeloid, megakaryocytic, and erythroid.
Unless otherwise stated, oil magnification of Wright's-stained smears are shown.
Normal and Abnormal Lymphoid Cells
Slide L1
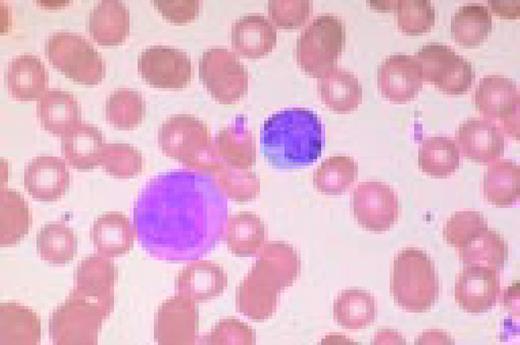
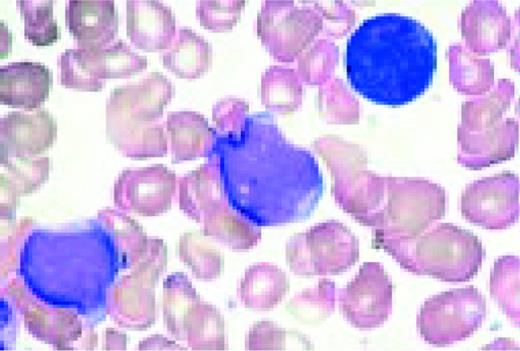
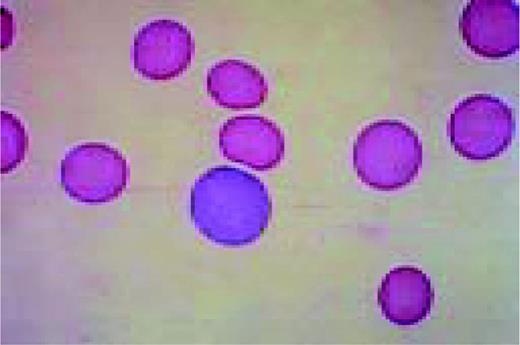
A normal peripheral blood lymphocyte and monocyte.FIG1
Slide L2
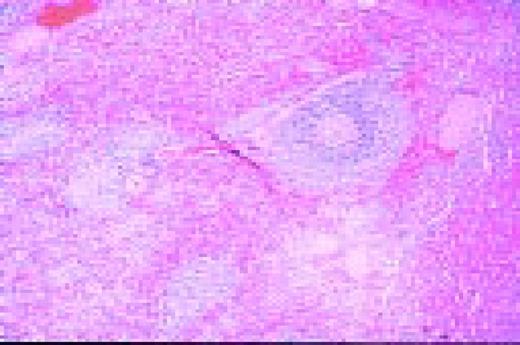
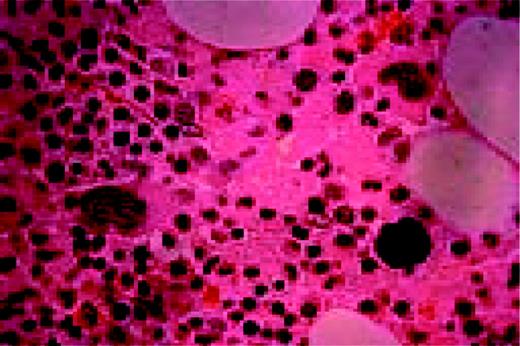
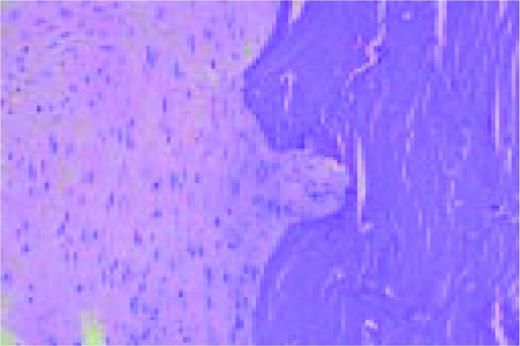
A normal, nonmalignant, reactive lymph node. Follicular hyperplasia is seen, both in the central and cortical areas. Very low power view, hematoxylin and eosin (H&E) stain.FIG2
Slide L3
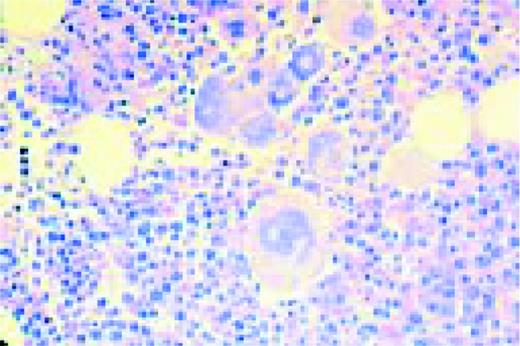
Normal spleen. The vascular structures, sinusoids, and intervening lymphoid areas can be appreciated. Very low power view, H&E stain.FIG3
Slide L4
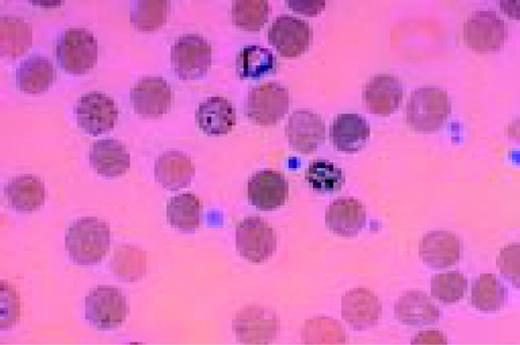
The azure granules of the Alder-Reilly-Day anomaly, peripheral blood.FIG4
Slide L5
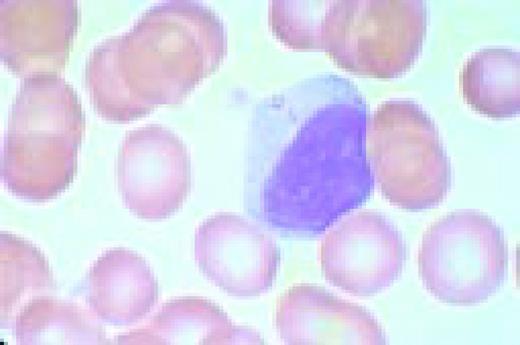
Infectious mononucleosis, peripheral blood. These reactive atypical lymphocytes have pleomorphic reticular nuclei, peripheral basophilia of cytoplasm, and scalloped cell borders, some of which appears to stream into red cells.FIG5
Slide L6
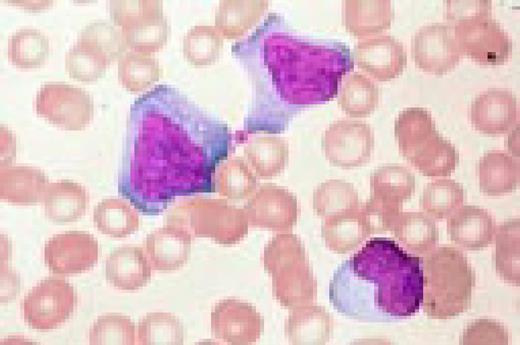
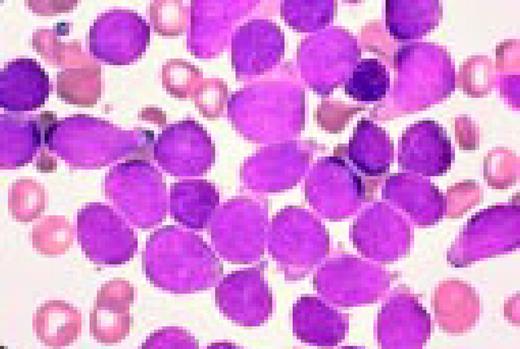
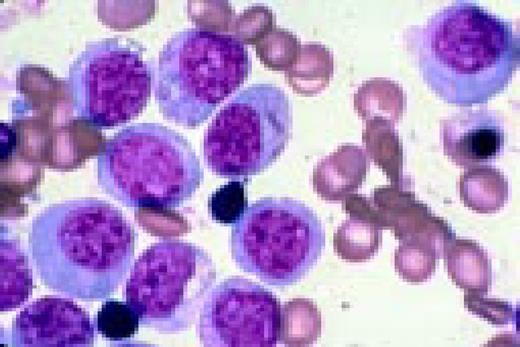
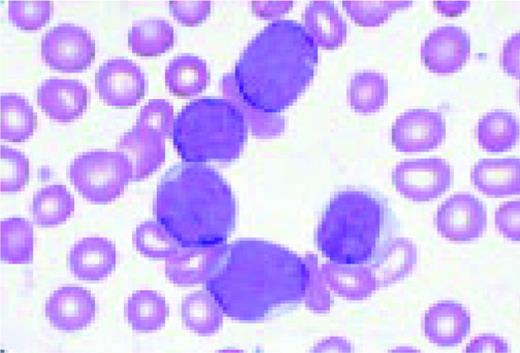
Acute lymphoblastic leukemia, FAB classification L1, bone marrow aspirate. The appearance of these blasts—very fine nuclear chromatin, nucleoli, and the high nuclear to cytoplasmic ratio is characteristic of this diagnosis.FIG6
Slide L7
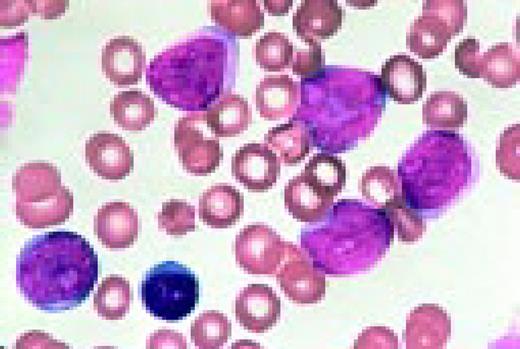
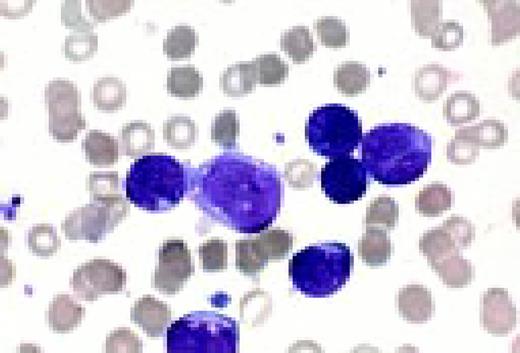
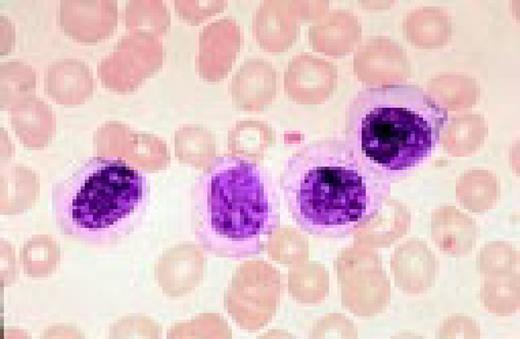
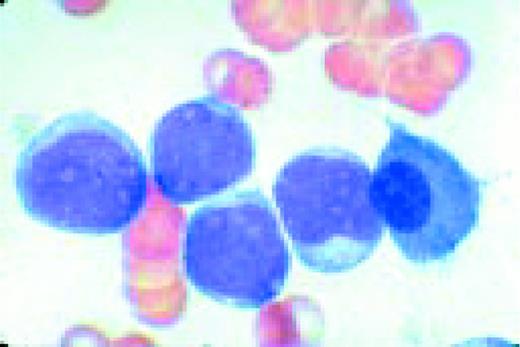
Acute lymphoblastic leukemia, FAB classification L2, peripheral blood. Five blasts surround a lymphocyte. These blasts are somewhat large and have a varied morphology. They can sometimes be confused with myeloid or monocytic cells.FIG7
Slide L8
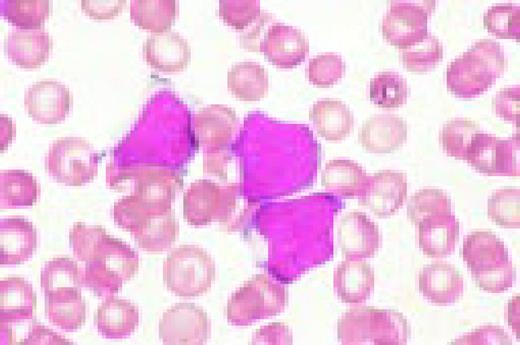
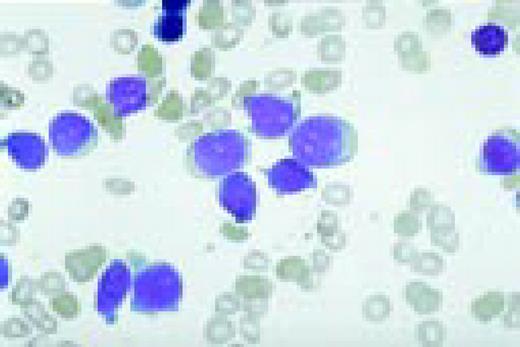
Philadelphia chromosome-positive acute lymphoblastic leukemia. These blasts have a relatively high nuclear-cytoplasmic ratio and moderately condensed chromatin. They were CD19, CD10, and TdT positive.FIG8
Slide L9
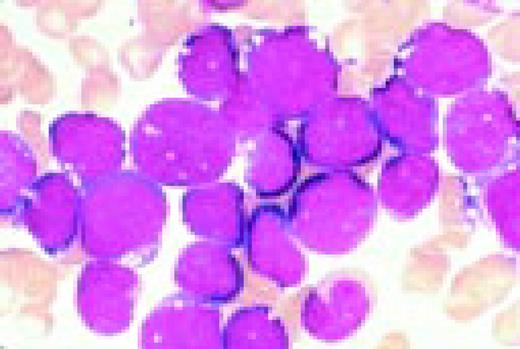
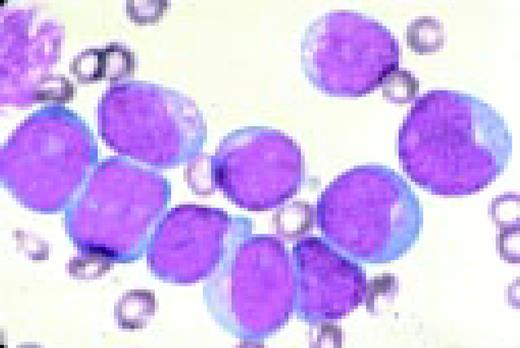
Acute lymphoblastic leukemia, FAB classification L3, bone marrow aspirate. The variation in size and shape of the cells and their nuclei, as well as the presence of cytoplasmic and nuclear vacuoles are characteristic of this diagnosis.FIG9
Slide L10
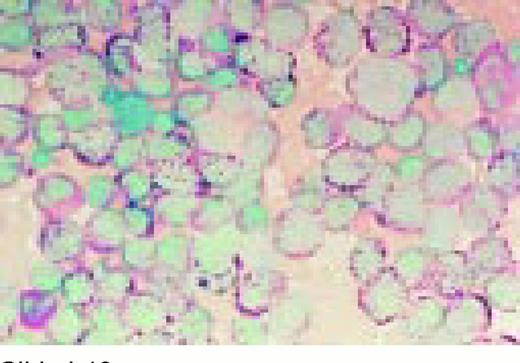
Acute lymphoblastic leukemia, FAB classification L2, bone marrow aspirate, periodic acid-Schiff stain (PAS). The coarse granularity in the cytoplasm as well as some frank cytoplasmic globules are characteristic of the PAS reaction when it is positive in lymphoblasts.FIG10
Slide L11
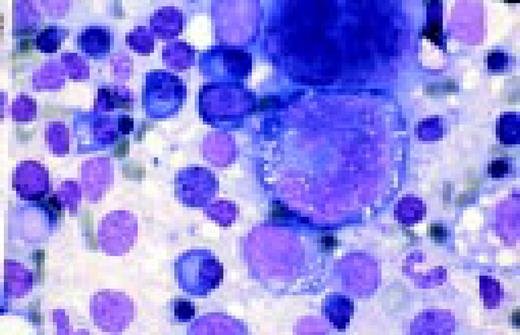
Biphenotypic (mixed lineage) acute leukemia, bone marrow aspirate, adult. There is a mixture of blasts, some displaying lymphoid features while others are larger, undifferentiated with features suggestive of acute myeloid leukemia. Immunological markers demonstrated that the majority of blasts from this adult patient coexpressed B-lymphoid (CD79a, cytoplasmic CD22, CD10) and myeloid (CD13, CD33, myeloperoxidase) antigens and were positive for early hematopoietic associated markers (CD34, HLA-DR and TdT). Morphology of biphenotypic acute leukemia (BAL) is variable with some cases resembling acute lymphoblastic leukemia and others resembling one of the subtypes of acute myeloid leukemia. It is not unusual to find two morphologically distinct blast populations (E. Matutes, Haematologica 82:4, 1997). Immunophenotyping is a key diagnostic test for BAL since its recognition has important prognostic implications.FIG11
Slide L12
Chronic lymphocytic and acute myeloblastic leukemia, simultaneously at presentation, bone marrow aspirate. This 75-year-old man, presenting with enlarged lymph nodes and hepatosplenomegaly, had been desperately ill for several days with severe anemia, thrombocytopenia and spontaneous tumor lysis. Bone marrow smears show a mixture of small cells with clumped nuclear chromatin and scanty cytoplasm, and larger cells with finely dispersed nuclear chromatin and basophilic cytoplasm with vacuolization. A presumed diagnosis of CLL with Richter's transformation was made. Immunophenotype of the small cells confirmed the CLL population (dim surface immunoglobulin, positive for CD5, CD 19 and CD23 and negative for FMC7 and CD22). However, immunophenotype of the larger blast cells could not confirm a lymphoid origin. The large cells were negative for lymphoid markers and, surprisingly, were positive for HLA-DR, CD33, CD15 and cytoplasmic myeloperoxidase (cyMPO), compatible with blast cells of myeloid origin.FIG12
Slide L13
B cell chronic lymphocytic leukemia with more than 10% prolymphocytes, CLL/PL. (See Noell et al. Br J Haematol 63:377, 1986.) Typically, this abnormality shows two cell populations. There is one large population of small CLL lymphocytes. The second, smaller population is of large, nucleolated prolymphocytes. In this case, the latter are represented by a large cell with two nucleoli, which almost resembles a blast. Also, note a smudge cell in the photograph and the typical nuclear chromatin pattern of the CLL lymphocytes.FIG13
Slide L14
Prolymphocytic leukemia (PLL). This composite slide shows prolymphocytic leukemia (PLL) from two different patients. On the left is B cell PLL and on the right, T cell PLL. The B-PLL cells correspond to the classic description of Galton et al. (Br J Haematol 27:7, 1974): They are larger than CLL lymphocytes, have condensed chromatin, and have prominent large nucleoli. The T-PLL cells have a less conspicuous nucleolus, an irregular nuclear outline, and cytoplasmic blebs, as described by Matutes et al. (Blood 78:12, 1991). In many cases it may (FIX) be difficult to distinguish B-PLL from T-PLL cells on morphologic grounds alone, without performing additional immunophenotypic studies.FIG14
Slide L15
This composite view shows B chronic lymphocytic leukemia on the left and T chronic lymphocytic leukemia on the right, peripheral blood. In this instance one cannot discern a great deal of difference between the lymphocytes. However, two destroyed cells, characteristic of B cell CLL, are seen on the left.FIG15
Slide L16
Sézary's syndrome, buffy coat preparation. The nuclear pleomorphism and convolutions are prominent with many cells showing the frank cerebriform appearance of Sézary cells.FIG16
Slide L17
Hairy cell leukemia. The cytoplasmic strands and the very reticular appearance of the nuclear chromatin are characteristic.FIG17
Slide L18
Hairy cell leukemia, variant (HCL-V), peripheral blood. Cells are medium to large in size and have an abundant villous cytoplasm and a prominent single nucleolus. Thus, the nuclear features are similar to those of prolymphocytes while the cytoplasm resembles that of hairy cells. (Sainati et al. Blood 76:157, 1990). The patient presented with splenomegaly and a high white cell count, and was not monocytopenic. Immunological markers demonstrated the B-cell nature of the cells with light chain restriction (lambda+, kappa-), CD19+, FMC7+ with strong expression of CD11c and CD103 (two markers positive in typical HCL). However, the cells did not express two other typical hairy cell antigens, CD25 and HC2. The differential diagnosis includes typical HCL, prolymphocytic leukemia and splenic lymphoma with villous lymphocytes. Cell morphology and immunological markers are useful to distinguish between typical HCL and its variant form while morphology and histology helps to distinguish HCL variant from the splenic lymphoma with villous lymphocytes and prolymphocytic leukemia.FIG18
Slide L19
Splenic lymphoma with circulating villous lymphocytes (SLVL). There are four lymphoid cells of medium to small size, with condensed nuclear chromatin, nucleolus, basophilic cytoplasm, and irregular projections at the end of the cell. The differential diagnosis includes HCL and HCL variant. The SLVL cells have a higher nuclear to cytoplasmic ratio and are smaller in size. In contrast to CLL, SLVL cells have irregular and slightly more abundant cytoplasm. Compared to B-PLL, SLVL cells have more condensed chromatin and prominent villi. (Mulligan and Catovsky, Leukemia and Lymphoma 6:97, 1992)
Slide L20
Marginal zone lymphoma (?), peripheral blood. This 75-year-old man had slight splenomegaly, no lymphadenopathy, and a history of increasing lymphocytosis over the prior 4 years. The Hb was 8.0 g/dL, WBC 45 × 109/L, and platelets 183 × 109/L. The lymphocytes were C19+, CD20+, CD22+, CD5-, CD11c weakly positive, CD25-, and light chain restricted.FIG20
Slide L21
CLL with Richter's transformation, peripheral blood. This 47-year-old male presented with an abdominal mass and hepatosplenomegaly. There are a mixture of small cells with clumped nuclear chromatin and scanty cytoplasm, and large cells with fine nuclear chromatin and more abundant basophilic cytoplasm. Immunophenotype showed a marker profile typical of CLL: dim surface immunoglobulin, positive for CD5 and CD23, negative for FMC7 and CD22. Cytogenetic analysis revealed a complex karyotype.FIG21
Slide L22
Hodgkin's disease, bone marrow aspirate. A classic binucleate Reed-Sternberg cell is seen in the center of the field, a rare finding in a bone marrow aspirate. The nuclei are mirror image, the nucleoli are large and there is intense cellular basophilia as well as marked cytoplasmic vacuolization.FIG22
Slide L23
Mononuclear Hodgkin's cell, bone marrow aspirate.FIG23
Slide L24
Hodgkin's disease. H&E stained bone marrow biopsy. A classical binucleate Reed-Sternberg cell is seen in the center of the field. The surrounding cellular infiltrate is interspersed with some fibrous tissue and other stroma.FIG24
Slide L25
Hodgkin's disease, H&E stained bone marrow biopsy. Complete replacement of the normal bone marrow elements is noted. The process contains both cellular elements and fibrosis.FIG25
Slide L26
Hodgkin's disease, mixed cellularity (HDMC), lymph node. A binucleate Reed-Sternberg cell is seen near the center of the field. There is some fibrosis. Lymphocytes, plasma cells, and eosinophils can also be appreciated.FIG26
Slide L27
Nodular sclerosing Hodgkin's disease (HDNS), H&E stain. Hodgkin's cells, lacunar cells, lymphoid, and histiocytic cells are all seen in this slide.FIG27
Slide L28
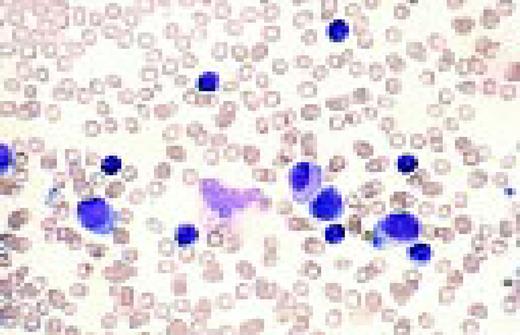
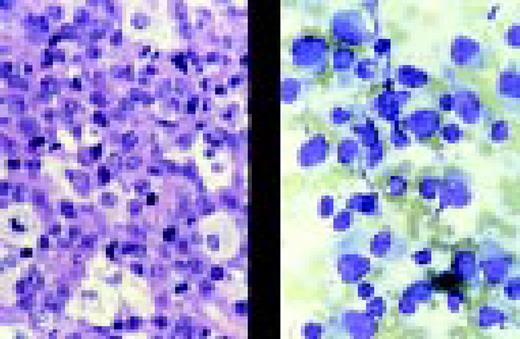
Reactive plasmacytosis with circulating plasma cells. Composite: blood (L) and bone marrow (R). This 71-year-old male was admitted because of fever (38.3°C) and suspected cholangitis. The WBC was 15.4 × 10⁹/L with 10% plasma cells. A bone marrow aspirate showed about 30% small plasma cells with deep blue cytoplasm. A diagnosis of multiple myeloma with circulating plasma cells was considered. The total protein was not increased. The gamma globulin fraction was 40%. Agar electrophoresis revealed several monoclonal components. In the immunoelectrophoresis, the major component appeared to be a IgM-kappa paraprotein. The normal immunoglobulins were not decreased. Immunophenotyping of the blood plasma cells proved the polyclonality of these cells with a kappa/lambda ratio of 55/45. After treatment of the infection, plasma cells disappeared from the blood.FIG28
Slide L29
Polyclonal B cell lymphocytosis. Composite slide of a peripheral blood film from a 48-year-old asymptomatic woman with polyclonal B-cell lymphocytosis. The cells are large, twice the size of a normal lymphocyte and have abundant pale cytoplasm and mature non-condensed chromatin. Some cells show a bi-lobed and/or deeply indented nucleus. Immunophenotype showed a polyclonal B-cell population FMC7+, CD19+, CD22+, CD5- with 40% lymphocytes staining with anti-lambda and 30% with anti-kappa. Cytogenetics and molecular analysis confirmed the polyclonal nature of the cells. Differential diagnosis includes “spill over” of B-cell non-Hodgkin's lymphoma cells into the peripheral blood.FIG29
Slide L30
Circulating follicular NHL lymphoma cells. This is a peripheral blood smear from a patient with follicular lymphoma showing three lymphoma cells and a normal large granular lymphocyte. The last, in the center of the field, has abundant clear cytoplasm and fine granules. The three follicular lymphoma cells have deep clefts, small size (slightly larger than erythrocytes), and a homogeneously stained nuclear chromatin without nucleoli. This appearance differs from that of a CLL cell. These cells also have a lack of visible cytoplasm.FIG30
Slide L31
Mantle cell lymphoma, peripheral blood. The picture is pleomorphic with a predominant medium sized lymphoid population having nuclei with dense but not clumped chromatin, occasional nuclear clefts, and a single small nucleoli. Immunophenotype showed a clonal B-cell population with strong expression of surface immunoglobulins and membrane CD22. The cells were positive for FMC7 and CD5, and negative for CD23. This profile differs from B-cell chronic lymphocytic leukemia, which typically shows dim surface immunoglobulin and CD23 positivity. Cytogenetic analysis revealed a t(11:14)(q13;q32), and spleen histology showed diffuse involvement by medium size lymphocytes with a cleaved nucleus, confirming the diagnosis of mantle-cell lymphoma in this 66-year-old man.FIG31
Slide L32
Post-transplant B cell lymphoma, peripheral blood. This 38-year-old man was 156 days post unrelated donor bone marrow transplant for chronic myeloid leukemia and was being treated with cyclosporin A. Immunophenotyping of the plasmacytic-lymphocytic cells in the blood showed an IgG kappa light chain restricted population. Molecular studies revealed immunoglobulin heavy chain gene rearrangement. The patient expired two days later.FIG32
Slide L33
“Adult” T cell leukemia lymphoma (ATLL). Peripheral blood film from a 38-year-old black Caribbean patient. The lymphocytes are small to medium size and display a highly irregular nucleus with an inconspicuous nucleolus and multiple indentations; for this reason they are often designated “flower cells.” Immunophenotype showed the mature, activated helper T cell nature of the cells (TdT-, CD1a-, CD2+, CD3+, CD5+, CD7-) with a CD4+, CD8-, CD25+ phenotype. Antibodies to the human T-cell leukemia/lymphoma virus (HTLV-1) were detected in the patient's serum, and molecular analysis of the tumor cells showed a clonal integration of the proviral HTLV-1 in the cells' DNA.FIG33
Slide L34
Anaplastic large cell non-Hodgkin's lymphoma. Peripheral blood film from a 52-year-old man with large-cell lymphoma evolving into leukemia. The cells are large (>3 times the size of a red blood cell) and have reticular chromatin, deeply basophilic cytoplasm, and one to three nucleoli. The mature B lymphoid nature of the cells was confirmed by immunological analysis that showed a clonal B cell population positive for kappa, CD19, and FMC7 and negative for lambda, CD5, CD23, and CD2.FIG34
Slide L35
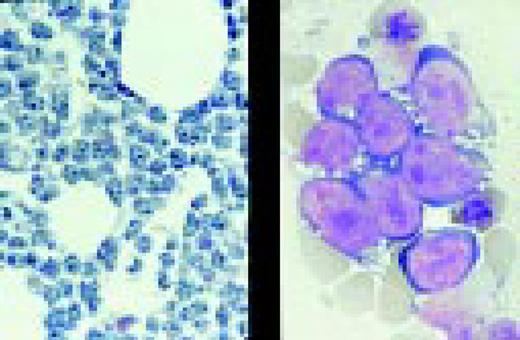
Burkitt's lymphoma. Composite: bone marrow biopsy (L) and bone marrow aspirate (R). Giemsa stained. This 19-year-old male presented with a submandibular tumor in 1997. A biopsy revealed non-Hodgkin's lymphoma, Burkitt's type, according to the REAL classification. Staging revealed stage I disease. He was treated with aggressive polychemotherapy for Burkitt's lymphoma and an allogeneic bone marrow transplant was planned for March 1998. Two weeks before BMT, the patient complained of back pain, and there was a sharp rise of LDH. A bone marrow smear and biopsy revealed massive infiltration by Burkitt lymphoma blasts. Few tumor cells were seen in the blood smear. The slide (R) shows typical Burkitt's lymphoma with vacuolated cytoplasm (ALL-L3 blasts according to the FAB classification). The bone marrow biopsy (L) also shows the typical, leukemia type, interstitial infiltration, leaving the fat cells intact.FIG35
Slide L36
Anaplastic large cell lymphoma. Lymph node aspirate (R) and tumor biopsy (L). A 10-year-old boy presented with a large intra-osseous tumor in the proximal tibia and enlargement of a supraclavicular lymph node. Aspiration cytology of the lymph node (R) showed medium-sized “plasmacytoid” cells with eccentric nuclei. Some cells showed cytoplasmic extensions simulating sarcoma. One cell in the slide shows a small “nuclear window.” A trephine biopsy of the tumor of the tibia (L; H&E) showed a tumor rich in histiocytes. Tumor cells were vimentin, CD30, ALK-1 positive, and weakly CD45RO positive. This is a typical example of a peripheral T cell lymphoma, according to the REAL classification, anaplastic large cell lymphoma (ALCL), (lymphohistiocytic) variant. The ALK-1 positivity suggests a variant translocation t(2;5) since the staining was mainly cytoplasmic (not shown). Tumor cells can be relatively small in this variant of ALCL and may resemble large plasma cells. Bone involvement is relatively common in ALCL.FIG36
Slide L37
Anaplastic (Ki-1+) T cell lymphoma, bone marrow smear from an adult patient. The cells are very large, up to ten times the size of a normal lymphocyte and have a nucleus with reticular chromatin and basophilic vacuolated cytoplasm. Immunophenotyping demonstrated the T-cell nature of the cells (CD3+) with expression of CD30 (Ki-1). Most anaplastic Ki-1+ lymphomas are of T-cell origin, characteristically express the Ki-1 antigen and are associated to the t(2;5). BM involvement in anaplastic large cell lymphoma is rare and the presence of these large cells in the bone marrow aspirates is even less frequent. Differential diagnosis includes Hodgkin's disease and non-hemopoietic tumors. Histology and immunological markers are key tests for the diagnosis.FIG37
Slide L38
T cell large granular lymphocyte leukemia (T-LGL). Peripheral blood smear shows typical LGLs with intracytoplasmic granules. Photo courtesy of Bruce Cheson, MD.FIG38
Slide L39
Multiple myeloma, bone marrow aspirate. Virtually every cell in the field is a neoplastic plasma cell. They show nuclear eccentricity, pleomorphism, and a tendency to stick together in clumps.FIG39
Slide L40
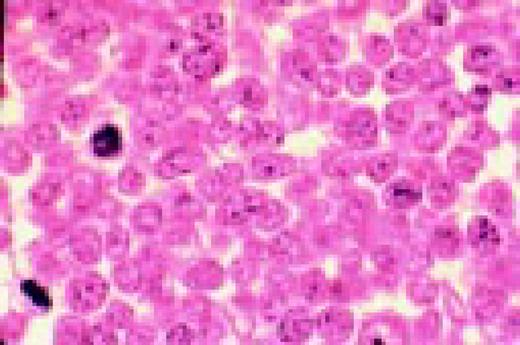
Multiple myeloma, bone marrow aspirate. The marrow has been completely replaced by abnormal plasma cells. A binucleate plasma cell is seen in the center of the field.FIG40
Slide L41
Multiple myeloma, bone marrow aspirate. The cytoplasmic periphery of these cells has a much more intense pink stain, therefore the names flaming myeloma cells or flaming plasma cells.FIG41
Slide L42
IgA myeloma, bone marrow biopsy. Several of the plasma cells contain intranuclear inclusions referred to a Dutcher bodies. These structures are found in a wide spectrum of immunoproliferative disorders and had been most frequently associated with plasmcytoid lymphomas. They lack specificity for any subtype of the immunoproliferative processes.FIG42
Slide L43
Multiple myeloma, bone marrow aspirate. There are binucleate myeloma cells with granules. This patient had a chronic reactive plasmacytosis and adult Fanconi syndrome for many years prior to having dissemination of the myeloma. The needle-like cytoplasmic inclusions in the plasma cells were also found in the renal tubular cells.FIG43
Slide L44
Multiple myeloma, bone marrow biopsy, Giemsa stain. There is complete replacement of the normal marrow by neoplastic plasma cells. These again are recognized primarily by their nuclear eccentricity.FIG44
Slide L45
Waldenström's macroglobulinemia, peripheral blood. There are abundant plasmacytoid lymphocytes and a suggestion of rouleaux formation.FIG45
Slide L46
Lymphoplasmacytic lymphoma associated with IgM monoclonal gammopathy, bone marrow biopsy. The marrow is extensively replaced by small lymphocytes, plasmacytoid lymphocytes, and plasma cells. The process is interpreted as marrow involvement by a plasmacytoid tumor.FIG46
Slide L47
Plasma cell leukemia, peripheral blood. Five neoplastic plasma cells are seen, one of which is binucleate. Slight rouleaux formation of some red blood cells is seen.FIG47
Slide L48
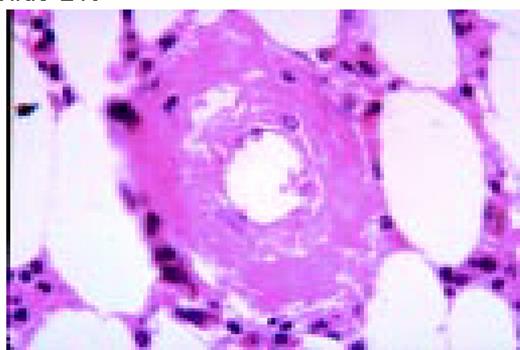
Amyloid, bone marrow biopsy, H&E stain. A small blood vessel is heavily infiltrated with the pink-staining, waxy amyloid material.FIG48
Slide L49
HIV-associated lymphadenopathy, lymph node, H&E. Multinucleated cells are clearly appreciated, as is a venule.FIG49
Slide L50
Kaposi sarcoma, lymph node section, H&E. This lymph node from a patient with AIDS has been virtually completely infiltrated with Kaposi sarcoma.FIG50
Slide L51
Leishmaniasis associated with AIDS, bone marrow biopsy. Leishmania donovani are noted in macrophages. These parasites are similar in size to Histoplasma capsulatum, but the “double dot” appearance of the nucleus and kinetoplast is apparent in Leishmania (see center).FIG51
Slide L52
Striking dysgranulopoiesis associated with AIDS, bone marrow aspirate, May-Gruenwald-Giemsa. One of the macropolycytes is likely to be tetraploid (92 chromosomes) and the other to have 138 chromosomes. A normal neutrophil is shown in the lower left for comparison.FIG52
Slide L53
Hodgkin's disease associated with AIDS, bone marrow biopsy, H&E. Total replacement of normal bone marrow by an abnormal infiltrate including two Reed-Sternberg cells (top right).FIG53
Normal and Abnormal Myeloid Cells
Slide M1
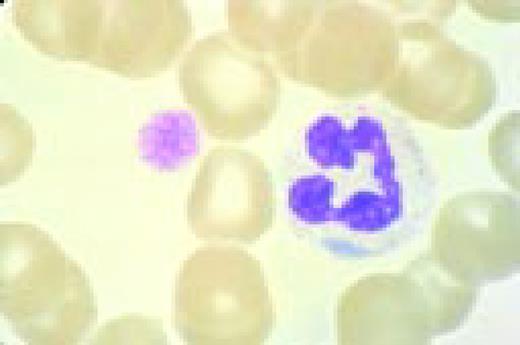
Normal lymphocyte and neutrophil.FIG54
Slide M2
Normal bone marrow cells. Five erythroid precursors (with pyknotic nuclei) are present. The remaining cells are myeloid precursors in varying stages of maturation ranging from myeloblasts to segmented neutrophil.FIG55
Slide M3
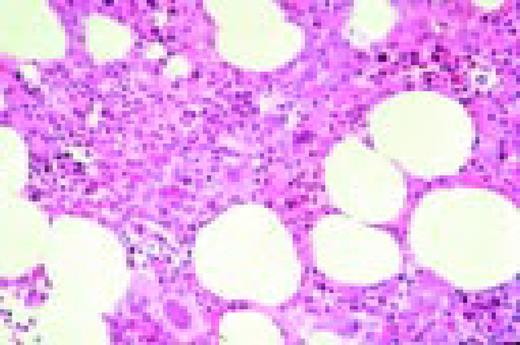
Low-power view of an H&E stained normal bone marrow biopsy. Normal distribution and cellularity are seen. Several distinct megakaryocytes can be recognized because of their large size and multiple nuclear lobes.FIG56
Slide M4
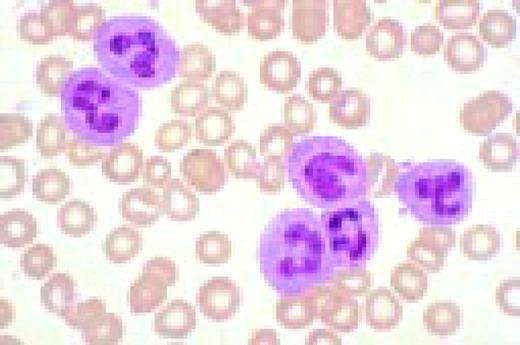
Neutrophilia. Four segmented and two band neutrophils are seen in this low-oil magnification view of the peripheral blood. Some red blood cells are slightly hypochromic.FIG57
Slide M5
May-Hegglin anomaly, peripheral blood. Giant platelets and spindle-shaped Döhle bodies are seen.FIG58
Slide M6
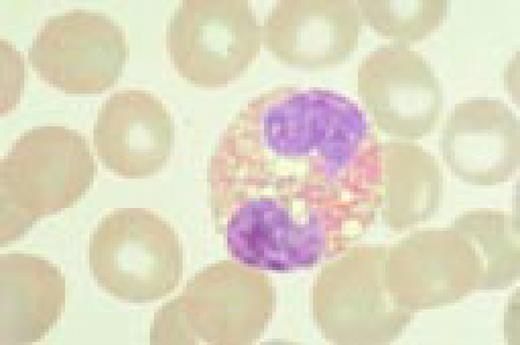
A normal eosinophil and red blood cells.FIG59
Slide M7
Undifferentiated acute leukemia, peripheral blood. Three blasts are seen in the center of the field and a somewhat abnormal neutrophil is seen peripherally.FIG60
Slide M8
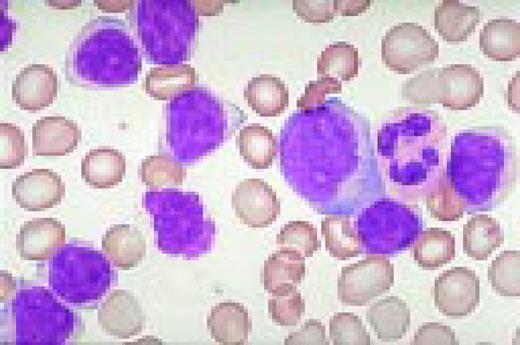
Acute nonlymphoblastic leukemia, FAB classification M0, bone marrow aspirate from a 69-year-old man. The blasts are small or medium sized with no visible cytoplasmic granules, and few are nucleolated. The myeloperoxidase and nonspecific esterase reactions were negative. The myeloid nature of the blasts was documented by (1) immunophenotype expression of CD13, CD33, positive reaction with a monoclonal antibody against myeloperoxidase (anti-MPO), and negative lymphoid markers; and (2) ultrastructural cytochemistry, which demonstrated peroxidase activity localized in small granules.FIG61
Slide M9
Acute nonlymphoblastic leukemia, FAB classification M1, bone marrow aspirate. Virtually all of the cells in the bone marrow were myeloblasts. There was little evidence of maturation beyond the myeloblast stage. Several myeloblasts contain azurophilic granules, and occasional Auer rods are identified.FIG62
Slide M10
Acute nonlymphoblastic leukemia, FAB classification M2, bone marrow aspirate. The blast cells in this marrow contain abundant azurophilic granulation. Numerous long, slender Auer rods are also illustrated in this field. These findings are suggestive of the t(8;21) chromosome abnormality.FIG63
Slide M11
Translocation (8;21). This karyotype is from the patient with M2 acute nonlymphoblastic leukemia whose bone marrow is seen in M10.FIG64
Slide M12
Hypogranular acute promyelocytic leukemia, FAB classification M3, bone marrow aspirate. The myeloblast in the central portion of the photograph contains numerous Auer rods. This cell is referred to as a faggot cell and is found in approximately 90-95% of patients with acute promyelocytic leukemia.FIG65
Slide M13
Translocation (15;17) characteristic of M3 acute leukemia.FIG66
Slide M14
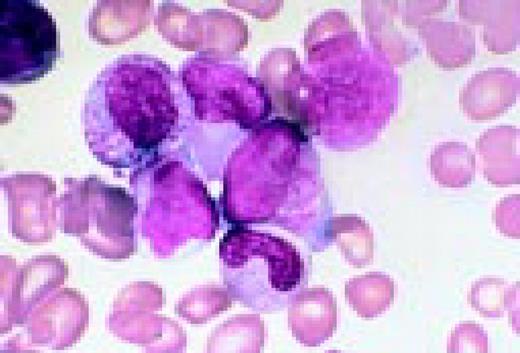
Acute nonlymphoblastic leukemia, FAB classification M4, bone marrow aspirate. The large abnormal blast on the left has distinct monocytoid features, some membrane irregularity, and some cytoplasmic vacuoles as well as gray-blue cytoplasm. The two blasts on the right have very immature nuclear chromatin, nucleoli, and some cellular granules. They are clearly myeloid rather than monocytoid. Thus this field illustrates the two lineages that are characteristic of M4 acute leukemia.FIG67
Slide M15
Acute nonlymphoblastic leukemia, FAB classification M4Eo, bone marrow. It is associated with an inversion of the long arm of chromosome 16. In addition to the promonocytes and early forms, there are many abnormal eosinophils, some of which have coarse basophilic granules.FIG68
Slide M16
Acute nonlymphoblastic leukemia, FAB classification M5a (L) and M5b (R). The M5a blasts have a moderate amount of cytoplasm and somewhat coarse nuclei. The nucleoli are not unusually prominent. The blasts were positive with the nonspecific esterase stain, and the patient had an associated t(9;11) chromosome abnormality.
The predominant M5b cell is a promonocyte. This cell is characterized by abundant cytoplasm with numerous scattered azurophilic granules and a nucleus with finely dispersed nuclear chromatin. The nuclei are marked by extensive lobulation and creasing. Some of the nuclei have a cerebriform appearance.FIG69
Slide M17
Acute nonlymphoblastic leukemia (ANLL), FAB classification M5 with erythrophagocytosis, bone marrow aspirate. This morphological entity is associated with a specific reciprocal translocation that involves the short arms of chromosome t(8;16)(p11;p13).FIG70
Slide M18
Acute nonlymphoblastic leukemia, FAB classification M6, bone marrow aspirate. The giant multinucleated abnormal erythroblast is the striking feature of this field. Next to it one can also appreciate a somewhat distorted myeloblast.FIG71
Slide M19
Acute nonlymphoblastic leukemia, FAB classification M7, peripheral blood. The pleomorphism of the leukemic megakaryoblasts, clearly apparent in this photomicrograph, demonstrates why precise diagnosis of this type of acute leukemia is difficult.FIG72
Slide M20
Therapy-related acute nonlymphoblastic leukemia, FAB classification M1, in a treated myeloma patient, bone marrow aspirate. One myeloma cell and four leukemic myeloblasts are seen in this field.FIG73
Slide M21
Chronic granulocytic leukemia, peripheral blood smear. Neutrophilia is clearly present, as is a modest shift to the left to the band stage. One myelocyte and two very abnormal eosinophils are in the field. Chromosome analysis showed the Philadelphia chromosome, t(9;22).FIG74
Slide M22
Blast crisis in Ph+ chronic granulocytic leukemia, peripheral blood. These blasts are extremely immature.FIG75
Slide M23
Polycythemia vera, bone marrow. Striking hyperplasia and increased megakaryocytes.FIG76
Slide M24
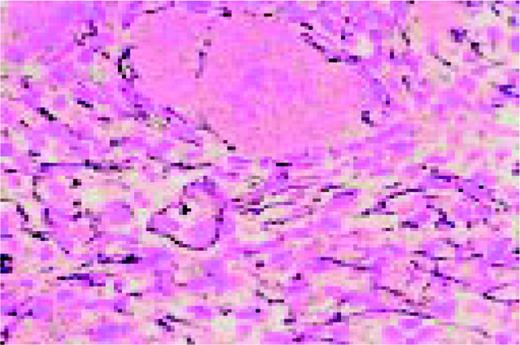
Hemorrhagic thrombocythemia, bone marrow biopsy stained for reticulin. The increased reticulin can be clearly appreciated by the dark strands which are seen throughout this specimen.FIG77
Slide M25
Refractory anemia with ringed siderblasts, peripheral blood. There is a double population of normochromic and hypochromic red blood cells with marked variation in size and shape of the cells, including some macrocytes. The anemia is familial (X-chromosome linked) in this case; the patient has two maternal uncles with the same disorder.FIG78
Slide M26
Myelodysplasia, bone marrow aspirate. There are intense red cell dyspoietic nuclear changes in the pronormoblast and all its progeny. A dividing cell is also seen.FIG79
Slide M27
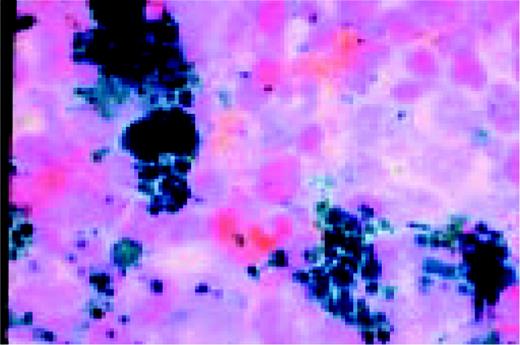
Myelodysplasia, Prussian blue stained bone marrow aspirate. This stain for iron is intensely positive. The dark granules are in storage cells.FIG80
Slide M28
Myelodysplasia, 5q- syndrome, bone marrow biopsy from an adult female. This disorder is characterized by the presence of an increased number of non-lobulated megakaryocytes.FIG81
Slide M29
Ringed sideroblasts in myelodysplasia, bone marrow, Prussian blue stain. Iron deposition in the mitochondria ringing the nucleus creates the ringed sideroblast morphology.FIG82
Megakaryocytes and Platelets
Slide MG1
M7 Acute non-lymphoblastic leukemia (M7) (Acute megakaryocytic leukemia). This high-oil magnification view of a bone marrow aspirate shows the large blasts characteristic of this disease.FIG83
Slide MG2
M7. Bone marrow biopsy in a patient with acute nonlymphoblastic leukemia, FAB type M7. Abnormal megakaryoblasts and megakaryocytes as well as fibrosis are seen in this H&E-stained field.FIG84
Slide MG3
MPO M3. The myeloperoxidase stain is often useful in identifying myeloid blasts. Black granules are characteristic of a positive reaction. This frame shows markedly positive M3 blasts.FIG85
Slide MG4
ITP. Low-oil magnification view of a bone marrow aspirate in a patient with immune thrombocytopenic purpura (ITP). Increased megakaryocytes are reflected in this field where four such large cells are seen. These range from a megakaryoblast (top) to a mature megakaryocyte (middle right).FIG86
Slide MG5
Bernard-Soulier syndrome. High-oil magnification view of a patient with the Bernard-Soulier syndrome. A typical giant platelet is seen in the center of the field.FIG87
Slide MG6
Thrombocythemia. This high oil immersion view is from the peripheral blood of a patient with hemorrhagic thrombocythemia. Thrombocytosis is seen, as is a wide range of morphologic abnormality in the platelets. One even resembles a parasite.FIG88
Slide MG7
Polycythemia vera. Abnormal megakaryocytes, increased cellularity in a bone marrow biopsy.FIG89
Slide MG8
Chronic granulocytic leukemia. Bone marrow aspirate, low oil view, Romanovsky stain, shows micromegakaryocytes.FIG90
Slide MG9
Agnogenic myeloid metaplasia. Bone marrow biopsy, increased and abnormal megakaryocytes, fibrosis. Many megakaryocytes of various sizes, with dysplastic nuclei.FIG91
Slide MG10
MDS. Dyspoietic megakaryocytes.FIG92
Slide MG11
AIDS. A high dry view of a bone marrow biopsy in a patient with AIDS, showing two abnormal megakaryocytes and a hypercellular portion. The stain is H&E.FIG93
Slide MG12
Hemorrhagic thrombocythemia. The low power view of an H&E stained bone marrow biopsy is from a patient of hemorrhagic thrombocythemia. Several very abnormal megakaryocytes are seen in the field.FIG94
Slide MG13
Essential thrombocythemia. This is a high dry view of a Wright's stained bone marrow in a patient with essential thrombocythemia. One extremely abnormal megakaryocyte with multiple lobes is seen, as is a clump of platelets.FIG95
Slide MG14
ITP. This is an electron photomicrograph of a bone marrow aspirate in a patient with ITP. A damaged megakaryocyte has been partially engulfed by a macrophage (M).FIG96
Erythroid Cells
Slide E1
Normal bone marrow aspirate, low power. There is a 2:1 ratio between myeloid and erythroid precursors. The latter are identified by their shrunken, pyknotic (“coal black”) nuclei.FIG97
Slide E2
“Shift” cell. The larger, grey-pink erythrocyte in the center of this field is called a polychromatophilic or “shift” cell. It has newly entered the blood, and is thought to indicate erythropoieitin stimulation of erythropoiesis.FIG98
Slide E3
Reticulocytes. The dark purple reticulin in red blood cells newly entering the blood is demonstrated by this new methylene blue stain.FIG99
Slide E4
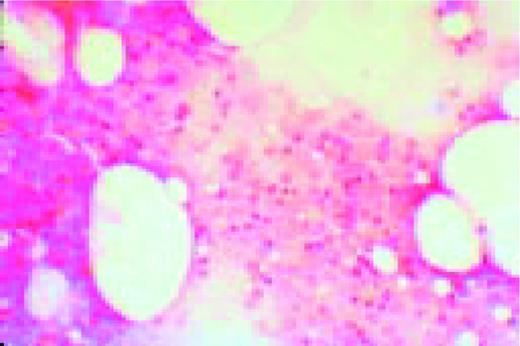
This low-power, H&E stained bone marrow biopsy is from a patient with severe aplastic anemia. The virtually empty marrow can be appreciated by comparing with Slide E5. Even the marrow stroma is scanty.FIG100
Slide E5
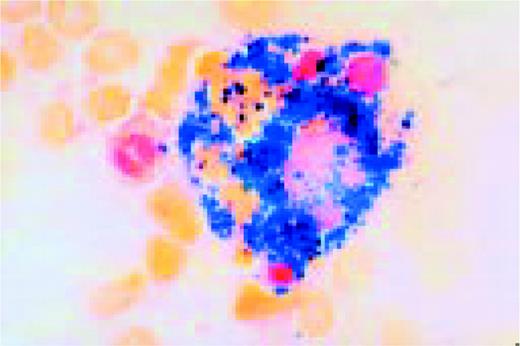
Anemia. This is iron stained bone marrow aspirate is from a patient with the anemia of chronic disease. Heavy dark blue globules of iron are seen in the storage cells pictured.FIG101
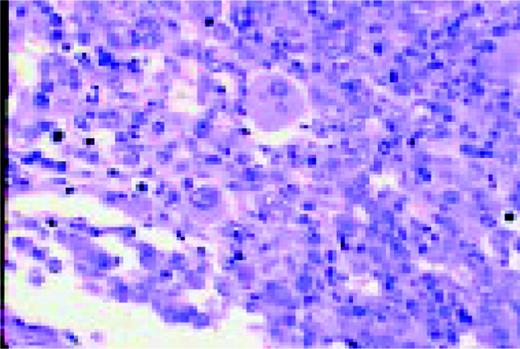
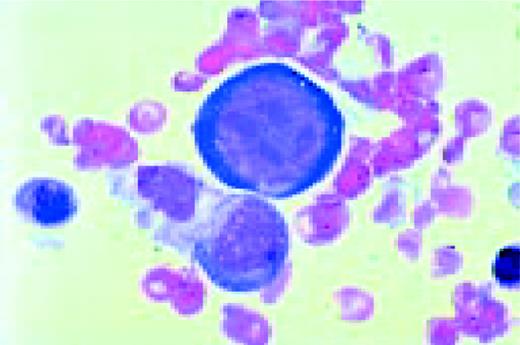
Slide E6 Red cell aplasia (parvovirus infection) giant pronormoblast, BMA. This giant pronormoblast is from the bone marrow aspirate of a patient with red cell aplasia due to parvovirus infectionFIG102
Slide E7
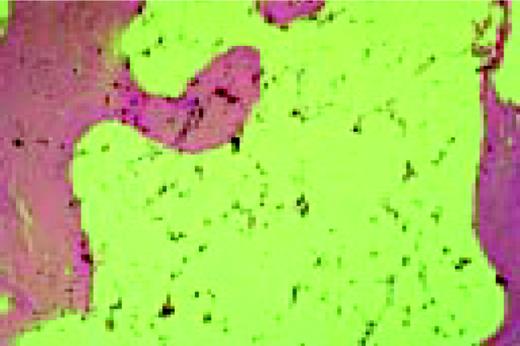
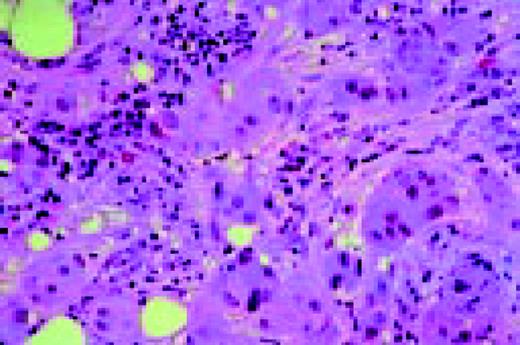
Metastatic breast carcinoma is seen in this low-power H&E stained bone marrow biopsy. The malignancy has virtually replaced normal marrow elementsFIG103
Slide E8
Agnogenic myeloid metaplasia with myelofibrosis. This low-power bone marrow biopsy clearly shows the fibrosis associated with this disease. This H&E-stained preparation shows virtual replacement of the marrow cavity with light pink-staining fibrotic tissue.FIG104
Slide E9
Agnogenic myeloid metaplasia with myelofibrosis, low-magnification, BMB, reticulin stain. This H&E-stained preparation shows virtual replacement of the marrow cavity with light pink-staining fibrosis tissue. A reticulin stain (2) demonstrates the fibrosis as well.FIG105
Slide E10
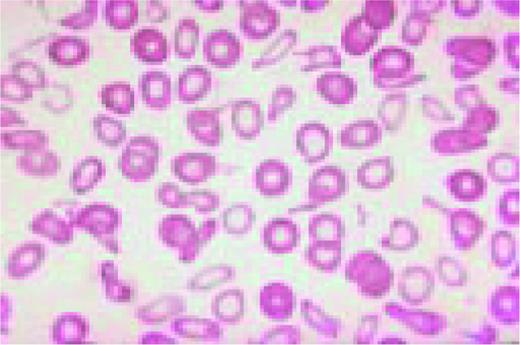
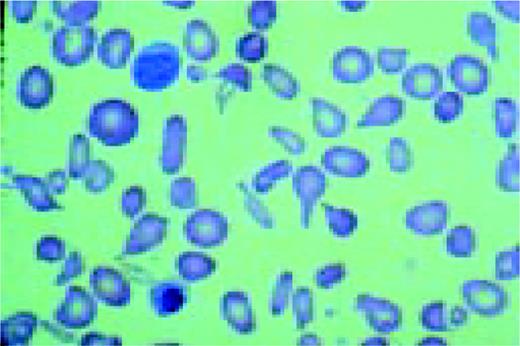
Low-power view of the peripheral blood in a patient with severe iron deficiency anemia. A normal lymphocyte is present (for comparison purposes) to the right of center. Marked anisocytosis and poikilocytosis can be appreciated as can microcytosis and hypochromiaFIG106
Slide E11
These are low-power views of iron stained bone marrow. Normal iron stores are seen as dark blue-staining material.FIG107
Slide E12
Iron-deficient bone marrow. The absence of normal iron stores is a characteristic finding in iron deficiency anemia.FIG108
Slide E13
Homozygous beta-thalassemia. This high-oil magnification view of the peripheral blood shows an orthochromic normoblast to the left of center. Also seen are targeting, hypochromia, and a Howell-Jolly body.FIG109
Slide E14
Alpha-thalassemia, E hemoglobinopathy. A normoblast and lymphocyte and anisocytosis and poikilocytosis are seen in this field.FIG110
Slide E15
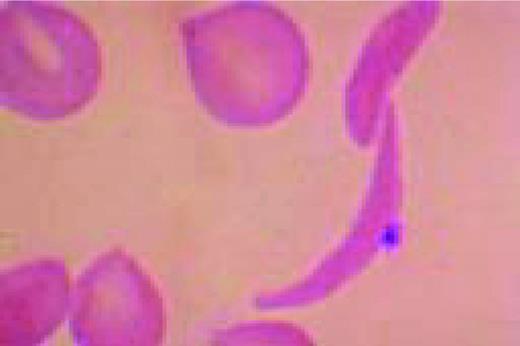
A classic sickle cell is seen in this high-oil magnification field.FIG111
Slide E16
The cell to the right of center is a classic finding in hemoglobin C disease. It represents crystallized hemoglobin C. Also present are targeting and anisocytosis.FIG112
Slide E17
Heinz-body preparation showing dark-staining denatured globin intraerythrocytic particles in a patient with Heinz-body hemolysis.FIG113
Slide E18
Most patients with hemolytic anemia have normal erythropoiesis. Here the ratio of erythroid to myeloid cells in the bone marrow aspirate is less than one, indicating increased erythroid activity in response to the hemolysis.FIG114
Slide E19
This high-oil magnification of the peripheral blood in a patient with hereditary spherocytosis (HS), shows microspherocytes and a normal lymphocyte.FIG115
Slide E20
G-6 PD deficiency. Central to the normal lymphocyte in this high-dry field is a red cell with a blistered appearance. This represents the process where portions of denatured hemoglobin are “bitten” from the cell.FIG116
Slide E21
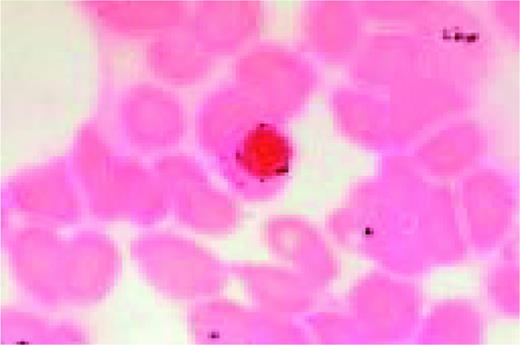
Post splenectomy changes. This high-oil magnification view of the peripheral blood shows three deeply basophilic staining granules peripherally in three different red cells. These are Howell-Jolly bodies. Targeting, anisocytosis and poikilocyosis are also seen.FIG117
Slide E22
Microangiopathy. A shift cell and fragments are in the center of this field. Spherocytosis is also present.FIG118
Slide E23
Hemolytic anemia. Erythrophagocytosis. Four red blood cells (center) have been engulfed by a cell of the monocyte/macrophage line.FIG119
Slide E24
Hemolytic anemia. Marked red cell membrane abnormalities in severe hepatorenal failure, with burr cell and spur cells (L.O., H.O.)FIG120
Slide E25
Pernicious anemia. Marked neutrophil hypersegmentation is seen in this high-oil magnification field.FIG121
Slide E26
Macrocytosis. Pernicious anemia. Peripheral blood in a patient showing a large lymphocyte (top), macrocytosis and an orthochromic megaloblast (bottom). Nuclear-cytoplasmic disproportion is noted in the latter as is beaded nuclear chromatin.FIG122
Slide E27
Pernicious anemia. Megaloblasts in the bone marrow aspirate at high-oil magnification. Pervading both frames is the characteristic open, beaded nuclear chromatin and nuclear- cytoplasmic disproportion. (L) The large central cell is a promegaloblast. (R) The large cell below center is a basophilic megaloblast. The two cells above are polychromatophilic megaloblasts.FIG123
Slide E28
Therapy-related myelodysplasia. Peripheral blood smear (high dry magnification) from a patient with therapy related myelodysplasia. Dysmorphic red cells and a markedly abnormal granulocyte are seen.FIG124
Slide E29
Refractory Anemia with excess blasts in transformation (RAEBT). Several blasts with nucleoli as well as abnormal red cells and granulocytes are seen in this field.FIG125
Slide E30
Myelodysplasia. (L) Marked erythroid dyspoiesis is seen in this high-dry view. Diagnosis was Refractory anemia with ring sideroblasts (RARS) (R) An iron-stain in the same patient showing perinuclear rings of iron-laden mitochondria.FIG126

