The diagnosis and classification of myelodysplastic syndromes (MDS) have undergone several iterations since their criteria were initially codified by the French-American-British Classification in 1982.1 These sequential classification systems have adapted by incorporating new data (for example, the definition of MDS with isolated del[5q] was recently expanded to include up to one other cytogenetic abnormality) but have generally been faithful to the core precedent of prior classification systems. The current World Health Organization (WHO) classification of MDS still relies largely on morphologic parameters in establishing the disease subtypes.2 Indeed, specific dysplastic cytologic features of hematopoietic cells have been validated as both diagnostic and prognostic criteria in MDS.3,4 However, evaluating dysplasia is inherently subjective, and the dysplastic lineage(s) identified are frequently incongruent with the patient’s actual cytopenias.5 Moreover, interrogation of MDS by next-generation sequencing data in recent years has elucidated a remarkable genetic heterogeneity of MDS6,7 ; yet uncertainty remains regarding how to incorporate these new data into the current classification scheme and how the different morphologic appearances of MDS may relate to the myriad mutation patterns.
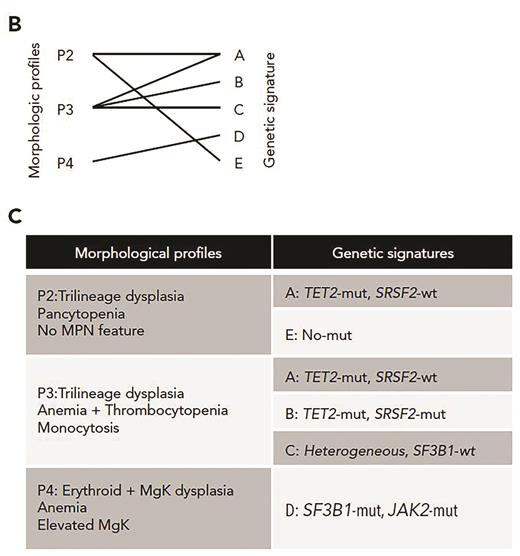
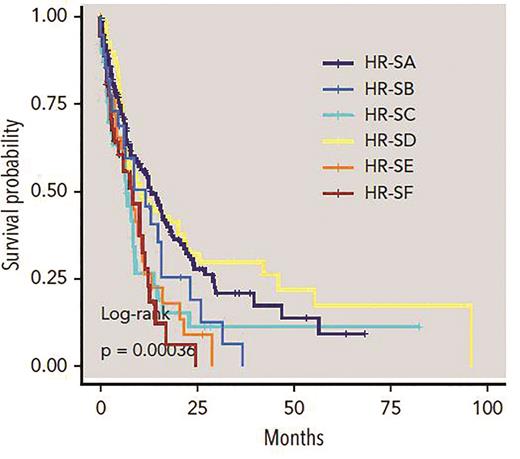
Dr. Yasunobu Nagata and colleagues applied machine learning algorithms to a series of 1,097 patients with genetically characterized myeloid neoplasms. Their samples included MDS as well as some myelodysplastic/myeloproliferative neoplasms (MDS/MPN) and acute myeloid leukemia that had evolved from MDS or MDS/MPN. Rather than using existing WHO disease subtypes, they distilled the morphology (and clinical features such as blood counts) into 24 distinct individual parameters that were each scored by an experienced pathologist and correlated with specific gene mutations. They identified several significant associations between individual morphologic/cytopenia parameters and mutations, indicating that the type of dysplasia we see through the microscope is indeed a manifestation of the specific mutation portfolio in each unique MDS case. Unsupervised analysis based on consensus clustering revealed five patterns of co-occurring morphologic features, termed morphologic “profiles” (Figure 1, P1-P5). While some of these profiles bore strong resemblance to well-established disease subtypes, such as MDS with excess blasts or chronic myelomonocytic leukemia (CMML), other profiles did not correspond to any WHO disease subtype. The authors also applied Bayesian machine learning techniques to create eight signatures of somatic mutations in their cohort and correlated these global signatures with the morphologic profiles. In cases lacking excess blasts (termed the “low-risk” group), they found six significant morphologic-genetic profile associations that were identified in both discovery and validation cohorts (Figure 1). These included well-known associations such as the correlation of morphologic features of the WHO entity MDS/MPN with ring sideroblasts, and thrombocytosis (MDS/MPN-RS-T) with co-mutation of SF3B1 and JAK2. However, they also found unexpected heterogeneity and overlap in some morphologic profiles: for example, the “CMML-like” profile included both the well-known TET2 and SRSF2 co-mutated signature, but also a signature characterized by TET2 mutation and wildtype SRSF2. Genetic signature heterogeneity was also observed in the subset of cases with excess blasts (termed the “high-risk” group), which included six discrete signatures such as TP53, U2AF1, or DNMT3A mutations; significant differences in survival were found among the different genetic signatures even within these excess blast cases (Figure 2).
Validated morphologic profiles and genetic signatures in low-risk MDS. (B) Diagram depicting 6 validated morphologic and genetic associations between three of the morphologic profiles (P2, P3, P4) and five genetic signatures. (C) Resultant validated associations between three morphologic profiles and the genetic signatures. Adapted from Nagata Y et al. Blood. 2020;136:2249-2262.
Validated morphologic profiles and genetic signatures in low-risk MDS. (B) Diagram depicting 6 validated morphologic and genetic associations between three of the morphologic profiles (P2, P3, P4) and five genetic signatures. (C) Resultant validated associations between three morphologic profiles and the genetic signatures. Adapted from Nagata Y et al. Blood. 2020;136:2249-2262.
Genetics signatures in high-risk MDS. Kaplan-Meier curves compare overall survival among patients identified by six genetic subtypes within high-risk disease; the P value is from the log-rank test. Adapted from Nagata Y et al. Blood. 2020;136:2249-2262.
Genetics signatures in high-risk MDS. Kaplan-Meier curves compare overall survival among patients identified by six genetic subtypes within high-risk disease; the P value is from the log-rank test. Adapted from Nagata Y et al. Blood. 2020;136:2249-2262.
In Brief
This work demonstrates that discrete disease subtypes indeed can be created among the heterogeneous group of MDS and related entities, by using the simple building blocks of morphologic observations, blood counts, and genetic mutation profiles, devoid of any potentially biased assumptions taken from historic classifications. Gratifyingly, some of these “objectively created” subtypes do overlap with current WHO classification disease entities. For example, bone marrow blast count, a cornerstone of the classification and risk stratification of all myeloid neoplasms, emerged as a critical parameter in this unbiased analysis. However, some other associations, such as the profile defined by pancytopenia, trilineage dysplasia, and lack of any MPN features (increased megakaryocytes, fibrosis, or monocytosis) or excess blasts, do not have any clear equivalent in the WHO scheme. The closest equivalent, MDS with multilineage dysplasia, only requires bi-lineage dysplasia and a single cytopenia.
The term “machine learning” strikes fear into the hearts of some pathologists who worry that computer-assisted diagnosis will ultimately replace their professionally honed yet subjective interpretations of microscopic disease pathology. In fact, the work of Dr. Nagata and colleagues shows how machine learning can be a tool to perfect our classification of disease and validate the significance of morphologic findings with respect to clinically relevant disease subtyping.8 The associations they found show that MDS morphology is indeed (at least in part) an expression of the underlying mutation patterns, and that the morphologic features we see associate in nonrandom ways to reflect subgroups of MDS with different clinical outcomes. While it is encouraging that this analysis confirmed the validity of some MDS subtypes devised decades ago, it also encourages us to do better in the future by incorporating both molecular and morphologic features in an improved and truly evidence-based MDS classification system. Going forward, artificial intelligence bioinformatics will undoubtedly be a critical tool in this process.
References
Competing Interests
Dr. Hasserjian indicated no relevant conflicts of interest.


