

Abstract
Historically considered a lymphoma with limited treatment options and poor outcomes, the treatment landscape in mantle cell lymphoma (MCL) has evolved remarkably in the last decade. Chemoimmunotherapy (CIT) remains the primary frontline treatment for most patients with MCL, typically with an intensive approach in younger and fit patients. The role of consolidative autologous stem cell transplantation remains controversial, with recent data further questioning its benefit. Novel agents have shown promising results in recent frontline clinical trials and challenge the current paradigm in MCL, particularly in high-risk patients who generally have poor outcomes with CIT. Risk stratification is key to incorporating novel agents in the frontline treatment of MCL, identifying patients who do not benefit from or could be spared CIT, guiding treatment intensity and duration, and improving overall outcomes, including safety and quality of life. The MCL International Prognostic Index and Ki-67 play an important role in identifying patients with high-risk MCL. TP53 aberrations, particularly mutations, currently identify patients with the highest risk, limited benefit from CIT, and greatest need for novel therapies. Other genetic aberrations and biological clusters are being identified but currently have limited clinical utility.
Learning Objectives
Identify the clinical, biological, and genetic factors associated with high-risk MCL
Review currently available treatment options and ongoing clinical trials for patients with treatment-naive high-risk MCL
Introduction
Although defining high-risk mantle cell lymphoma (MCL) is not straightforward given the disease heterogeneity, variable clinical and biological risk factors, and lack of a unified treatment approach, it is crucial to incorporate novel therapies in risk-adapted approaches to improve outcomes.
CLINICAL CASE
A 62-year-old man presented with rapidly enlarging cervical lymph nodes with evidence of extensive lymph node and subcutaneous involvement on positron emission tomography/computed tomography. Lymph node biopsy showed MCL with blastoid morphology, a Ki-67 of 85%, and a NOTCH1 mutation without TP53 mutation on a next-generation sequencing panel. Cytogenetics from an involved bone marrow biopsy showed a complex karyotype without deletion 17p (del17p). He had a performance status of 1, a serum lactate dehydrogenase level of 530 U/L (upper limit of normal = 190 U/L), and a white blood cell count of 7.5 K/µL. Does this patient have high-risk MCL?
Defining high-risk MCL
MIPI and tumor cell proliferation rate by Ki-67
The MIPI score integrates pretreatment age, performance status, serum lactate dehydrogenase, and white blood cell count into a complex calculation to stratify patients with MCL into 3 risk groups with distinct outcomes.1 The biologic MIPI (MIPI-b) integrates Ki-67 as a continuous variable; the combination MIPI (MIPI-c) combines Ki-67 as a binary factor (< or ≥30%), stratifying patients into 4 risk groups with distinct 5-year overall survival (OS) rates ranging from 85% to 17%.1,2 Recent data suggest that a Ki-67 cutoff of 50% might be more prognostic.3 The MIPI and MIPI-c have been validated in several clinical trials of different chemoimmunotherapy (CIT) regimens (Tables 1-3).
Selected frontline CIT trials in MCL with outcomes of high-risk patients highlighted
| Trial (n) | Treatment(s) | High-risk patients | Outcomes | |
|---|---|---|---|---|
| Overall population | High-risk patients | |||
| European MCL Younger (n = 466)48 | R-CHOP/R-DHAP → ASCT vs R-CHOP → ASCT | High MIPI = 14% High MIPI-c = 5% Ki-67 ≥ 30% = 27% Blastoid = 9% p53 > 50% = 12% | R-CHOP/R-DHAP: mTTF = 8 y; mOS = NR R-CHOP: mTTF = 4 y; mOS = 11 y | Benefit in TTF from HDAC was similar across MIPI and MIPI-c risk groups, Ki-67, morphology, and “tended” to be stronger in p53 overexpression |
| LYMA (n = 240)49,50 | R-DHAP/ASCT followed by rituximab vs observation | High MIPI = 18% Ki-67 > 30% = 35% Blastoid = 10% | Rituximab: mEFS = NR, 7-y OS = 83% Observation: mEFS = 6 y, 7-y OS = 72% | High MIPI: mPFS and OS = 3.9 and 4.7 y |
| Retrospective/phase 2 (n = 88)51 | BR/R-HDAC | High MIPI = 19% Ki-67 > 30% = 24% Blastoid/pleomorphic = 12% | 3-y PFS = 83% 3-y OS = 92% | High MIPI 3-y PFS 76% Blastoid/pleomorphic 3-y PFS 66% No association between PFS and Ki-67 > 30% |
| Single-center phase 2 (n = 97)52 | R-HCVAD | Ki-67 ≥ 30% = 8% Blastoid/pleomorphic = 15% | MIPI predicted OS in overall and older patient cohorts Blastoid not associated with EFS or OS | |
| Nordic MCL2 and MCL3 trials (n = 321, MCL2 = 159, MCL3 = 162)6,53,54 | R-maxi-CHOP + R-HDAC | High MIPI = 22% Ki-67 ≥ 30% = 42% Blastoid = 18% | mPFS = 8 y mOS = 12.5 y | High MIPI: mPFS and mOS = 2.5 and 4 y MIPI but not blastoid morphology associated PFS and OS in MVA TP53 mutation: median PFS and OS = 0.9 and 1.8 y Del17 (without TP53 mutation): PFS = 3.1 y and OS = 8 y |
| Phase 2 (n = 57)55 | R-BAC | High MIPI = 44% Ki-67 ≥ 30% = 31% Blastoid/pleomorphic = 25% | 7-y PFS = 55% 7-y OS = 63% | Morphology strongest factor for PFS in MVA |
MIPI-c, Combined MIPI; mEFS, median event-free survival; mOS, median OS; mPFS, median PFS; mTTF, median time to treatment failure; MVA, multivariate analysis; NR, not reached.
Aggressive morphological variants
The aggressive pleomorphic and blastoid variants are present in 10% to 20% of patients.2,4 In an analysis of the European MCL Younger and Elderly trials, patients with blastoid/pleomorphic MCL had 5-year progression-free survival (PFS) and an OS of 29% and 35% compared with 44% and 68%, respectively, in patients with non-blastoid MCL. However, their negative prognostic impact was explained mainly by their association with a high Ki-67 index.2,5 In a multicenter retrospective study of 207 patients with blastoid/pleomorphic MCL treated heterogeneously, the median PFS and OS were 38 and 68 months, respectively.4
Genetic aberrations
Among currently available prognostic factors, TP53 aberrations (TP53 mutations and del17p) have the strongest association with poor outcomes.6,7 In an analysis of the Nordic MCL2 and MCL3 trials of younger patients treated with intensive CIT, 39 patients (23%) had TP53 aberrations (del17p; n = 29 [16%]; TP53 mutation, n = 20 [11%]; both, n = 9 [5%]).6 In multivariate analyses incorporating TP53 mutations and del17p, NOTCH1 mutation, CDKN2A deletion, blastoid morphology, and high-risk MIPI-c, only TP53 mutations and high-risk MIPI-c had an impact on PFS, whereas only TP53 mutations affected OS. The PFS and OS for patients with TP53 mutation were 0.9 and 1.8 years, compared with 10.2 years and not reached for patients without TP53 mutations. Further, outcomes of patients with TP53 mutations were inferior to those with del17p (median PFS and OS of 3.1 and 8 years). Patients with TP53 mutations were also less likely to achieve a complete response (CR) before and after autologous stem cell transplantation (ASCT).
Missense TP53 mutations (which constitute >80%-90% of TP53 mutations in MCL6,8,9) lead to p53 accumulation in the cell nucleus, which can be detected by immunohistochemistry and might serve as a surrogate marker for TP53 mutations.10,11 In an analysis of 348 patients treated on the MCL Younger and Elderly trials, p53 expression over 50%, present in 16% of patients, was associated with inferior time-to-treatment failure and OS even after adjusting for MIPI and Ki-67. However, unlike TP53 mutations, the negative prognostic impact of p53 overexpression was lost in patients treated with intensive CIT and ASCT. Although more data are needed, 1 study reported a sensitivity of 75% to 82% and a specificity of 95% to 100% for p53 overexpression (defined as >30% in this study) for detecting TP53 missense mutations in paired samples.8,9,12
To further improve on MIPI-c, an analysis of the MCL Younger and Elderly trials with validation from MCL0208 and Nordic-MCL4 trials tested different combinations of MIPI-c, Ki-67, and p53 expression greater than 50% to define high- and low-risk groups.5 The combination of p53 overexpression or high MIPI-c had the highest discriminatory power, identifying 22% of patients as high risk, with a median failure-free survival (FFS) and OS of 1.1 and 2.2 years compared with 5.6 and 13.2 years in the low-risk group, respectively. Poor outcomes in the high-risk group were seen irrespective of treatment type or intensity.5
Complex karyotype was associated with inferior outcomes in retrospective studies, although most of these studies lacked data on TP53 mutations.13-15
CLINICAL CASE (continued)
Our patient had high-risk MIPI and MIPI-c, high Ki-67, blastoid morphology, NOTCH1 mutation, and complex karyotype without TP53 aberrations. How would you treat a similar patient?
Treatment of patients with high-risk MCL
While there is no standard frontline therapy for MCL, treatment typically consists of CIT, commonly incorporating high-dose cytarabine (HDAC) and with consideration for ASCT in younger and fit patients, followed by rituximab maintenance (RM). As discussed later, the Bruton's tyrosine kinase inhibitors (BTKis) might also be incorporated into frontline treatment. This approach is followed for most patients regardless of their disease risk, with 1 notable exception. Because patients with TP53 mutations have poor outcomes with CIT, even if intensive and followed by ASCT,6,7 and poor outcomes with second-line treatments, including single-agent BTKi,16,17 these patients should be prioritized for clinical trials and approached as if they are destined to require chimeric antigen receptor (CAR) T-cell therapy (if feasible) in the near future. This strategy requires early planning and may affect the choice of frontline CIT, given worse outcomes with CAR T cells in patients who have recently received bendamustine.18-20 Allogeneic stem cell transplantation, as consolidation during the first CR or at first relapse, is a consideration for select eligible patients, particularly where CAR T-cell therapy is not available.21,22
Two main strategies have been pursued to improve outcomes in MCL, including in high-risk patients: (1) incorporating novel agents with CIT and (2) substituting CIT with a combination of novel agents (Tables 2-4). Minimal residual disease assessment is also being explored to guide treatment decisions.
Incorporating novel agents with CIT
As the preferred second-line treatment for patients with MCL, the BTKis have been combined with frontline CIT in several trials (Table 2). The SHINE phase 3 trial randomized older patients to bendamustine plus rituximab (BR) alone or with ibrutinib (until progression/intolerance), with all patients receiving RM.23 Although adding ibrutinib improved PFS (median 81 vs 53 months), it did not improve OS and led to significant toxicities. Further, patients with high-risk simplified MIPI (s-MIPI), TP53 mutations, and blastoid/pleomorphic morphology did not have a statistically significant improvement in PFS. The ECHO phase 3 trial randomized older patients to BR alone or with acalabrutinib until progression/intolerance, with all patients receiving RM.24 In data presented in abstract form, adding acalabrutinib improved PFS (median 66 vs 50 months), with a trend for OS improvement despite 69% crossover in the placebo arm. Outcomes in high-risk patients were not reported.24 The TRIANGLE phase 3 trial randomized younger transplant-eligible patients with MCL to 1 of 3 cohorts: (1) R-CHOP (rituximab, cyclophosphamide, doxorubicin, vincristine, prednisone) alternating with R-DHAP(X) (rituximab, dexamethasone, HDAC, cisplatin/oxaliplatin) followed by ASCT, (2) ibrutinib plus R-CHOP/R-DHAP(X) followed by ASCT and ibrutinib maintenance, and (3) ibrutinib plus R-CHOP/R-DHAP(X) followed by ibrutinib maintenance without ASCT.25 RM for 3 years was later added in all cohorts. High-risk features included p53 overexpression (>50%) in 13% and high-risk biology (p53 overexpression or high MIPI-c) in 20%. Adding ibrutinib improved the 3-year FFS (88% in the ibrutinib/ASCT cohort and 86% in the ibrutinib-only cohort vs 72% in the ASCT-only cohort). Data on OS and a comparison of outcomes between the 2 ibrutinib cohorts remain immature. Importantly, the benefit from ibrutinib in both cohorts was maintained in patients with high-risk disease, including high-risk MIPI and Ki-67 ≥ 30%, and was more remarkable in patients with p53 overexpression.
Selected frontline trials in MCL incorporating novel agents and CIT with outcomes of high-risk patients highlighted
| Trial | Treatment(s) | High-risk patients | Outcomes | |
|---|---|---|---|---|
| Overall | High-risk patients | |||
| SHINE23 (phase 3, n = 523) | BR and RM with ibrutinib or placebo | High s-MIPI = 34% Blastoid = 9% TP53 mutated = 10% | PFS 81 months (BR + ibrutinib) vs 53 mo (BR) | No benefit from ibrutinib in high-risk s-MIPI (HR, 1.02; 95% CI, 0.7-1.5) or mutated TP53 (mPFS, 29 mo vs 11 mo; HR, 0.95; 95% CI, 0.5-1.8). For blastoid: median PFS 26 mo (95% CI, 6-84) with ibrutinib vs 10 mo (95% CI, 6-44 mo) with placebo. |
| ECHO24 (phase 3, n = 598) | BR and RM with acalabrutinib or placebo | High s-MIPI = 24% Ki-67 ≥ 30% = 48% Blastoid = 13% TP53 mutated = 9% | PFS 66 mo (BR + acalabrutinib) vs 50 mo (BR) | Not reported |
| TRIANGLE25 (phase 3, n = 870) | 3 arms (A, I, A + I) (A) R-CHOP/R-DHAP(X) → ASCT (I) Ibrutinib + R-CHOP/ R-DHAP(X) → ibrutinib maintenance (A+I) Ibrutinib + R-CHOP/ R-DHAP(X) → ASCT → ibrutinib maintenance | High MIPI = 15% Ki-67 ≥ 30% = 32% Blastoid = 12% p53 > 50% = 14% High-risk biology = 20% | 3-y FFS: A + I, 88% I, 86% A, 72% 3-y OS: A + I, 91% I, 92% A, 86% | A ± I vs A: High MIPI: HR = 0.58 (98.3% CI, 0-1.32) Blastoid: HR, 0.59 (0-1.63) Ki-67 ≥ 30%: HR, 0.43 (0-0.83) p53 expression >50%: HR, 0.14 (0-0.57) High-risk biology: HR, 0.31 (0-0.78) A vs I: High MIPI: HR, 1.86 (98.3% CI, 0-4.25) Blastoid: HR, 1.01 (0-2.52) Ki-67 ≥ 30%: HR, 2.5 (0-4.78) p53 expression >50%: HR, 3.24 (0-8.5) High-risk biology: HR, 2.24 (0-4.85) |
| WINDOW-126 (phase 2, n = 131) | Ibrutinib + rituximab → HCVAD/MA x4-8 cycles | High MIPI = 8% High MIPI-b = 36% Blastoid = 12% Ki-67 ≥ 30% = 45% TP53 aberrations 32% | 3-y PFS 79% 3-y OS 95% | CR rate: TP53-mutated 55% vs 91% PFS: Ki-67 ≥ 30% (HR, 2.73; P = .017) Low/intermediate MIPI-b (HR. 0.17 and 0.24; P = .004) Classic vs blastoid (HR, 0.24; P < .001) TP53 aberrations (HR, 3.87; P = .069) |
| WINDOW-227 (phase 2, n = 50) | Ibrutinib, rituximab, venetoclax → HCVAD/MA × 0-4 cycles | High s-MIPI = 6% Blastoid = 12% TP53 aberrations = 25% Ki-67 ≥ 30% = 41% | 3-y PFS 86% 3-y OS 86% | PFS and OS not significantly different based on s-MIPI and TP53 status PFS and OS inferior in Ki-67 ≥ 50% and blastoid |
| WAMM33 (phase 2, n = 444) | Rituximab + acalabrutinib → R-DHAX → ASCT | Ki-67 > 30% = 66% Blastoid = 9% | 2-y PFS 73% 2-y OS 79% | Not reported |
| VR-BAC28 (phase 2, n = 54) | R-BAC + venetoclax | Ki-67 ≥ 30% = 63% Blastoid = 24% TP53 aberrations = 63% | 2-y PFS 58% 2-y OS 66% | Blastoid morphology and TP53 mutations were associated with inferior outcomes in multivariate analysis. |
HR, hazard ratio.
The WINDOW-1 and WINDOW-2 trials took a different approach, starting with ibrutinib and rituximab (IR) (WINDOW-1, n = 131; 32% with TP53 aberrations) or IR plus venetoclax (IRV) (WINDOW-2, n = 50; 25% with TP53 aberrations) and followed by 0 to 8 cycles of R-HCVAD (rituximab, cyclophosphamide, vincristine, doxorubicin, dexamethasone) alternating with methotrexate/cytarabine, depending on the response to IR/IRV and disease risk.26,27 The 3-year PFS and OS were 79% and 95% in WINDOW-1 and 86% each in WINDOW-2.
A phase 2 trial treated older or unfit patients with high-risk disease (blastoid, Ki67 ≥ 30%, or TP53 aberrations) with 4 cycles of R-BAC (BR + cytarabine) followed by venetoclax consolidation and maintenance.28 The 2-year PFS and OS for the 54 patients with high-risk disease (63% had TP53 aberration) were 58% and 66%, respectively, compared with 85% and 88% in those with low-risk disease who received 6 cycles of R-BAC only.28
Novel agents without CIT
Two trials investigated frontline IR in patients without aggressive features (such as blastoid or Ki-67 > 30%-50%) but included a small number of patients with TP53 aberrations (<20%), which was associated with inferior outcomes (Table 3).29,30 A similar trial investigated AR in 50 patients aged 65 years or older with 22% having high-risk s-MIPI; 8% blastoid/pleomorphic; and 28% TP53 aberrations (23% with mutations). The 2-year PFS and OS were 92% and 96%, respectively. The outcomes in patients with TP53 aberrations were not reported.31
Selected frontline trials of novel agents in MCL with outcomes of high-risk patients highlighted
| Trial | Treatment(s) | High-risk patients | Outcomes | |
|---|---|---|---|---|
| Overall | High-risk patients | |||
| IMCL-201529 (phase 2, n = 50) | Ibrutinib + rituximab | Blastoid and Ki-67 ≥ 30% excluded High MIPI = 38% TP53 mutations = 15% | 3-y PFS 93% 3-y OS 92% | High MIPI and TP53 aberrations associated with inferior PFS and OS. In TP53 mutated, mPFS of 39 mo vs not reached in wild type. |
| NCT0188056730 (phase 2, n = 50) | Ibrutinib + rituximab | Blastoid and Ki-67 ≥ 50% excluded High s-MIPI = 16% High MIPI-b = 28% TP53 aberrations = 17% | 3-y PFS 87% 3-y OS 94% | Ki-67 30-50% associated with lower ORR/CR rate. High s-MIPI associated with inferior PFS. TP53 aberrations associated with inferior OS but not PFS. |
| NCT0521418331 (phase 2, n = 50) | Acalabrutinib + rituximab | High s-MIPI = 22% Blastoid = 8% TP53 aberrations = 28% (23% with mutations) | 2-y PFS 92% 2-y OS 96% | Not reported |
| OAsIs I35,36 (phase 1/2, n = 15, treatment-naive cohort) | Ibrutinib, obinutuzumab, and venetoclax | High MIPI = 27% High MIPI-b = 55% TP53 mutation = 13% del17p deletion = 40% | 4-y PFS 80% 4-y OS 93% | Not reported |
| ACE-LY-10638 (phase 1b, n = 21) | Acalabrutinib, rituximab, and venetoclax | High s-MIPI = 19% Blastoid = 5% Ki-67 ≥ 30% = 48% | 2-y PFS 54% (95% when censored for COVID-19 deaths) 2-y OS 74% | Not reported |
| BOVen39 (phase 2, n = 25) | Zanubrutinib, obinutuzumab, and venetoclax | High MIPI = 68% Ki-67 ≥ 30% = 67% Blastoid = 20% TP53 mutated = 100% Del17p = 48% | 2-year PFS 72% 2-y PFS 75% | No significant association between disease-free survival and baseline factors, including Ki-67, morphology, and biallelic TP53 inactivation |
| NCT0386318443 (phase 2, n = 24) | Acalabrutinib, lenalidomide, and rituximab | High MIPI = 21% Ki-67 ≥ 30% = 29% TP53 mutations = 29% | 2-y PFS 87% 2-y OS 100% | TP53 mutations but not MIPI or Ki-67 were associated with inferior PFS |
| NCT0352397544 (phase 1, n = 29 | Venetoclax, lenalidomide, and rituximab | High MIPI = 88% Blastoid = 21% Ki-67 ≥ 30% = 66% TP53 mutation = 17% | 2-y PFS 89% 2-y OS 92% | PFS inferior in patients with TP53 mutation (median: 9 mo vs not reached) |
Venetoclax improved outcomes when combined with BTKi in the relapsed setting, including in high-risk disease.32 In the AIM trial of ibrutinib plus venetoclax (IV), 6 out of 12 patients with relapsed TP53-aberrant MCL achieved CR, all of whom remained in remission for 1 year or longer.32 In an analysis of patients with TP53-mutated MCL treated on the SYMPATICO trial, IV resulted in superior PFS in the 45 patients with relapsed TP53-mutated MCL compared with ibrutinib plus placebo (median PFS of 21 vs 11 months) and historical data.17,33,34 The same analysis included 29 patients with treatment-naive (TN) TP53-mutated MCL treated with IV with a median PFS of 22 months. The OAsIs I study of IV plus obinutuzumab included 15 patients with TN-MCL, of whom 27% had high-risk MIPI; 13% TP53 mutation; and 40% del17p. The 4-year PFS and OS were 80% and 93%, respectively.35,36 The combination of acalabrutinib, venetoclax, and rituximab has been studied in a phase 1b trial of 21 patients with TN-MCL with 19% having high-risk s-MIPI; 5% blastoid/pleomorphic; and 48% Ki-67 ≥ 30%.37 The 2-year PFS and OS were 63% and 75%, respectively (the 2-year PFS increased to 95% when COVID-19 deaths were censored).38 The phase 2 BOVen trial evaluated the combination of zanubrutinib, obinutuzumab, and venetoclax in 25 patients with TP53-mutated TN-MCL for at least 2 years.39 Additional high-risk features included blastoid 20%; Ki-67 ≥ 30%, 67%; high-risk MIPI 68%; and del17p 48%. The 2-year PFS and OS were 72% and 75%, respectively. Baseline factors, including Ki-67, morphology, and biallelic TP53 inactivation, did not have an impact on disease- free survival.39
Building on its activity in the frontline and relapsed settings,40 the combination of lenalidomide plus rituximab (R2) has also served as a backbone for incorporating other novel agents. In TP53-mutated relapsed MCL, R2 plus ibrutinib (PHILEMON trial) resulted in a high CR rate (64%) but a short PFS (median <1 year), whereas R2 plus venetoclax (VALERIA trial) resulted in a low CR rate (33%) and a short PFS (1-year = 33%).41,42 In TN-MCL, the combination of acalabrutinib and R2 was investigated in a phase 2 trial of 24 patients.43 High-risk features included high-risk MIPI in 21%, Ki-67 ≥ 30% in 29%, and TP53 mutations in 29%. The 2-year PFS and OS were 87% and 100%, respectively. TP53 mutations but not MIPI or Ki-67 were associated with inferior PFS. An expansion phase with acalabrutinib, lenalidomide, and obinutuzumab is ongoing. The combination of venetoclax and R2 was investigated in a phase 1 trial of 29 patients.44 High-risk features included high-risk MIPI in 88%, blastoid in 21%, Ki-67 ≥ 30% in 66%, and TP53 mutation in 17%. The ORR and CR rates were 96% and 86%, respectively. The 2-year PFS and OS were 89% and 92%, respectively. The ORR, CR rate, and PFS (median 9 months vs not reached) were inferior in patients with TP53 mutation.44
CAR T-cell therapy and the CD3xCD20 bispecific antibodies (discussed in detail in another article in this series) have shown remarkable activity, including high CR rates and durable remissions in high-risk relapsed MCL.18,19,45,46 However, outcomes with CAR T-cell therapy might be affected by certain high-risk features such as high Ki-67 and TP53 mutations,19 although this needs confirmation given the mixed results seen in relatively small studies, while data on the bispecific antibodies in patients with these high-risk features are still lacking.
CLINICAL CASE (continued)
The patient was enrolled in a clinical trial (EA4181) and randomized to BR plus acalabrutinib. He achieved CR, but his MCL relapsed 3 months later. He received 1 cycle of rituximab plus HDAC (R-HDAC) (without clinical reponse) followed by CAR T-cell therapy (brexucabtagene-autoleucel). He achieved CR and has been in remission for 3 years.
Conclusions and future directions
The TRIANGLE trial supports incorporating BTKis in frontline treatment for younger and fit patients (Figure 1). It is especially encouraging to see improved outcomes with the addition of ibrutinib in high-risk patients, including those with p53 overexpression. Results of the phase 2 ECOG-ACRIN EA4181 study, which randomized patients aged 70 years and younger to (1) BR/R-HDAC, (2) BR/R-HDAC plus acalabrutinib, or (3) BR plus acalabrutinib are eagerly awaited (Table 4). The role of ASCT is discussed in another article in this series. For older/unfit patients, whereas the SHINE trial had limited clinical implications, the ECHO trial better supports incorporating BTKis into frontline treatment; however, data on outcomes in high-risk patients have not yet been reported.
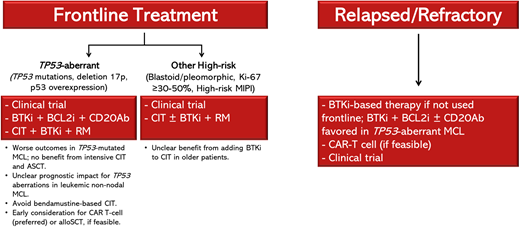
Treatment approach for patients with high-risk MCL. alloSCT, allogeneic stem cell transplant; BCL2i, B-cell lymphoma 2 inhibitor; CD20Ab, CD20 monoclonal antibody.
Treatment approach for patients with high-risk MCL. alloSCT, allogeneic stem cell transplant; BCL2i, B-cell lymphoma 2 inhibitor; CD20Ab, CD20 monoclonal antibody.
Selected planned and ongoing frontline studies in MCL
| Study name (identifier) | Phase | Treatment(s) | Key inclusion criteria |
|---|---|---|---|
| ECOG-ACRIN EA4181 (NCT04115631) | 2 | BR/R-HDAC vs BR + acalabrutinib vs BR/R-HDAC + acalabrutinib | ≤70 y |
| ENRICH (EudraCT: 2015-000832-13) | 2/3 | Ibrutinib + rituximab vs R-CHOP or BR followed by RM | ≥60 y |
| MANGROVE (NCT04002297) | 3 | Zanubrutinib + rituximab vs BR | ≥70 y or ≥60 and transplant ineligible |
| A052101 (NCT05976763) | 3 | Continuous vs intermittent zanubrutinib + rituximab in patients with a CR | ≥70 y or ≥60 and transplant ineligible |
| OAsIs II (NCT04802590) | 2 | Ibrutinib + antiCD20 monoclonal antibody alone vs with venetoclax | ≤80 y |
| TrAVeRse (NCT05951959) | 2 | Acalabrutinib + venetoclax + rituximab | - |
| NCT04855695 | 2 | Acalabrutinib + venetoclax + obinutuzumab | TP53 mutated or ASCT ineligible (cohort B) TP53 wild-type and ASCT eligible (cohort C) |
| CARMAN (EuCT 2022-502405-15-00) | 2 | Ibrutinib + rituximab → ibrutinib + R-CHOP or ibrutinib monotherapy → brexucabtagene → ibrutinib maintenace vs ibrutinib + R-CHOP/R-DHAP → ASCT (≤65 y) or ibrutinib + R-CHOP or BR (>65 y)→ ibrutinib and RM | Age ≤75 y High intermediate or high MIPI-c and/or TP53 mutation or p53 expression >50% |
| NCT05861050 | 1/2 | Glofitamab (with obinutuzumab pretreatment), venetoclax, and lenalidomide | ≥1 high-risk feature: blastoid/pleomorphic, Ki-67 ≥ 50%, TP53 aberration or p53 overexpression, complex karyotype, high MIPI, bulky disease, other high-risk mutations |
| MCL Elderly III (Eudra CT 2020-002935-30) | 2 | Ibrutinib + venetoclax + rituximab vs BR + ibrutinib | ≥60 and transplant ineligible |
| ALTAMIRA (NCT05214183) | 2 | Acalabrutinib + rituximab | ≥60 and transplant ineligible |
| WINDOW-3 (NCT05495464) | 1 | Acalabrutinib + rituximab → brexucabtagene | High-risk including high MIPI-c, blastoid, Ki-67 ≥ 50%, TP53 aberrations or other high-risk mutations, or bulky disease |
Combination targeted and T-cell–based therapies offer the most likely benefit in patients with high-risk disease, and novel- agent combination trials have shown promising results, but none of these agents or combinations are currently approved in the frontline setting. The results of 2 ongoing phase 3 trials will help determine whether a combination of BTKi plus rituximab improves overall outcomes in older patients, including in high-risk patients, compared with CIT. The ENRICH trial randomizes older adult patients to IR vs BR or R-CHOP, whereas the MANGROVE trial randomizes patients to zanubrutinib plus rituximab vs BR. The ongoing A052101 study evaluates continuous vs intermittent treatment with zanubrutinib in older patients with TN-MCL. Several trials further examine the efficacy and safety of triplet combinations. The MCL Elderly III trial randomizes transplant-ineligible patients aged 60 years and older to IVR vs BR plus ibrutinib. The ongoing phase 2 OAsIs II randomizes patients to ibrutinib plus an anti-CD20 monoclonal antibody alone or with venetoclax. TrAVeRse is a phase 2 trial of acalabrutinib, venetoclax, and rituximab induction followed by minimal residual disease–driven randomization to observation vs acalabrutinib maintenance. The BOVen study, particularly promising in a small cohort of TP53- mutated TN-MCL, was expanded to include more patients. Last, AVO (acalabrutinib, venetoclax, obinutuzumab) is being evaluated in a phase 1 trial with a cohort for ASCT-ineligible or TP53-mutated TN-MCL and a cohort for wild-type TP53 and ASCT-eligible TN-MCL.47 Several ongoing trials investigate the role of CAR T cells and bispecific antibodies in high-risk TN-MCL. In the CARMAN trial, patients with TN high-risk MCL are randomized to 2 cycles of IR with or without R-CHOP plus ibrutinib followed by brexucabtagene and ibrutinib maintenance vs CIT in combination with ibrutinib with or without ASCT. In the WINDOW-3 trial, patients with high-risk MCL receive AR followed by brexucabtagene. The CD3xCD20 bispecific antibody glofitamab is being investigated in combination with venetoclax and lenalidomide in patients with high-risk TN-MCL. The results of these ongoing and planned trials with targeted and T-cell–based therapies will hopefully provide effective options for patients with high-risk disease and bring us a step closer to a “Chemo Is No Good” approach in patients with MCL.
Conflict-of-interest disclosure
Yazeed Sawalha: research funding: BeiGene, AbbVie, Genmab; consultancy: ADC Therapeutics, Genentech; honoraria: ADC Therapeutics, Genentech.
Kami Maddocks: consultancy: AbbVie, ADC Therapeutics, AstraZeneca, Beigene, Bristol Myers Squibb, Genmab, Genentech, Gilead, Incyte, Janssen, Lilly, MorphoSys.
Off-label drug use
Yazeed Sawalha: discussion on off-label drug use.
Kami Maddocks: discussion on off-label drug use.
