

Learning Objectives
Review evidence of the impact of body weight on FVIII in vivo recovery
Review evidence of using ideal body weight for FVIII dosing in overweight and obese persons with hemophilia A
CLINICAL CASE
A 35-year-old man with severe hemophilia A and a body mass index (BMI) of 38 (height, 180 cm; weight, 123 kg) presents for his annual comprehensive care visit. He is on prophylaxis using factor replacement therapy with a recombinant standard half-life coagulation factor VIII (FVIII) product that is dosed according to actual body weight (ABW). He reports zero spontaneous joint bleeds over the past 12 months. He has an upcoming elective laparoscopic cholecystectomy for symptomatic cholelithiasis. His hematologist wonders if his perioperative dosing as well as prophylaxis dosing of FVIII should be adjusted considering his increased BW.
Introduction
For persons with hemophilia A, factor replacement therapy with FVIII concentrates is the cornerstone of treatment for managing and preventing bleeding episodes. FVIII concentrate is typically dosed on a per-kilogram basis. The number of FVIII units needed to achieve a desired circulating FVIII level is empirically calculated using the following formula:
This formula is based on a FVIII in vivo recovery (IVR) of 2, which assumes that each unit of FVIII concentrate infused per kilogram of BW increases the circulating FVIII level by 2 IU/dL.1 The IVR of 2 was first described in 1981 by Ingram based on data from 19 persons with hemophilia A with an ABW between 27 and 91 kg.1 He concluded that the dose calculation using a plasma volume of 0.5 dL/kg applies if the person's physical build does not markedly differ from the average. Despite this caveat, the IVR of 2 has been adopted widely for FVIII dose calculations irrespective of body composition. With over 31% of the US hemophilia population classified as obese, the appropriateness of an IVR of 2 as a “one-size-fits-all” approach in this population is questionable.2
Impact of body composition on FVIII IVR
In persons who are overweight or obese, the rise in BW is primarily the result of increased adipose tissue, which contains less vascular space than lean mass. The plasma volume per kilogram of BW decreases as BW increases, resulting in a lower plasma volume per kilogram of BW.3 Since FVIII is primarily restricted to the vascular compartment, the same amount of FVIII concentrate (in units per kilogram) infused in an obese person likely results in a higher circulating plasma FVIII level compared to a nonobese person.4
Several clinical studies have demonstrated that FVIII IVR increases with increasing BMI and BW (Table 1).5-8 The IVR is calculated by
Summary of clinical studies evaluating FVIII IVR stratified by BMI
| Reference | Study design (age, years) | n | Intervention (median IU, range) | BMI groups (kg/m2) (n) | IVR (IU dL−1/IU kg−1) | Strongest predictor of IVR |
|---|---|---|---|---|---|---|
| Henrard et al5 | Prospective observational (mean, 40.4 ± 12.3) | 46 | A dose of rFVIII (2000, 980-4200) | 18.5-24.9 (26) 25.0-29.9 (14) ≥30.0 (6) | 1.88 2.30 2.70 | BW |
| Henrard et al6 | Retrospective pooled analysis of 8 PK trials (median, 26; IQR, 21-38) | 201 | A dose of rFVIII (3745, 1953-8794) | <18.5 (9) 18.5-24.9 (105) 25.0-29.9 (52) >30.0 (35) | 1.72 2.03 2.18 2.68 | BMI |
| Henrard et al7 | Retrospective pool analysis of 6 PK trials (median, 14.5; IQR, 12.8-15.6)a | 66 | A dose of rFVIII (2778, 1675-5420) | Normal (43) Overweight (7) Obese (16)b | 1.93 2.12 2.65 | BMI-for-age |
| Tiede et al8 | Prospective observational (mean, 37.4; range, 23.0–57.0) | 35 | rFVIII 50 IU/kg by ABW | <18.5 (5) 18.5-24.9 (7) 25.0-29.9 (9) 30.0-34.9 (7) ≥35 (7) | 2.2c 2.9c 2.9c 3.2c 3.5c | BMI |
Only trial in children.
Based on the BMI-for-age percentiles (normal, 5th-84th; overweight, 85th-94th; obese, >95th).
End point reported as IVR at 30 minutes using a geometric mean.
IQR, interquartile range.
In addition, a population pharmacokinetic (PK) modeling study found that changes in ideal body weight (IBW) account for the most significant amount of interindividual FVIII PK variability.9 Given these findings, this minireview seeks to compare the evidence for IBW vs ABW for the dosing of FVIII in overweight and obese persons with hemophilia A.
Methods
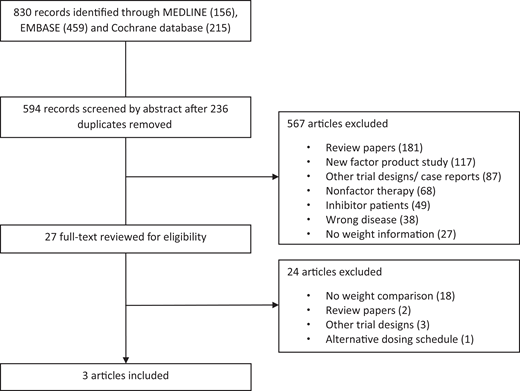
We conducted a systematic search of MEDLINE, Embase, and the Cochrane Database of Systematic Reviews from 1 January 1981 to 10 May 2021. Our search included MeSH and the key words “hemophilia A,” “pharmacokinetic,” and “dose” and yielded 830 abstracts (Figure 1). References of the resulting studies and narrative reviews were screened. There were 594 unique articles after 236 duplicates were removed. Of the unique articles, 181 were review papers, 117 were evaluating new factor concentrates, 87 were case reports and alternative trial designs, 68 involved nonfactor therapy, 49 involved inhibitor patients, 38 were not on hemophilia A, and 27 had no weight information. Full-text reviews by 2 independent reviewers were conducted on the 27 remaining articles, and 3 studies were ultimately included: 1 retrospective observational study and 2 crossover trials.10-12
Results
All three studies used different outcome measures: peak FVIII levels after a 50 IU/kg dose and clinical effectiveness10 ; percentage of actual FVIII recovery levels over expected levels after a 50 IU/kg dose11 ; and FVIII IVR (Table 2).12 Graham et al performed a retrospective study reporting peak FVIII levels for 6 adults with BMIs ≥30 treated with recombinant FVIII 50 IU/kg dosed by IBW.10 These patients had been previously receiving recombinant FVIII at 50 IU/kg dosed by ABW for prophylaxis or were undergoing surgery. With IBW dosing, 5 of the 6 patients achieved expected mean peak FVIII levels of 100%. The patient with the lowest peak level (78%) had the highest weight (151 kg, BMI 45.8) and was retreated with IBW plus 25%, resulting in a peak FVIII level of 107%. During the 3-month prophylaxis and/or surgical period for each patient, there was no increase in spontaneous or traumatic bleeds and no unexpected bleeding or transfusion requirement with surgery.
Findings of 3 studies evaluating outcomes based on IBW
| Reference | Study design (age, years) | n | Intervention | Mean (range) | Achieved peak FVIII level or expected recovery or IVR | |||
|---|---|---|---|---|---|---|---|---|
| ABW (kg) | BMI | IBW | Peak FVIII level or expected recovery or IVR | |||||
| Grahamet al10 | Retrospective (median, 33; range, 25-47) | 6 | rFVIII 50 IU/kg by IBW | 116 (91-151) | 36.0 (30.0-45.8) | 74.4 (67.0–84.5) | Peak FVIII level 100% (78-123) | 83% (5 of 6)a |
| Blair et al11 | Prospective crossover (median, 21.5; range, 12-53) | 16 | FVIII 50 IU/kg (±20%) by both ABW and IBW | NR | Median, 33.1 (25.6-41.8) | NR | ABW, 140% expected recovery (83-196); IBW, 100% expected recovery (56-137) | ABW, 94% (15 of 16)b; IBW, 87.5% (14 of 16)b |
| Seaman et al12 | Prospective crossover (mean, 34.6 ± 11.3) | 19 | A dose of rFVIII based on ABW, IBW, and LBM and an IVR of 2.0 | 93.0 ± 13.6 | 29.2 ± 3.5 (Max, 38.3) | 73.6 ± 6.3 | ABW: IVR, 2.46; IBW: IVR, 2.29; LBM: IVR, 2.22 | ABW, 31.1%c; IBW, 49.0%c; LBM, 44.2%c |
Above expected peak FVIII level of 100% or within 10% below expected peak FVIII level.
Above expected recovery or within 10% below expected recovery.
Within 10% of targeted IVR of 2.00.
LBW, lean body weight.
Blair et al conducted a crossover trial of both ABW and IBW dosing in 16 adults and children (median BMI 33.1; range, 25.6-41.8) and compared actual FVIII recovery levels with expected-recovery levels after a FVIII 50 IU/kg dose.11 Participants used their personal brand of factor, and both standard and extended half-life products were included. With ABW dosing, 15 of 16 patients achieved above-expected recovery ranging from 0.1 to 0.96 above expected (mean, 0.44). In the IBW dosing arm, 8 of 16 patients achieved above-expected recovery (range, 0.01-0.37). Of the 8 patients who did not achieve above-expected recovery, 6 were within 10% from expected-recovery.
The second crossover trial, a 3 × 3 × 3 design of ABW vs IBW vs lean body mass (LBM), was conducted in 19 adults (mean BMI, 29.5) to determine which descriptors of BW achieved the targeted IVR of 2 with better precision.12 The mean IVR postrecombinant factor VIII (rFVIII) infusion for ABW-, LBM-, and IBW-based dosing was 2.46, 2.22, and 2.29, respectively. The proportion of participants with an IVR of 2.00% ± 10% was 31.1%, 44.2%, and 49.0% for ABW-, LBM-, and IBW-based dosing, respectively.
Discussion
Our systematic minireview identified 2 prospective crossover studies that directly compared IBW to ABW dosing of FVIII concentrates and 1 retrospective study that compared IBW dosing to historical ABW dosing in overweight and obese persons with hemophilia A.10-12 A concern with using IBW is the risk of underdosing, resulting in subtherapeutic FVIII levels and increased risk of bleeding. Overall, these 3 studies demonstrated favorable outcomes using different PK measures when dosed by IBW and support the use of IBW to perform individualized PK analysis in overweight and obese persons with hemophilia A.
Despite favorable PK measures, a clinical concern is hemostatic effectiveness when using IBW for dosing FVIII concentrates. Of the studies identified, only the retrospective study by Graham et al provided 3 months of data on hemostastic effectiveness for the IBW dosing strategy.10 Even though the hemostatic effectiveness of IBW dosing was favorable in both the perioperative and prophylaxis setting, this study was limited by the small sample size of 6 adults. Particularly in the perioperative setting, the application of IBW dosing seems appealing to avoid overtreatment with the unnecessary high FVIII peaks associated with ABW dosing, which could lead to complications such as thrombosis and inhibitor development, especially in persons with nonsevere hemophilia A who have lifelong inhibitor risk.13 A case-control study found that intensive FVIII treatment was a risk factor for inhibitor development in persons with nonsevere hemophilia A even after more than 50 exposure days.14 Larger cohort studies with long-term follow-up are critical to fully evaluate the effectiveness of dosing FVIII by IBW in both the perioperative and prophylaxis setting. Additionally, given the cost of FVIII concentrates, dosing based on IBW is a cost-savings approach if hemostatic effectiveness is comparable to ABW dosing. Graham et al calculated that IBW dosing resulted in a 48.9% reduction in FVIII usage during the 3-month period, with an annualized mean savings of $133,000 per patient.10 However, without robust effectiveness data, it is difficult to judge the cost-effectiveness of IBW dosing at this time.
While body composition has a demonstrated impact on FVIII PKs, it should be remembered that other factors may play a role and should also be considered.15 Age has been identified as an independent modifier of FVIII clearance, with increased clearance seen in early childhood.16 von Willebrand factor levels and the ABO blood group are noted to alter FVIII clearance but were not found to be significant determinates of IVR in the studies reviewed.5,6,8 Individual PKs also vary between factor concentrate products (recombinant, plasma-derived, and extended half-life), and the studies included in this review only evaluated recombinant products. Overall, even though numerous individual factors can account for interindividual PK profiles, body compositions appear to be the strongest determinate.5,6,8
In summary, although conclusive recommendations cannot be made based on the small number of studies and the lack of standardization of outcomes, we suggest the following:
For overweight and obese persons with hemophilia A, we suggest that an individualized PK analysis be performed using IBW to determine adequate FVIII in vivo recovery (Grade 2B).
If there is adequate FVIII in vivo recovery, we suggest using an IBW dosing strategy in the perioperative setting (Grade 2C).
If there is adequate FVIII in vivo recovery, we suggest using an IBW dosing strategy in the prophylaxis setting (Grade 2C).
We emphasize the need for larger and long-term clinical studies to determine the hemostatic effectiveness of using an IBW dosing strategy in the perioperative and prophylaxis setting.
Acknowledgment
Ming Y. Lim received a 2018 Mentored Research Award from the Hemostasis and Thrombosis Research Society, which was supported by an educational grant from Bioverativ, a Sanofi company.
Conflict-of-interest disclosure
Ming Y. Lim: advisory board: Sanofi Genzyme, Argenx, Dova Pharmaceuticals, Hema Biologics; honoraria: Hemostasis and Thrombosis Research Society Trainee Workshop supported by Novo Nordisk.
Nicoletta Machin: research funding: Takeda Pharmaceuticals.
Off-label drug use
Ming Y. Lim: nothing to disclose.
Nicoletta Machin: nothing to disclose.
