
Abstract
Myelodysplastic syndromes (MDS) are clonal disorders characterized by the accumulation of complex genomic abnormalities that define disease phenotype, prognosis, and the risk of transformation to acute myeloid leukemia. The clinical manifestations and overall outcomes of MDS are very heterogeneous with an overall survival that can be measured in years for some patients to a few months for others. Prognostic scoring systems are important staging tools that aid physicians in their treatment recommendations and decision-making and can help patients understand their disease trajectory and expectations. Several scoring systems have been developed in MDS with the International Prognostic Scoring System and its revised version, the most widely used systems in clinical practice and trial eligibility. These models and others use mainly clinical variables that are obtained from bone marrow biopsy and peripheral blood measurements. Adding molecular data to current models may improve its predictive power but the ultimate method to incorporate this information remains a work in progress. Novel methods to develop a personalized prediction model that provides outcomes that are specific for a patient are currently under way and may change how we think about risk stratification in MDS patients in the future.
Learning Objectives
Discuss established prognostic models in MDS and their strengths and weaknesses when applied in clinical practice
Discuss the prognostic impact of somatic mutations in MDS, the addition of these mutations to current models, and newer approaches to incorporate the clinical and mutational data into novel prognostic tools
Introduction
Myelodysplastic syndromes (MDS) are a group of clonal disorders characterized by dysplastic features in the bone marrow, variable degrees of cytopenias, and a potential progression into more aggressive stages including acute myeloid leukemia (AML).1 The clinical manifestations and the severity of the disease varies among patients, with some having mild asymptomatic cytopenias and prolonged life expectancies without treatment and others with aggressive disease, profound cytopenias, and AML transformation despite treatment. Recognizing this heterogeneity in the disease presentation and overall outcomes is clinically important for the patient and the treating physician as disease expectations and treatment recommendations are dependent on accurately defining the disease risk.2-5 For patients with a lower-risk disease, therapies are mainly supportive with a main goal of improving quality of life and decreasing transfusion burden whereas therapies for a higher-risk disease are focused on potentially curing the disease or prolonging overall survival (OS).2-5 Accurately predicting these risk categories can be life-changing for some patients.
In the past 2 decades, several prognostic scoring systems were established to risk-stratify MDS patients.6-10 These models mainly use prognostic factors that include clinical variables such as cytopenias, bone marrow blast percentage, cytogenetic analysis, and patient-related factors such as age and performance status. With the identification of several recurrent somatic mutations that impact MDS biology and prognosis, attempts to incorporate these mutations in current prognostic models or to develop a novel geno-clinical model were made but no widely accepted integrated scoring system is currently established.11-13
In this article, we will discuss the challenges of applying current prognostic models in clinical practice, current studies that integrated genomic data into current models, and newer methods to develop personalized prediction models in MDS.
Clinical prognostic models in MDS
Prognostic factors in MDS can be divided into patient-related or disease-related factors (Figure 1). Patient-related factors can include age at diagnosis, performance status, and comorbidities such as cardiac, pulmonary, liver, etc. Disease-related factors can be divided into pathological, laboratory, and biological features (Figure 1). These factors overlap and interact with each other in complex and often additive ways. For example, a patient with a morphological diagnosis of MDS with excess blasts (MDS EB) can have a lower-risk disease when it is associated with normal karyotype and mild cytopenias but would have a higher-risk disease with complex karyotype (CK) or other poor-risk cytogenetics and profound cytopenias. It is important to recognize that no current prognostic model includes all of these variables and the majority of widely used models in clinical practice or clinical trial eligibility use mainly clinical variables.
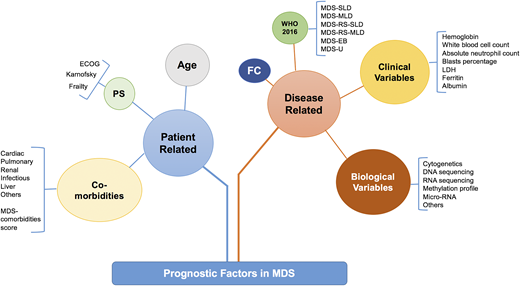
Prognostic factors in MDS. How the prognostic factors can be divided into disease-related and patient-related factors. EB, excess blast; FC, flow cytometry; MDS-MLD, MDS with multilineage dysplasia; MDS-SLD, MDS with single lineage dysplasia; PS, performance status; RS, ring sideroblast; U, unclassifiable. Adapted from Nazha et al34 with permission.
Prognostic factors in MDS. How the prognostic factors can be divided into disease-related and patient-related factors. EB, excess blast; FC, flow cytometry; MDS-MLD, MDS with multilineage dysplasia; MDS-SLD, MDS with single lineage dysplasia; PS, performance status; RS, ring sideroblast; U, unclassifiable. Adapted from Nazha et al34 with permission.
Several prognostic scoring systems were developed over the years to risk-stratify MDS patients, including the International Prognostic Scoring System (IPSS), the revised IPSS (IPSS-R), the World Health Organization (WHO) Prognostic Scoring System (WPSS), and the Global MD Anderson Prognostic Scoring System (MDAPSS) (Figures 2 and 3).6-10 All use mainly 3 measures with different cutoffs/categories: (1) cytogenetic analysis, (2) bone marrow blast percentage (with the exception of WPSS, which uses 2008 WHO classification instead), and (3) cytopenias (WPSS uses transfusion dependency which is an indirect measurement of the degree of anemia, and was subsequently revised [WPSSR] to include hemoglobin level instead of transfusion dependency).14 Although age is a very important prognostic factor, only MDAPSS and IPSS-R–age include it as an independent prognostic factor. The IPSS and IPSS-R remained the most commonly used prognostic models in clinical practice and trial eligibility but several shortcomings have been recognized when applying these models in practice.
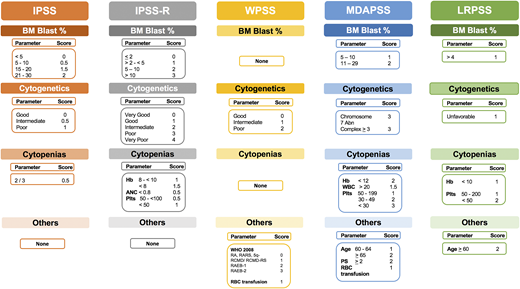
Established prognostic models in MDS. The clinical characteristics and their cutoffs for each prognostic model in MDS. The cytogenetic groups for IPSS are: good: normal, −Y, 5q−, 20q−; poor: complex (≥3 abnormalities) or chromosome 7 abnormalities; and intermediate: other karyotypic abnormalities. The cytogenetic groups for IPSS-R are: very good: −Y, del(11q); good: normal, del(5q), del(12p), del(20q), double including del(5q); intermediate: del(7q), +8, +19, i(17q), any other single or double independent clones; poor: −7, inv(3)/t(3q)/del(3q), double including −7/del(7q), complex: 3 abnormalities; very poor: complex: >3 abnormalities. The cytogenetic group for LRPSS is diploid and 5q were favorable cytogenetics, all others were considered as unfavorable cytogenetics. The red blood cell (RBC) transfusion dependence is ≥1 RBC transfusion every 8 weeks over a period of 4 months. The WPSS was revised to include the degree of anemia (hemoglobin <9 g/dL in men and <8 g/dL in women). *The LRPSS is a model that only can be applied to MDS patients who belong to the IPSS low and intermediate-1 risk groups. 5q−, interstitial deletion of long arm of chromosome 5; ANC, absolute neutrophil count; BM, bone marrow; Hb, hemoglobin; LRPSS, lower-risk prognostic scoring system; plts, platelets; RA, refractory anemia; RAEB, refractory anemia with excess blasts; RARS, refractory anemia with ring sideroblasts; RCMD, refractory cytopenia with multilineage dysplasia; WBC, white blood cell count.
Established prognostic models in MDS. The clinical characteristics and their cutoffs for each prognostic model in MDS. The cytogenetic groups for IPSS are: good: normal, −Y, 5q−, 20q−; poor: complex (≥3 abnormalities) or chromosome 7 abnormalities; and intermediate: other karyotypic abnormalities. The cytogenetic groups for IPSS-R are: very good: −Y, del(11q); good: normal, del(5q), del(12p), del(20q), double including del(5q); intermediate: del(7q), +8, +19, i(17q), any other single or double independent clones; poor: −7, inv(3)/t(3q)/del(3q), double including −7/del(7q), complex: 3 abnormalities; very poor: complex: >3 abnormalities. The cytogenetic group for LRPSS is diploid and 5q were favorable cytogenetics, all others were considered as unfavorable cytogenetics. The red blood cell (RBC) transfusion dependence is ≥1 RBC transfusion every 8 weeks over a period of 4 months. The WPSS was revised to include the degree of anemia (hemoglobin <9 g/dL in men and <8 g/dL in women). *The LRPSS is a model that only can be applied to MDS patients who belong to the IPSS low and intermediate-1 risk groups. 5q−, interstitial deletion of long arm of chromosome 5; ANC, absolute neutrophil count; BM, bone marrow; Hb, hemoglobin; LRPSS, lower-risk prognostic scoring system; plts, platelets; RA, refractory anemia; RAEB, refractory anemia with excess blasts; RARS, refractory anemia with ring sideroblasts; RCMD, refractory cytopenia with multilineage dysplasia; WBC, white blood cell count.
The application of these models in treated MDS patients and patients with secondary MDS
The IPSS and IPSS-R were developed in de novo MDS patients who did not receive any disease-modifying agents.6,15 Although IPSS-R was validated in treated patients who received hypomethylating agents, lenalidomide, and prior to hematopoietic cell transplantation (HCT), neither one was predictive of outcomes in patients with secondary or therapy-related MDS.16-18
Models are not dynamic especially at the time of hypomethylating agent failure
As prognosis is not a one-time evaluation but rather a dynamic process that can change depending on the disease behavior and treatment, an ideal scoring system should be dynamic and can be applied at different time points during the disease course. All models were developed at diagnosis, but some were subsequently validated during the disease course in patients who did not receive any disease-modifying treatment during the MDS phase.7 This analysis does not take into account patients who receive treatments such as hypomethylating agents (HMAs) and the predictability of these models after HMA failure. Nevertheless, most current clinical trials that are conducted at the time of HMA failure use IPSS and/or IPSS-R as risk-stratification tools for trial eligibility despite the fact that these scoring systems have limited predictability in this setting and their prediction of outcome can be misleading. For example, if a patient who failed to respond to HMAs after 6 cycles of treatment is classified as low risk by IPSS, the predicted OS for this patient is 5.7 years; however, studies have shown that the median OS for patients who fail HMA is 4 to 6 months.19-21 To address this problem, a new model was developed to predict OS after HMA failure.22 The model includes 6 clinical variables: age, performance status, complex cytogenetics (≥4 abnormalities), marrow blast percentage >20%, platelet count, and red cell transfusion dependency (Figure 4). The model separates patients into 2 risk categories: lower-risk disease (with a median OS of 11.0 months [95% confidence interval, 8.8-13.6]) and higher-risk disease (with median OS of 4.5 months [95% confidence interval, 3.9-5.3]).22 This model was subsequently validated in an independent cohort of 223 MDS patients obtained from the Groupe Francophone des Myélodysplasies (GFM) database and in a prospective trial comparing treatment with rigosertib vs best supportive care.23,24
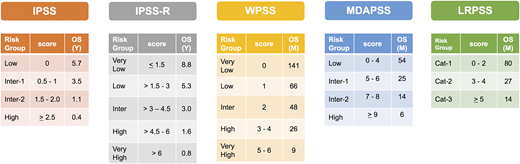
Risk stratification, scores, and median OS by each model. Cat, category; Inter, intermediate; M, month; Y, year.
Risk stratification, scores, and median OS by each model. Cat, category; Inter, intermediate; M, month; Y, year.
The intermediate-risk problem
Prior to the development of IPSS-R, IPSS was the default scoring system that is widely used in practice and clinical trial eligibility. Most treatment recommendations used today are based on classifying patients by IPSS into a lower-risk disease (low and intermediate-1) vs higher-risk disease (intermediate-1 and high). After the wide adaptation of IPSS-R as the new standard-risk scoring system, a problem that arose was where to risk-stratify patients with intermediate risk. Some recent clinical trials include these patients in the lower-risk category whereas others include them in a higher-risk category. More importantly, the outcome of this patient subgroup is very heterogeneous. To overcome this problem, a recent study suggested that a cutoff ≥3.5 establishes a higher-risk disease and can be used to segregate patients into a lower- or higher-risk disease.25 Another approach could be adding other high-risk features such as ferritin, lactate dehydrogenase, or higher-risk mutations such as EZH2 or TP53, which can upstage the patient to a higher-risk category.13
Overestimating or underestimating the risk
It is apparent that current models can overestimate or underestimate the OS for some MDS patients. Approximately 25% to 30% of patients with lower-risk disease by IPSS can be upstaged to a higher-risk category with predicted OS that is similar to patients with higher-risk disease by IPSS using the MD Anderson Lower-Risk Prognostic Scoring System (LRPSS; Figures 2 and 3).10 The model uses variables such as age, bone marrow blast percentage, and cytogenetics as well as accounting for the severity of anemia and thrombocytopenia.10 Furthermore, in a recent analysis of 687 patients treated at Cleveland Clinic, significant differences between the predicted OS and the actual OS for a patient were observed using all models.26 For example, the IPSS-R scoring system overestimated the OS for patients with lower-risk disease and underestimated the OS for patients with higher-risk disease.26 Recognizing this limitation of current models is very important as the choice of therapy and disease expectations are highly dependent on prognosis, and identifying the actual risk in these patients could alter their treatment recommendations.
Prognostic impact of somatic mutations in MDS patients
Large-scale genome-sequencing studies have defined the molecular landscape of MDS and identified several recurrent somatic mutations in almost every MDS patient.11,27 These mutations affect several important biological pathways and can impact disease phenotype, prognosis, and progression to AML.11,27,28 The growing interest of using this information in clinical practice and the availability of several commercial laboratories that offer these technologies in a fast and low-cost way have added several layers of complexity when using this information in the clinic. The challenges in applying this information clinically are related to several factors that include the following: (a) current studies that evaluated the impact of these mutations on outcomes are limited to a small number of patients with a small set of genes; (b) although the price of performing the test is dropping dramatically, it remains high in other countries and insurers may not cover its cost; (c) no consensus on the optimal method to sequence and analyze the data (different laboratories may provide different sequencing results for the same sample); and (d) the clinical impact of some of these mutations on patient outcome remains controversial.
Impact of a single mutation on OS
Several studies have shown that a handful of mutations have an independent impact on OS.11-13,27,28 Although some of these mutations, such as TP53, EZH2, RUNX1, and SF3B1, have frequently been shown to independently predict OS in several studies, the impact of other mutations, such as ASXL1, TET2, DNMT3A, SRSF2, U2AF1, and others, has been controversial (Table 1).11-13,27,28 This difference is related to several factors, including: the study sample size, the set of genes included in the analysis, the sequencing method/bioinformatic tools that have been used, and, more importantly, the clinical characteristics of the patient cohort. Furthermore, the most commonly mutated genes in MDS, such as TET2, DNMT3a, and ASXL1, are also commonly seen in older individuals with normal counts (clonal hematopoiesis of unknown significance) or with pancytopenia without evidence of dysplasia (clonal cytopenia of undetermined significance). In a study of 944 MDS patients, genome sequencing of 104 genes showed that 25 of 48 mutations were associated with negative impact on OS, including PTPN11, NPM1, TP53, PRPF8, EZH2, LUC7L2, NRAS, KRAS, FLT3, RUNX1, NF1, LAMB4, GATA2, ASXL1, SMC1A, and STAG2, whereas only SF3B1 had a positive impact on OS.11 However, after adjusting for known clinical risk factors, only 5 mutations, ASXL1, KRAS, PRPF8, SF3B1, and RUNX1, remained significant.11 In a larger study of 3562 MDS samples collected from an international database, mutations in TP53, RUNX1, EZH2, NRAS, SF3B1, CBL, ASXL1, TET2, IDH2, KRAS, and NPM1 impacted OS in univariate analysis.28 The impact of mutations on OS changes based on the clinical context.28 For example, mutations in ASXL1, U2AF1, and SRSF2 have a negative impact on OS in patients with blast percentages <5% but lost their independent significance in patients with higher blast percentages (Table 1). In multivariate analysis that included the 12 significant mutations and the IPSS-R scoring system, only 5 mutations, TP53, RUNX1, EZH2, NRAS, and SF3B1, remained independently significant.28 This analysis did not adjust for age or other prognostic factors not included in the IPSS-R scoring system, which could change the prognostic impact of some of these mutations. It is evident that the number of mutations has not had an impact on OS and leukemia-free survival but no conclusive results on the appropriate method to account for the prognostic weight of comutations.
Commonly mutated genes in MDS
| Mutated gene | Frequency, % | Blasts <5% | Blasts 5%-30% | Notes | Reference |
|---|---|---|---|---|---|
| TET2 | 20-30 | Neutral | Neutral | Commonly associated with normal karyotype | 12, 13, 27, 28, 30 |
| SF3B1 | 20-25 | Favorable | Neutral | Associated with ring sideroblasts | 12, 13, 27, 28 |
| ASXL1 | 15-20 | Adverse | Neutral | Adverse in CMML | 12, 13, 27 |
| SRSF2 | 10-20 | Adverse | Neutral | Commonly comutated with TET2 in CMML | 12, 13, 27 |
| DNMT3A | 10-15 | Neutral | Neutral | Associated with MDS-MLD and MDS-EB | 12, 13, 27, 28, 30 |
| RUNX1 | ∼10 | Adverse | Adverse | Associated with MDS-MLD and MDS-EB | 12, 13, 27, 28 |
| U2AF1 | <10 | Adverse | Neutral | Associated with MDS-MLD and MDS-EB | 12, 13, 27 |
| EZH2 | 5 | Adverse | Adverse | Higher frequency in CMML | 12, 13, 27, 28 |
| TP53 | 5-10 | Adverse | Adverse | Commonly associated with therapy-related MDS and CK | 12, 13, 27,,,,-32 |
| IDH1/IDH2 | <10 | Neutral | Neutral | Associated with MDS-MLD and MDS-EB | 12, 13, 27, 28 |
Adapted from Nazha et al34 with permission.
CMML, chronic myelomonocytic leukemia; MDS-EB, myelodysplastic syndromes with excess blasts; MDS-MLD, myelodysplastic syndromes with multilineage dysplasia.
Do mutation characteristics impact outcomes?
Most studies evaluated the impact of mutations on OS in a binary method (ie, the mutation is present or absent) and did not take into account the mutation characteristics such as variant allele frequency (VAF), mutation location (in important functional domain of the gene vs others), the type of mutation (missense vs others), and the presence of comutated genes. Taking this information into account can have a significant impact on the study outcomes. For example, a missense mutation at the beginning of the gene may have no impact on the protein function and thus have a minimal biological effect whereas a missense mutation in an important functional domain of the gene can have more harmful biological consequences. Further, the outcome of patients who carry TP53 mutations can be very poor in general but patients with a VAF < 25% have a better OS compared with patients with a VAF > 50% (median OS of 12.4 months vs 3.4 months, respectively).29 This suggests that incorporating mutation characteristics may improve the prognostic impact of some of these mutations.
Somatic mutations and outcomes after therapy
The significant impact of some mutations may change based on the therapy that the patient received. Several studies have investigated the impact of somatic mutations on transplant outcomes with some conflicting results.30-33 In a large cohort of 1514 MDS patients who were reported in the Center for International Blood and Marrow Transplant Research Repository between 2005 and 2014, TP53 mutations independently predicted shorter OS and a higher risk of relapse even after adjustment for known clinical risk factors.33 Mutation characteristics also impacted survival.33 For example, patients with truncating TP53 mutations had shorter OS compared with patients with missense mutations but VAF with 10% cutoff did not impact the outcome.33 In older patients (≥40 years) with wild-type TP53 mutations, the presence of mutations in the RAS pathway (NRAS, KRAS, PTPN11, CBL, NF1, RIT1, FLT3, and KIT) was associated with shorter OS due to higher risk of relapse whereas the presence of JAK2 mutations was associated with shorter OS due to higher risk of death without relapse.33 In another study from the Japanese bone marrow registry, mutations in TP53, NRAS, CBL, and CK were independently associated with shorter OS after adjusting for clinical variables.32 More importantly, the negative impact of TP53 mutations was mainly seen in patients who had a CK.32 Patients with TP53 mutations without CK had a significantly better survival posttransplant (73% of patients were alive at 60 months).32 The negative impact of TP53 on outcomes after HCT was also shown in a cohort of 401 MDS patients from the Gruppo Italiano Trapianto di Midollo Osseo registry.31 The differences in the results of these studies and others are mainly related to different patient cohorts, different analysis methods, and which clinical and mutational variables were included in the multivariate analysis. Most importantly, these studies did not compare the impact of mutations on the outcome in patients who did not receive transplant and were treated with other available therapies alone such as HMAs. Such analysis is important as it is evident that a subset of patients with TP53 mutations can have prolonged OS with HCT that cannot be achieved by other therapies whereas others experience early relapse with no benefit from the transplant.
Mutation only or geno-clinical models
Because somatic mutations have independent impact on OS, attempts to include or build new prognostic models that incorporate them remained of great research interest. An important question remains regarding the optimal way to incorporate mutational data and whether it should be added to current established models, or a new gene only or geno-clinical model should be developed. Giving the significant interactions between clinical and mutational data, a gene only model may underperform a model that includes clinical and genomic data. For example, Haferlach et al built a model that included 14 mutations and age, sex, and other clinical variables that are similar to the variables that are included in the IPSS-R scoring system.11 Most importantly, when the analysis was restricted to mutations alone, the gene-only model performed similar to the IPSS-R but the geno-clinical model outperformed both.11
Given the additive prognostic impact of somatic mutations on the clinical variable, attempts to add these mutations to current models were made. In a study of 508 MDS patients treated at the Cleveland Clinic, mutations in ASXL1, RUNX1, TP53, EZH2, SRSF2, and NPM1 were significantly associated with a negative impact on OS, whereas mutations in SF3B1 were associated with a positive impact.12 In multivariate analyses, only age, IPSS-R score, and 3 mutations, EZH2, SF3B1, and TP53, were significant (P < .05).12 Based on the β-coefficients of these prognostic factors, a linear risk score was developed: age × 0.04 + IPSS-R score × 0.3 + EZH2 × 0.7 + SF3B1 × 0.5 + TP53 × 1.12 The new model was more accurate than IPSS-R alone (higher concordance-index [a statistical measure of the goodness of fit of a model]) and, more importantly, the addition of molecular data to IPSS-R made the system dynamic when it applied to paired samples obtained at different time points during the disease course.12
To further investigate whether the addition of molecular data to all established prognostic models can improve its predictive power without altering the original model scoring system, a cohort of 610 MDS patients who were treated at Cleveland Clinic and had clinical and mutational data were analyzed.13 In univariate analyses, mutations in EZH2, TP53, RUNX1, NPM1, and SF3B1 had a significant impact on OS.13 However, after adjusting for model score and age, only 3 mutations, EZH2, SF3B1, TP53, remained prognostically significant.13 Adding these 3 mutations along with age to all models (except MDAPSS because it has age in it) improved its predictability (all molecular models achieved higher concordance-index compared with the original models). More importantly, adding molecular data upstaged and/or downstaged patients into more appropriate risk categories.13 For example, with the addition of molecular data, the IPSS-R upstaged 26% of patients with a lower-risk disease to a higher-risk category including 62% of patients with intermediate risk.13
Toward personalized prediction models
Given the significant overestimation or underestimation of risk when applying current models in clinical practice and the significant impact of these changes on patient expectations, treatment recommendations, and overall outcomes, efforts to develop a geno-clinical model that can provide a personalized prediction that is specific for a patient were attempted. To build this model, a newer statistical approach that uses machine learning algorithms and differs from traditional methods of model building such as Cox regression analysis was needed.34 In this approach, the clinical and molecular variables are randomly selected for inclusion in determining survival, thereby avoiding the shortcomings of traditional Cox stepwise regression in accounting for variable interactions. In a cohort of 975 treated MDS patients (527 from Cleveland Clinic formed the training cohort; 488 from multiple academic institutions in the United States formed the validation cohort), variable importance analysis (the most important variables that contributed to the outcome) identified several clinical and mutational data that impacted OS and AML transformation.34 More importantly, the model that was developed using this approach outperformed all established models even when molecular data were added.34 The model is currently under validation in a larger international patient cohort and a web application interface is being developed to ease the translation of this model into the clinic. This model highlights an important step of moving toward personalized prediction in MDS patients and potentially all other cancer patients.
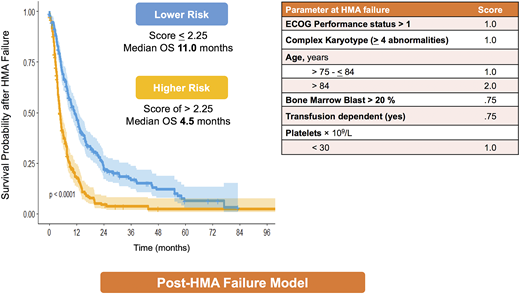
Post-HMA failure model. The clinical characteristics of post-HMA failure model and the survival curves for each risk category.
Post-HMA failure model. The clinical characteristics of post-HMA failure model and the survival curves for each risk category.
Conclusions
Prognostic scoring systems are among the most important tools that can aid clinicians in caring for MDS patients. Our current models are very useful tools for predicting the outcome of MDS patients but several shortcomings have been recognized when they are applied in clinical settings and trial eligibility. Adding molecular data into current models may improve its predictive power and can improve the risk stratifications of some patients; however, these models do not provide a personalized risk score that is tailored to specifically predict the outcome of an individual patient. The optimal way to merge the clinical and genomic data in a sophisticated and highly accurate model remains a work in progress and an effort from the International Working Group Molecular Committee may aid the development of a comprehensive geno-clinical model that can translate the use of genomic data into clinical practice.
Correspondence
Aziz Nazha, Department of Hematology and Medical Oncology, Taussig Cancer Institute, Cleveland Clinic, Desk CA6, 9500 Euclid Ave, Cleveland, OH 44195; e-mail: nazhaa@ccf.org.
