
Abstract
Resistance, manifested as failure to enter remission despite living long enough to do so or as relapse from remission, is the principal cause of therapeutic failure in acute myeloid leukemia, even in patients age ≥ 75. Recently, a “monosomal karyotype” in acute myeloid leukemia blasts has been found to be a principal predictor of resistance. It is also clear that patients with a normal karyotype, and other intermediate prognosis karyotypes, can be placed into a high-risk group based on the absence of a mutation in the NPM1 gene or the presence of an internal tandem duplication (ITD) of the Fms-like tyrosine kinase 3 gene (FLT3) gene, particularly if there is loss of the wild-type FLT3 allele. The effects of other genetic abnormalities have been inconsistent, perhaps reflecting differences in expression of the abnormality and its translation into protein. Several reports have shown the prognostic potential of profiling global gene expression, micro-RNA expression, DNA methylation, and proteomics. Although routine application of these approaches is still premature, pretreatment assessment of the nucleophosmin 1 (NPM1) mutation and FLT3 ITD status, as well as cytogenetics, should be routine. These results can be used to guide the choice of remission induction therapy, for example, by placing patients with monosomal karyotype or FLT3 ITDs on clinical trials. Allogeneic hematopoietic cell transplant in first complete remission is generally indicated for high-risk patients. However, new approaches are needed to reduce the high rates of relapse, even after hematopoietic cell transplant.
Even in older patients, resistance to therapy, rather than treatment-related death, causes most treatment failure in acute myeloid leukemia (AML). For example, Appelbaum et al1 reported that, following administration of anthracycline + cytarabine in standard 3+7 fashion, resistance—defined as failure to enter complete remission (CR) despite not incurring TRD—was responsible for 71% of induction failures in patients younger than age 56, 61% in patients age 66–75, and 54% in patients age ≥ 75. Resistance also encompasses relapse from CR, and when the 5- to 6-fold higher rates of relapse than of death in remission are accounted for, the importance of resistance is even more apparent. Accordingly, this review will focus on factors currently associated with a high risk of resistance and on approaches to overcome them.
Monosomal Karyotype
Cooperative groups in the United States, the United Kingdom, and Germany have each identified monosomies of chromosomes 5 or 7, deletions of the long arm of chromosome 5, abnormalities of the long arm of chromosome 3, and “complex abnormalities” involving at least three distinct aberrations as comprising a high-risk group in both younger and older patients. Multivariate analyses have shown the prognostic dominance of cytogenetics, particularly with complex abnormalities, even in patients aged ≥ 60.2 Although complex abnormalities are often associated with secondary AML (developing typically after a myelodysplastic syndrome or prior chemotherapy), multivariate analyses have similarly shown that cytogenetics dominates secondary AML in predicting resistance.3
Recent findings strongly suggest that “monosomal karyoype” (MK) should be the primary criterion for high cytogenetic risk AML (Figure 1). Thus, in patients younger than age 60, Breems et al4 found that the deleterious effects of complex karyotypes, largely reflected associations with MK, defined as at least two autosomal monosomies or one autosomal monosomy in conjunction with a structural abnormality. Noncomplex MK did as poorly as complex MK. The Southwest Oncology Group (SWOG) subsequently found that the overwhelming negative effect of MK was also present in older patients (Table 1).5

Overall survival of the following four prognostic subcategories of AML aggregated according to cytogenetics: core binding factor (CBF) abnormalities; normal karyotype (CN); non-CBF abnormalities, but MK– (MK–); and non-CBF abnormalities, but MK+ (MK+).
Overall survival of the following four prognostic subcategories of AML aggregated according to cytogenetics: core binding factor (CBF) abnormalities; normal karyotype (CN); non-CBF abnormalities, but MK– (MK–); and non-CBF abnormalities, but MK+ (MK+).
Principal cytogenetic and genetic characteristics associated with high risk of resistance to standard AML therapy*
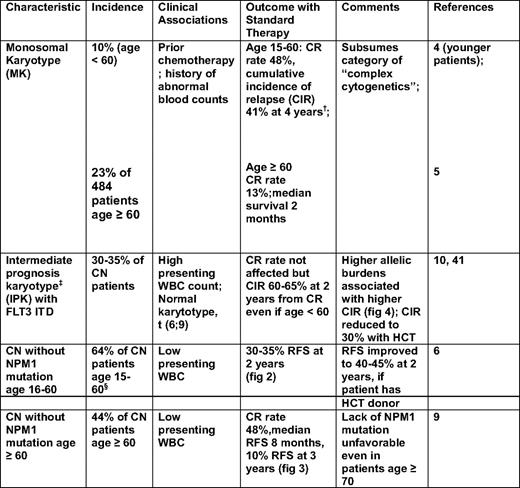
WBC indicates white blood cell.
*Standard therapy denotes 3+7 induction followed by cytarabine—at doses up to 3 g/m2 for consolidation.
†In contrast to patients with an MK, patients with abnormal karyotype without an MK had a CR rate of 78%.
‡IPK denotes a normal karyotype, or an abnormal karyotype that is not an MK and does not include inv(16) or t(8;21).
§Excluding 15% of patients with CEBPA mutations.
FLT3 Internal Tandem Duplications and Mutations in NPM1 and CEBPA
Whereas MK's molecular effect remains speculative, its presence provides unequivocal prognostic information. In contrast, such information was largely lacking in patients with cytogenetically normal (CN) AML or other “intermediate prognosis” karyotypes (IPK) (defined in Table 1, footnote ‡). It is now clear, however, that CN patients younger than age 60, with de novo AML, can be divided into those with “high” and “low” risks of relapse-free survival (RFS) and survival according to the presence/absence in AML blasts of internal tandem duplications (ITDs) in the Fms-like tyrosine kinase 3 gene (FLT3 ITD), mutations in exon 12 of the nucleophosmin 1 (NPM1) gene, and mutations—particularly double mutations—in the CCAAT enhancer-binding protein-α (CEBPA) gene.6 In particular, those of such patients with (a) an NPM1 mutation, but no FLT3 ITD; or (b) a CEBPA mutation are in a “low-risk” group, whereas other patients are in a “high-risk” group (Figure 2).

Relapse-free and overall survival according to genotype; other genotypes refer to patients with a FLT3 ITD or without FLT3 ITD, NPM1 mutation, or CEBPA mutation.
Relapse-free and overall survival according to genotype; other genotypes refer to patients with a FLT3 ITD or without FLT3 ITD, NPM1 mutation, or CEBPA mutation.
Although such results have led to incorporation of molecular markers into AML classifications systems, such as those of the World Health Organization7 and the European LeukemiaNet,8 several questions arise: Are these results applicable to older CN patients or to other IPK patients? What is the prognostic significance of any molecular heterogeneity in NPM, FLT3, or CEBPA? Do other genetic abnormalities add prognostic information? In patients age ≥ 60, the Cancer and Leukemia Group B (CALGB) found that lack of an NPM1 mutation, but not age, was a significant predictor of lower CR rate and shorter RFS, and survival, with the unfavorable effect of lack of an NPM1 mutation even apparent in patients age ≥ 70 (Figure 3).9 Whether older patients with both an NPM1 mutation and a FLT3 ITD would join NPM1 wild-type patients in a high-risk group is not entirely clear.

(A) Disease-free (ie, relapse-free) and (B) overall survival of patients age ≥ 60 years with CN de novo AML according to NPM1 mutation status. (C) The same as (A), but including only patients age ≥ 70. (D) The same as (B), but including only patients age ≥ 70.
(A) Disease-free (ie, relapse-free) and (B) overall survival of patients age ≥ 60 years with CN de novo AML according to NPM1 mutation status. (C) The same as (A), but including only patients age ≥ 70. (D) The same as (B), but including only patients age ≥ 70.
The question of molecular heterogeneity has been most studied with FLT3 ITDs. These differ in their number, length, and insertion site. However, prognosis is most affected by differences in relative levels of abnormal and normal FLT3 protein. Higher levels of abnormal protein correspond to higher “allelic burden,” with levels > 50% indicating a loss of the wild-type FLT3 allele or a homozygous mutation. Gale et al10 found that the difference in cumulative incidence of relapse between patients with allelic burdens > 50% and patients with allelic burdens of 1% to 49% was similar to the difference between patients in the 1% to 49% group and patients without an ITD (Figure 4).

Cumulative incidence of relapse and survival stratified according to total FLT3 ITD level.
Cumulative incidence of relapse and survival stratified according to total FLT3 ITD level.
Other Genetic Abnormalities
In contrast to the clearly deleterious influence of FLT3 ITDs, the prognostic effect of tyrosine kinase domain mutations in the FLT3 gene is much more uncertain. Although patients with inv(16) or t(8;21) are typically considered to be sensitive to high-dose cytarabine, the 20% to 30% of patients in each group who have KIT mutations have an increased cumulative incidence of relapse; the presence of a KIT mutation increases this rate from 30% to -35% and from 60% to 70%.11 Mutations in the genes encoding isocitric dehydrogenases 1 and 2 (IDH1 and IDH2) and in the Wilms tumor 1 gene illustrate how identification of newer abnormalities may augment FLT3, NPM1, and CEBPA in identifying high-risk patients. Marcucci et al12 reported mutations in IDH2 genes in 19% of CN patients. Particularly interesting was the R172 IDH2 mutation, which occurred in patients without other genetic abnormalities and was associated with lower CR rates (20% vs 56%) than seen in patients who were IDH2 wild-type, but otherwise similar with respect to generally older age and lack of NPM1 mutations. Likewise, Wagner et al13 found that a single nucleotide polymorphism in codon 105 of the IDH1 gene occurred in 12% of CN patients younger than age 60, a frequency similar to that in normal volunteers, and was independently associated with shorter RFS and survival, particularly in already high-risk patients (NPM1 wild-type and/or FLT3 ITD+).
However, the detection of new genetic abnormalities also illustrates the complex interactions that may be in play. Mutations in IDH1 at codon 132, reported in 10% of CN patients, serve as an example. Thus, two studies (see, for example, Wagner et al13 ) found no independent prognostic effect of these mutations, whereas a third study noted a harmful effect in the otherwise favorable NPM1-mutated/FLT3 ITD wild-type group.12 The disputed effect of WT1 mutations is even more illustrative. Three large studies reported that these were independently associated with shorter RFS (see, for example, Hou et al14 ). However, two other large studies (see, for example, Gaidzik et al15 ) did not, although similarly accounting for NPM1, FLT3, and CEBPA status, and focusing on similar patients (primarily younger than age 60, with CN de novo AML) who had a similar incidence (10%) of mutations, and who received similar treatment as patients in the studies where a prognostic effect was noted.
One possible explanation for these discrepancies is that the different studies included patients with different incidences of unknown, yet prognostic, genetic abnormalities. A second explanation invokes differences in the downstream effects of a given genetic abnormality, as discussed later.
Future Directions in Delineating High-Risk AML
The downstream effects of a genetic abnormality depend on its expression and its ultimate translation into protein. Differences in expression or translation may plausibly account for some of the discordant results noted when analysis is largely limited to the presence/absence of aberrations in genes, such as WT1, NPM, FLT3, etc, as in the previous examples. This possibility has spurred interest in comprehensive studies of gene expression, micro-RNA (miR) expression, DNA methylation, and proteomics. These studies may be particularly useful in the 15% of CN patients who appear to lack a prognostic genetic abnormality, such as those described previously.
Gene Expression Profiling (GEP).
Independent of NPM mutations and FLT3 ITDs, shorter RFS has been found in patients with high expression levels of various genes (BAALC, ERG, EVI1, and MN1), setting the stage for generalized GEP. Metzeler et al16 identified a GEP consisting of 66 genes, each of which was associated with at least a 2.9-fold increase or decrease in the risk of death in CN AML. These genes were weighted according to their effect on survival and incorporated into a continuous score that accurately predicted outcome in two independent sets of CN patients. Although FLT3 ITDs correlated with a worse score, the score replaced FLT3 ITD as a predictor of outcome, and its effect was independent of age and NPM1 mutation status. GEP may also yield biologic insights. For example, the GEP of CN patients with R172 IDH2 mutations indicates that their low CR rates may reflect overexpression of the APP gene similar to that observed in patients with complex karyotypes.12
miR Profiling.
miRs hybridize to complementary messenger RNAs and block their translation into protein. Applying techniques analogous to those used for GEP, Marcucci et al17 used a 12-probe miR set to derive a continuous score that predicted event-free survival in patients other than those used to develop the score. The score added information to that provided by FLT3 allelic burden, NPM mutation status, and ERG and BAALC expression. Garzon et al18 have reported similar findings using a different miR panel. miR profiles correlate with GEP and have enabled identification of genes plausibly related to development of AML, such as those involved in innate immunity.17
DNA Methylation Profiling.
Methylation of promoter regions of genes decreases gene expression. Examining the methylation status of 14,000 genes in each of 344 patients, Figueroa et al19 identified 16 distinct methylation clusters. Patients with NPM1 mutations fell into one of four clusters, whereas five clusters were unassociated with known cytogenetic or genetic abnormalities. The cluster a patient belonged to provided prognostic information other than that provided by NPM1, FLT3, CEBPA status, age, and cytogenetics. The same was true of a continuous score derived from the methylation pattern of 15 genes. Bullinger et al20 have found that membership in a favorable prognostic group required favorable GEP and methylation scores, whereas an unfavorable score for either denoted an unfavorable prognosis.
Proteomic Profiling.
Assaying 51 total and phosphoproteins from apoptosis, cell cycle, and signal transduction pathways, Kornblau et al21 placed patients into seven groups, according to protein signature. Pending validation in an independent population, patients in some groups appear to do unusually poorly despite having “favorable cytogenetics” or do unusually well despite having unfavorable cytogenetics. The prognostic interplay among gene expression, miR, methylation, and proteomic profiling will likely be further elucidated in the future.
Table 1 summarizes the principal, readily assessable, characteristics of patients likely to be resistant to therapy. Although the emphasis is on pretreatment characteristics, response to initial therapy is often a powerful predictor of subsequent outcome. In particular, patients ostensibly in CR—but who have “minimal residual disease” (MRD) as detected by multicolor flow cytometry,22 persistence of NPM1 mutations,23 or transcripts for WT1 (expression of which is typically increased in AML)24 —have substantially shorter RFS and thus can also be considered to belong to a high-risk group.
Therapy of High-Risk AML
The characteristics listed in Table 1 were largely identified in patients given 3+7 for induction, while receiving cytarabine at doses up to 3 g/m2 as consolidation therapy. Not surprisingly then, other therapies have been investigated in high-risk patients.
“High-Dose” Daunorubicin
Superior CR rates (adults of all ages) and survival (adults younger than age 65) have been reported in patients randomized to 3 days of daunorubicin at 90 mg2 daily, rather than the more usual 45 mg/ mg2, together with 7 days of cytarabine.25,26 However, patients younger than age 60, with unfavorable cytogenetics or FLT3 ITDs, had similar survival at the two doses,25 as did older patients with MK.26 The restriction of benefit from dose escalation to lower risk patients recalls similar findings with cytarabine.27
Gemtuzumab Ozogamicin
Gemtuzumab ozogamicin (GO) combines a toxin (calicheamicin) with an anti-CD33 antibody to selectively target hematopoietic cells. SWOG and the Medical Research Council have randomized patients younger than age 60 to receive chemotherapy (3+7, 3+10+etoposide, FLAG-ida [fludarabine, cytarabine, and idarubicin]) ± GO. Analogous to the dose escalation studies previously described, the addition of GO prolonged RFS and survival only in patients without high-risk cytogenetic abnormalities (A. K. Burnett, Cardiff University, Cardiff United Kingdom, personal communication, April 15, 2010/F. R. Appelbaum, Fred Hutchinson Cancer Research Center, Seattle, WA, personal communication, April 25, 2010).
Clofarabine
Burnett et al28 have found that, after adjusting for other prognostic factors, CR and survival rates in 106 patients (median age 71) considered unfit for 3+7 and thus given the adenosine analog clofarabine, were higher than when similarly unfit patients received low-dose ara-C (cytosine arabinoside; LDAC) and comparable with those observed when fitter older patients received 3+7-like therapy. Of note, CR rates with clofarabine were similar in patients with unfavorable and intermediate cytogenetics (44% vs 52%). In 70 relatively fit patients (median age 71) randomized to clofarabine or clofarabine + LDAC, the combination produced superior CR (63% vs 31%) and survival rates, but survival remained short (median 11 months), even with the combination.29
“Hypomethylating” Agents: Azacitidine and Decitabine
The methylation clusters described by Figueroa et al19 generally consisted of hypermethylated, rather than hypomethylated genes, leading to interest in hypomethylating agents (HAs). In a trial of 113 patients (median age 70), with 20% to 30% blasts, physicians first declared a preference for supportive care only, LDAC, or 3+7 in a given patient. Patients were then randomized to the selected conventional care regimen or azacitidine.30 Patients with unfavorable cytogenetics had median survivals of 12 months with azacitidine and 5 months with conventional care regimen. Too few patients received LDAC or 3+7 to permit robust comparisons with azacitidine. However, unlike LDAC or 3+7, achievement of CR with azacitidine does not seem a precondition for longer survival. Administering decitabine for 10 days, Blum et al31 noted a CR rate of 67% in 27 patients with unfavorable cytogenetics, a much higher rate than with the usual 5-day schedule. Although median survival was not reported for these patients, it was 1 year for all 53 patients (median age 74). Responders had higher expression of miR-29b, presumably reflecting miR-29b's ability to down-regulate enzymes involved in methylation. It remains unclear, however, whether response to HAs correlates with hypomethylation and, in particular, with reexpression of silenced genes. Such a correlation might encourage further studies combining HAs and histone deacetylase inhibitors, which appear to cooperate with HAs in inducing reexpression of silenced genes. It is unclear, however, whether the combinations are superior to azacitidine or decitabine alone.
FLT3 Inhibitors: Midostaurin, Lestaurtinib, and Sorafenib
AC220
Midostaurin (formerly PKC412) and lestaurtinib (formerly CEP701) inhibit multiple kinases, among them FLT3, whereas sorafenib and, particularly AC220, are more specific for FLT3 and much more potent FLT3 inhibitors.32 Each of the four drugs inhibits wild-type FLT3, but more effectively inhibits FLT3 ITDs and have been studied essentially exclusively in ITD+ patients. Midostaurin and lestaurtinib produced minor responses in relapsed disease and are being studied in trials randomizing untreated patients to 3+7 ± the FLT3 inhibitor. A similar trial in 224 relapsed patients found no difference in CR or survival between patients given chemotherapy ± lestaurtinib.33 However, the ability of patients' serum to inhibit ITD+ cell lines correlated with clinical response, suggesting that response rates might be higher with a more potent inhibitor, such as AC220. Indeed, this drug has considerable more single-agent activity in relapsed patients than midostaurin or lestaurtinib,34 and is being combined with chemotherapy in untreated patients. Sorafenib, the only one of these drugs currently available commercially, has also been combined with chemotherapy,35 although whether this results in added benefit is not yet known. Cytotoxicity as a result of FLT3 inhibition is greater at high allelic burdens, perhaps because blasts in patients with such burdens are more “addicted” to FLT3. Because allelic burden is typically higher in relapsed than in untreated patients, the former may benefit more from potent FLT3 specific inhibitors, such as AC220 and the latter from less potent FLT3 inhibitors that have a broader spectrum of kinase inhibition.32
Allogeneic Hematopoietic Cell Transplant
Continued debate over the role of hematopoietic cell transplant (HCT) in first CR (CR1) led Koreth et al36 to perform a meta-analysis, including 552 cytogentically high-risk patients younger than age 60 who received a myeloablative HCT from sibling donors in CR1. To avoid bias, the authors compared patients with and without donors, rather than patients who were or were not transplanted. Generally, if the donor group does better, so would patients who actually receive HCT. High-risk patients with donors had a 1.45-fold improvement in RFS and a 1.36-fold improvement in survival (P < .01 for both).36 Seventy percent to 80% of patients with donors were transplanted. Although similarly comprehensive analyses are unavailable, donor–no donor comparisons have suggested improved RFS and survival for cytogenetically high-risk patients, regardless of whether they receive an unrelated donor or matched sibling HCT.37 Reduced-intensity conditioning HCT makes sibling or unrelated donor HCT38 feasible in patients up to age 75, and results appear superior to seen in nontransplanted cytogenetically high-risk patients,39 although questions of selection bias and feasibility have arisen.40 Less is known about the role of HCT in high-risk patients as defined by molecular abnormalities. Schlenk et al5 noted longer RFS, but not survival, in CN patients younger than age 60 who had a sibling donor and were neither CEBPA mutated nor NPM1 mutated/FLT3 wild-type. Although finding a negative effect of FLT3 ITD in both patients who were and were not transplanted, Gale et al41 reported a reduced cumulative incidence of relapse, but not improved survival, in the former.
Other Agents
The rapid entry into trials of many new drugs makes virtually any list of “new drugs in trial” incomplete and outdated. Examples of such drugs include those that: (a) interfere with the protective effect of marrow stroma on AML blasts (plerixafor, MDX-1338), (b) affect apoptotic pathways (flavopridol, AG35156), (c) target AML stem cells (diphtheria toxin-linked to interleukin 3), or (d) serve as increasingly selective pre-HCT preparative regimens, thus enabling greater anti-AML potency (anti CD45-131I). The number of these agents and their potential to be used in combination call into question the role of conventional phase III trials, which often require years to investigate a single new therapy, while assuming an unrealistic homogeneity among patients.
How I Treat AML at High Risk of Resistance
Unlike testing for FLT3 allelic burden or for CEBPA mutations, testing for an NPM1 mutation or a FLT3 ITD is readily available and should be done in all patients. For practical purposes, I consider patients at high risk of resistance if they have an MK, or, although having an CN or other intermediate prognosis cytogenetics, have a FLT3 ITD or lack an NPM1 mutation (Table 1). If urgent treatment is not required (white blood cells < 50,000), I wait for cytogenetic NPM1 and FLT3 ITD results before beginning induction therapy.42 I believe that, in high-risk patients, the benefits of standard regimens such as 3+7 (Figures 1, 2, 3, and 4) are insufficient to justify their risk (or at best their inconvenience), particularly in patients older than age 60. Although younger high-risk patients often achieve CR with 3+7, induction regimen influences duration of CR as well as its achievement. It is tempting to say that HCT in CR1 renders irrelevant the effect of prior therapy. However, this may not be accurate.43 In particular, the presence of MRD prior to HCT in CR1 increases relapse rate after HCT, independently of cytogenetics.44 The presence of such MRD reflects the ineffectiveness of therapy given prior to HCT. Therefore, relapse rates, including those after HCT, might be reduced if even younger high-risk patients receive newer, potentially more effective induction therapies in clinical trials. Although data are less compelling than for 3+7, I do not think that current results (see above) suggest that single-agent clofarabine, decitabine, or azacitidine provide what many patients consider sufficient prolongation of survival, even if such prolongation is “statistically significant.” I do think each drug is very worthy of investigation in combinations. Aside from patients with FLT3 ITDs, specific therapy does not exist for most high-risk patients (eg, those with MK), and I find it very difficult to know which, if any, of several available trials would be most beneficial for a given patient. Thus, I generally recommend that patients participate in the most logistically feasible trial. The fundamental reason to enter a trial is dissatisfaction with standard therapy. Specifically, patients must conclude that, although a new therapy might ultimately prove worse than standard, it cannot be that much worse. Hence, I discuss with patients the likely outcome of standard therapy (and of single-agent azacitidine, decitabine, and clofarabine), recognizing that, in some cases, the same data would lead one patient to prefer standard therapy (or one of the newer drugs) and another to prefer a trial. However, in some patients (eg, those with an MK who are older or have comorbidities), I recommend palliative care if a trial is not feasible.
Despite the lack of studies randomizing patients with donors to HCT or not, I recommend HCT in CR1 for all high-risk patients, using sibling or alternative donors. Nonetheless, the similarly deleterious influence of unfavorable cytogenetics, FLT3 ITDs, and MRD on outcome after HCT and after consolidation chemotherapy without HCT suggests that these approaches are not as different as they might appear. More specifically, relapse rates remain high in high-risk patients even after HCT. Thus, I recommend that such patients consider participation in trials investigating different HCT preparative regimens (eg, 131I linked to anti-CD45) or administration after HCT of drugs such as azacitidine or AC220 that might reduce risk of relapse. As less toxic therapies are developed, the latter-type trials may become increasingly common.
Disclosures
Conflict-of-interest disclosure: The author declares no competing financial interests.
Off-label drug use: None disclosed.
Correspondence
Elihu Estey, MD, Professor of Medicine, University of Washington, Member Fred Hutchinson Cancer Research Center, 825 Eastlake Ave. East, Box 358081, Mailstop G3–200, Seattle, WA 98109; Phone: (206) 288-7176; Fax: (206) 288-6473; e-mail: eestey@uw.edu
