
Abstract
The myelodysplastic syndromes (MDS) are a very complex group of hematopoietic disorders. The degree of complexity relates not only to the intrinsic pathobiological characteristics of the disease, but also to the group of patients whom it affects most frequently: older individuals or those who have been exposed to prior forms of chemotherapy. It is therefore crucial to develop clinical tools to predict with a certain degree of precision the prognosis and outcome for patients with specific subtypes of MDS in specific clinical situations. At the present time, patients with MDS are diagnosed using a set of well-established histopathological criteria. Prognosis is established using classifications that include morphological features, percentage of blasts, and clinical and molecular characteristics such as peripheral cytopenias and cytogenetics. The International Prognostic Scoring System (IPSS) is a classic example of this type of classification. Over the last 5 years, there has been an intense effort to develop new prognostic systems for MDS, and new molecular alterations with potential prognostic value have been discovered. Over the same period of time, several new therapeutic interventions have been developed for patients with MDS. Biomarkers of response to these agents, in particular for the hypomethylating agents, are needed to predict clinical benefit. This review summarizes current prognostic models of MDS and new molecular alterations with potential prognostic potential.
The most widely used prognostic classification system used for the myelodysplastic syndromes (MDS) is the International Prognostic Scoring System (IPSS).1 This model was developed by Greenberg et al. in the mid-1990s and allowed a unified approach to the care of patients with MDS. Using this system, patients are classified into a lower-risk (low and intermediate-1) or a higher-risk (intermediate-2 and high) subgroup. Risk category is calculated based on three characteristics: percentage of blasts, number of cytopenias, and bone marrow cytogenetics. One of the main advantages of this scoring system is that it was calculated using a group of patients who had not received prior therapy, which allowed for the evaluation of the natural history of the disease. However, despite the historical importance of the IPSS, the system has several limitations. The first one is that the IPSS was calculated at initial presentation in patients with de novo MDS. This, in principle, precluded (although is common practice) the use of the score at later points during the evolution of the course of the disease. It also excluded patients with proliferative chronic myelomonocytic leukemia (CMML) and those with therapy-related disease (t-MDS). Most importantly, the score is not a very precise tool, particularly in patients with lower-risk disease. A classical example is the impact of thrombocytopenia. A patient with severe thrombocytopenia but with diploid cytogenetics, no other cytopenia, and a low percentage of blasts would have the same score as a patient with the same characteristics and no or minimal thrombocytopenia. Thrombocytopenia has been shown to be an independent prognostic feature in prognostic models discussed below. It has also been noted that the median survival time is highly variable for each subgroup of patients based on blast percentage if one looks at the prognostic impact of other characteristics such as cytogenetic alterations.2 These limitations have triggered significant interest in the development of new prognostic classifications, which are discussed below. It should be noted that a very large international effort to develop a new prognostic score to replace the IPSS is now under way and is supported by the MDS Foundation.
Improving Prognostic Tools in MDS: The WHO Classification-Based Prognostic Scoring System
Based on the limitations discussed above, a number of other classifications have been developed and proposed for patients with MDS, including the World Health Organization (WHO) classification-based Prognostic Scoring System (WPSS).3 This model includes morphological characteristics of the disease by WHO criteria, IPSS cytogenetics, and red cell transfusion needs. The impetus for the development of this classification was prompted by the discovery that increased red cell transfusion need has a negative impact on the prognosis of patients with MDS.4 This negative prognostic impact was confirmed by Sanz et al.,5 who found that transfusion dependency was not only associated with worse overall survival (OS), but also with increased risk of transformation to acute myelogenous leukemia (AML). This indicates that red cell transfusion and iron deposition may affect the natural history of patients with MDS, not only by inducing end-organ damage (heart and liver dysfunction), but also potentially by inducing direct damage to the hematopoietic compartment. The WPSS divides patients into five different subsets3 : very-low-, low-, intermediate-, high-, and very-high risk (Table 1). The median survival ranges from 103 months in the very-low-risk group to 12 months in the very-high-risk group. In terms of risk of transformation to AML, patients in the very high-risk category had a very high risk of transformation (1), whereas it was very low (0.06) for the very-low-risk group.
WPSS score calculation score*
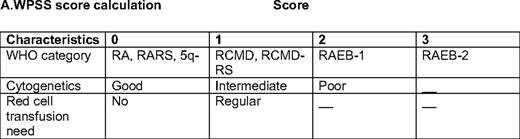
RA, refractory anemia; RARS, refractory anemia with ring sideroblasts; RCMD, refractory cytopenia with multilineage dysplasia; RCMD-RS, refractory cytopenia with multilineage dysplasia and ringed sideroblasts; RAEB-1,refractory anemia with excess blasts-1; RAEB-2, refractory anemia with excess blasts-2
*Score is calculated based on WHO category, IPSS cytogenetics, and red cell transfusions needs. Good cytogenetics: diploid, -Y, del(5q), del(20q); poor, complex (more 3 abnormalities) or chromosome 7 alterations; intermediate, the rest. Regular transfusion is defined as a red cell transfusion every 8 weeks at least over a period of 4 months. (Adapted from Malcovati et al., 2007.3 )
The WPSS has several advantages. First the statistical design and validation approach are excellent. The model was first developed in an initial learning cohort of 426 patients, and was further confirmed in a second cohort of 739 patients. The other advantage is that the WPSS was developed as a time-sequential tool, thus allowing prognostication at any time during the life of the patient. Although the WPSS is commonly used in Europe, it has not been widely applied in the United States, mainly because it requires WHO diagnosis.6 Although the WHO classification is the standard diagnostic criteria for MDS, it should be noted that the WPSS was developed using the original WHO classification,7 and still needs to be validated using the new modified WHO 2008 version.6 Finally, including morphological classifications in prognostic models limits their applicability. For example, there is significant discordance in the morphological diagnosis of 20% to 30% of patients referred to the M.D. Anderson Cancer Center (MDACC) compared with the initial outside diagnosis (unpublished data). This indicates that there is a very significant degree of inter-investigator variability when using the WHO classification, thus limiting the applicability of the WPSS classification. Another limitation of the WPSS is the issue of transfusion dependency, because clinical standards for transfusion vary from region to region. Prognostic classifications in MDS should not be based on subjective morphological assessments that require access to dedicated expert hematopathologists.
The MDACC Classifications of MDS
To overcome some of the limitations of the IPSS, we have been interested in further refining prognostic models for MDS. Our first effort focused on the development of more precise tools for patients with lower-risk disease according to the IPSS classification.8 To do this, we performed a retrospective analysis of 856 patients with low- or intermediate-1 risk disease by IPSS that presented to MDACC from 1976 to 2005. Using multivariate analysis, the following characteristics were identified as having significant prognostic value: unfavorable cytogenetics, age 60 years or older, hemoglobin less than 10 g/dL, platelet count less than 50 × 109/L or between 50 and 200 × 109/L, and bone marrow blasts 4% or more. Based on these results, we developed a prognostic score that allows us to define survival of patients with lower-risk MDS8 (Table 2). In this model, the median survival time ranged from “not reached” in patients with 0 points to 9 months for patients with the highest score possible (7 points) (Table 2 and Figure 1). Therefore, this score allows for a more precise calculation of prognosis in patients with lower-risk MDS. We then evaluated characteristics associated with progression to AML. It should be noted that only 10% of patients in this series transformed to AML. Two characteristics were associated with this phenomenon: the presence of chromosome 7 alterations and bone marrow blasts more than 4%. In a recent analysis of patients with lower-risk MDS, infection was identified as the most common cause of death,9 which has implications for the development of specific strategies for this group of patients.
A prognostic model for lower-risk MDS*
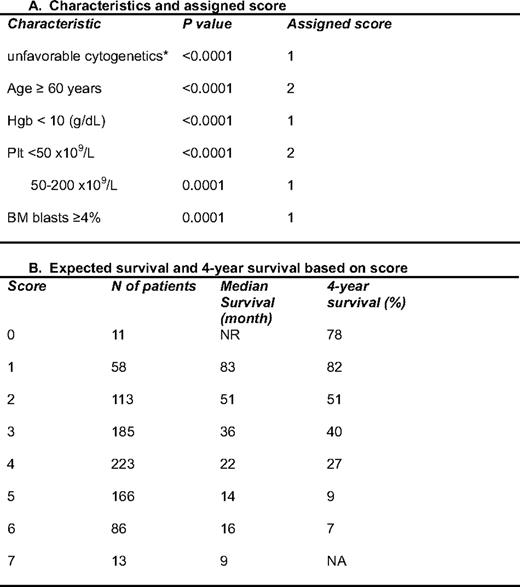
Hgb; hemoglobin; Plt, platelets
*This model was applied to patients with low or int-1 MDS according to the IPSS.1 The characteristics were identified by multivariate analysis in 856 patients from MDACC. Each characteristic was assigned a specific score shown in the right column. In this analysis, only diploid and 5q– were favorable cytogenetically; all others were considered as unfavorable cytogenetics. (Adapted from Garcia-Manero et al., 2008.8 )

Survival assessed by the lower-risk MDS MDACC score.8 Risk category is calculated by total score, as shown in Table 2.
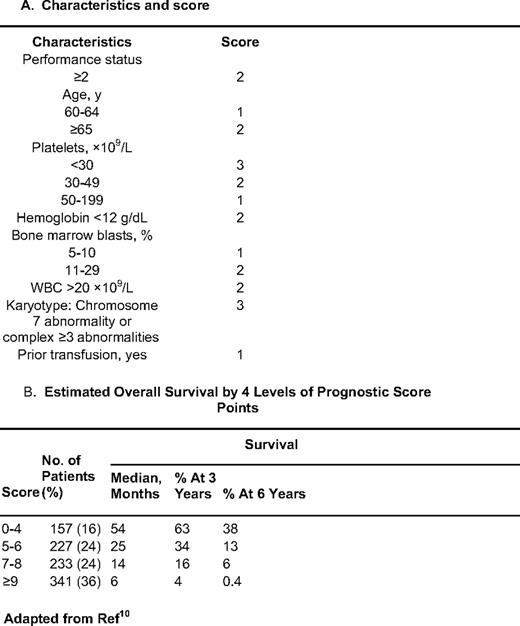
As discussed earlier, the IPSS excludes patients with t-MDS, those with proliferative CMML, and those who have received some form of therapy and in principle can only be evaluated at the time of initial diagnosis. To overcome these limitations, we developed a prognostic score that included all of these patients in addition to those included by the IPSS.10 This model was developed using an initial “training” cohort of 958 patients, and was validated in a second test group of 957 patients. The median survival time of both groups was approximately 14 months. Similar to what was done in the lower-risk setting, we identified characteristics by multivariate analysis associated with outcome in MDS. In a final prognostic model, patients were divided in four subsets: low = 0 to 4 points, intermediate-1 = 5 to 6 points, intermediate-2 = 7 to 8 points, and high-risk = 9 or more points. Prognosis could also be calculated based on the specific score (Table 3). When patients were evaluated based on their IPSS score, this new score was able to separate patients in each IPSS subcategory (Figure 2). The reverse was not observed when the IPSS was applied to each subset of patients using the MDACC score. We believe that this type of model, which uses a broader spectrum of characteristics and does not require the assessment of morphology by WHO criteria, is more effective than current proposed models. We expect that the new revised IPSS classification will validate some of these observations.

Survival based on new MDACC total MDS model. Each quadrant represents an IPSS subgroup. The MDS model was then calculated for each MDS IPSS risk.
Survival based on new MDACC total MDS model. Each quadrant represents an IPSS subgroup. The MDS model was then calculated for each MDS IPSS risk.
Overlap Syndromes and the Impact of Marrow Fibrosis
A significant number of patients with MDS have features of a myeloproliferative component, and the typical example of this is CMML. The 2008 WHO classification6 groups together a subset of disorders known as myelodysplastic/myeloproliferative neoplasms (MPN), which include CMML, atypical chronic myelogenous leukemia, juvenile myelomonocytic leukemia, and MDS/MPN unclassifiable. This last subset includes syndromes such as refractory anemia with ring sideroblasts with marked thrombocytosis (RARS-T), a provisional entity. Approximately 60% of patients with RARS-T harbor a JAK2 V617F mutation or, less frequently, a MPL W515K/L mutation, suggesting that the MPN component is important in this disorder.11 It also appears that the prognosis of these patients is benign.
Aside from this well-described subset of patients, it is not uncommon to find evidence of bone marrow fibrosis in MDS. Except for patients with RARS-T, the outcome of patients with non-CMML with MPN features is not clearly understood.12 It has been reported that the presence of myelofibrosis has a significant negative impact in patients with MDS.13 In this study, 300 consecutive patients with primary MDS were evaluated for the presence of bone marrow reticulin fibrosis and bone marrow CD34+ cells by immunocytochemistry. The degree of fibrosis was evaluated following established European guidelines.14 Grade 1 fibrosis was detected in 43% of patients, grade 2 in 15%, and grade 3 in 2%. Clusters of CD34+ cells were identified in 23% of patients. Using multivariate analysis, grade 2 and 3 reticulin fibrosis and CD34+ clusters were found to have independent prognostic value that was independent of IPSS or WPSS score. As expected, CD34+ clusters were associated with an increased percentage of blasts, poorer cytogenetics, and increased risk of transformation to AML. The presence of reticulin fibrosis was associated with multilineage dysplasia, increased cellularity, increased peripheral cytopenias, poorer cytogenetics, and increased risk of transfusion needs. The investigators then developed a model that divided patients in three clusters. Patients characterized by the presence of grade 2 or 3 fibrosis had a significantly worse prognosis. The characteristics of patients with MDS and fibrosis were different from those of patients with primary myelofibrosis. These results indicate that the presence of reticulin fibrosis is an independent predictor of prognosis and should be taken into account in new prognostic systems.
CMML as a Different Disease Entity
Currently, CMML is considered a specific subtype of MDS/MPN outside of MDS. Despite this, and from a therapeutic perspective, CMML is commonly treated as MDS.15,16 At the present time, there are no guidelines for the treatment of patients with CMML. Prognosis is considered to be worse in general compared with patients with non-CMML MDS due to the proliferative nature of CMML and the tendency of CMML to result in tissue infiltration. In 2002, Onida et al. reviewed the natural history of CMML in a retrospective analysis of 213 patients evaluated at the MDACC.17 Characteristics associated with survival in CMML included hemoglobin less than 12 g/dL, lymphocyte count higher than 2.5 × 10⁹/L, peripheral blood immature myeloid cells more than 0%, and bone marrow blasts less than 11%. Patients were divided in four groups: low, int-1, int-2, and high risk. Median survival of patients at low risk was 24 months, 15 months for int-1, 8 months for int-2, and 5 months for int-2. When analyzed in the context of lower-risk MDS, features of CMML were not associated with distinct prognosis, and it was not an independent feature in the total MDACC model. It should be noted that in this study, close to 40% of patients had a Ras point mutation, a factor that has been associated with evolution to the proliferative phase of the disease.18 Recently, mutations in c-CBL have been documented in 5% to 10% of patients with CMML and shown to be associated with a worse prognosis.19
Different Models for t-MDS and Hypoplastic MDS
Two subsets of patients are significant because of their very distinct clinical characteristics. One is the subset of patients with t-MDS, who tend to be younger patients treated with some form of chemotherapy or radiation therapy. MDS in these patients is usually characterized by the presence of complex cytogenetic alterations and a poor prognosis. The second subset is that of patients with hypocellular MDS. We have worked on delineating the prognosis of these two subsets of patients.
For patients with t-MDS, we focused on patients who had been previously treated for other malignancies.20 We identified a total of 438 patients who had a history of one or more malignancies prior to the diagnosis of MDS: 281 of these patients had received prior chemotherapy and/or radiation therapy. In a multivariate analysis, model chromosomal alterations (8+, 20q–, Y–, normal vs. others) and morphology (RA, RCMD, MDS–/U vs. others) were significant. Based on this, we divided patients into three prognostic groups: good (no risk factor; median survival, 34 months), intermediate (1 risk factor; median survival, 15 months), and poor (2 risk factors; median survival, 6.8 months). The development and validation of disease-specific classifications for patients with t-MDS is important for the development of risk-adapted approaches, including allogeneic stem-cell transplantation.
Hypoplastic MDS is a relatively infrequent subtype of MDS that frequently overlaps with aplastic anemia and for which there is evidence of significant immune deregulation.21 The bone marrow is hypocellular in 10% to 20% of patients with MDS, defined as bone marrow cellularity of less than 30% in patients younger than 70 years or less than 20% in those older than 70 years. Treatment approaches for patients with hypoplastic MDS depend on the center and the age of the patient. Our group has had an approach for these patients that is similar to that for patients with aplastic anemia: younger patients with a suitable donor are usually recommended to undergo allogeneic stem-cell transplantation; other patients are candidates for immunomodulatory types of approaches. Investigators at the National Institutes of Health (NIH) have reported a strong correlation between older age and lack of response to antithymocyte globulin (ATG) therapy. Data from the NIH have also suggested that response to ATG may not be specific to patients with hypocellular MDS, and have developed an algorithm that predicts response to this type of approach.22 The approach to these patients is further complicated by a lack of clear understanding of the natural history of patients with hypoplastic MDS. We analyzed the associations between disease characteristics and survival in 253 patients with hypocellular MDS presented to MDACC between 1993 and 2007.23 We also compared presenting characteristic and survival between these patients and a group of patients with hypercellular/normocellular MDS (n = 1725). Patients with hypocellular MDS presented with more significant thrombocytopenia, neutropenia, lower β-2 microglobulin, transfusion dependency, and more intermediate-2/high-risk disease than their hypercellular/normocellular counterparts. There was no difference in OS between the two groups. We then divided patients randomly into a study group and a test group, and a multivariate analysis of prognostic factors identified the following adverse independent factors (P < 0.001): poor performance status (ECOG 2–4), poor bone marrow cytogenetics (chromosome 7 or complex), anemia (< 10 g/dL), increased bone marrow blasts (≥5%), and high serum lactate dehydrogenase (> 600 IU/L). In this model, each characteristic has a score of 1. A new prognostic model based on these factors could classify this group of patients into three risk categories independent of IPSS score. Patients with low risk (score = 0–1) had a median survival time of 30 months and a 3-year survival rate of 44%; patients with intermediate risk (score = 2) had a median survival time of 19 months and a 3-year survival rate of 20%; patients with high-risk disease (score = 3–5) had a median survival time of 7.3 months and 3-year survival rate of 6%. When this new prognostic model was applied to the test group, the median survival time was 55, 13, and 9 months (P < 0.0001) for patients in low-, intermediate-, and high-risk groups, respectively. Patients who received immunotherapy (ATG/cyclosporine) had a better median survival time and overall survival rate than patients treated with supportive care, hypomethylating agents, or induction chemotherapy. Other studies have reported a better prognosis for patients with lower-risk hypoplastic MDS compared with normocellular/hypercellular patients.24
The Impact of Comorbidities in MDS
The median age of patients with MDS is 70 to 75 years, and the largest subset of patients with MDS are those over 60 years of age.25 Obviously, this is a subset of patients in whom the presence of other comorbidities could have a significant impact on the natural history of the disease and on treatment decisions. Several studies have analyzed the impact of comorbidities in MDS. In one study, 51% of patients had comorbidity. The hazard ratio was 1.19 (95% confidence interval (CI): 1.05–1.36) and 1.77 (95% CI: 1.50–2.08) for those with a Charlson index of 1 or 2 and ≥ 3, respectively.26 Our group performed a retrospective study of 600 consecutive patients from 2002 to 2004. We used the Adult Comorbidity Evaluation-27 (ACE-27) to assess comorbidities.27,28 According to the ACE-27 categories, median survival was 32, 17, 15 and 10 months, respectively, for those with none, mild, moderate, and severe comorbidities. Hazard ratios after adjusting for age and IPSS were 1.3, 1.6, and 2.3 for mild, moderate, and severe comorbidity, respectively, compared with no comorbidities. Comorbidities had a significant impact on the survival of patients with MDS. Patients with severe comorbidity had a 50% decrease in survival, independent of their age and their IPSS risk group. These results indicate that a comprehensive assessment of the severity of comorbidities at baseline is recommended to predict survival and plan therapy in patients with MDS, and that comorbidities should be included in the next generation of classifications. It also should be noted that the impact of comorbidity is also correlated with the intensity of the therapy.
Molecular Alterations with Prognostic Value in MDS: Not Only Cytogenetics
Cytogenetic alterations are critical in determining the prognosis of patients with MDS. Haase et al. described the frequency and clinical impact of cytogenetic alterations in a cohort of 2124 patients with MDS.2 Approximately 50% of the patients had clonal abnormalities. Using a comprehensive approach, 684 different cytogenetic categories were noted by this group. Median survival time in patients who had not received prior therapy was 53.4 months for those with normal karyotypes and 8.7 months for those with complex abnormalities. A total of 13 rare abnormalities were identified with prognostic impact: i) good: +1/+1q, t(1q), t(7q), del(9q), del(12p), chromosome 15 anomalies, t(17q), monosomy 21, trisomy 21, and -X; ii) intermediate, del(11q) or chromosome 19 anomalies; or iii) poor, t(5q). Therefore, cytogenetic analysis is key for the prognostication of patients with MDS.
One group of patients of significant interest are patients with chromosome 5 alterations. This is the most common alteration in MDS, and is observed in approximately 30% of patients.2 Because of the benign course of patients with del5q syndrome and the response to lenalidomide in patients with anemia,29 it is commonly believed to be a variable associated with better prognosis. We analyzed the outcome of patients with MDS and alteration of chromosome 5.30 In this series, 18% of 2743 patients had alterations of chromosome 5. Patients without a chromosome 5 alteration had a survival of 17 months; for those with deletion 5q it was 9 months; and for those with monosomy 5 it was 6 months. Patients with deletion 5q alone had a median survival of 33 months, but it was 17 months if this was associated with one more abnormality, and 6 to 12 months if it was associated with either two or more abnormalities or a chromosome 7 alteration. Chromosome 5 alterations were only present in 3% to 4% of patients with lower-risk MDS.
Conventional metaphase cytogenetic analysis is limited by the sensitivity of the assay, and therefore new technologies are being applied in MDS to detect genomic alterations. One of these approaches has been the use of single-nucleotide polymorphism arrays (SNP-A).31 Data from several groups have indicated that SNP-A can be used to detect genetic alterations in MDS and can be of prognostic value.31–33 Apart from the technological and analytical issues with this type of assay, it has become apparent that it is important to control for germ line alterations using the patient's own normal tissue as a control.34 The use of SNP-A has allowed the identification of areas of uniparenteral dysomy (UPD).35 Identification of UPD, also known as copy-neutral loss of heterozygosity,35 is significant because it has allowed for the identification of genetic lesions in MDS. UPD can result in duplication of mutated oncogenes after the loss of the normal allele or by inducing deletion of tumor suppressor genes. Identification of UPDs has been proposed to have prognostic value. Heinrichs et al. identified a small group of patients with an area of UPD in chromosome 7 and diploid cytogenetics with poor prognosis.34 The studies derived from results of SNP-A are of great importance because the search for genetic alterations in MDS has met with limited success.36 Using SNP-A, several candidate genes have been described recently, and include c-CBL, ASXL1, and TET-2.
C-cbl encodes an E3 ubiquitin ligase that inhibits tyrosine kinase signaling.37 Sanada et al. first identified gain-of-function mutated c-CBL by performing high-density SNP-A in 222 patients with MDS or related neoplasms.37 A UPD was identified in 31% of the cases. The most common UPD in this analysis involved chromosome 11q. These investigators focused on an overlapping region containing c-CBL. Homozygous mutations of c-CBL were found in most patients with the 11q UPD. Furthermore, these investigators provided data indicating that c-CBL undergoes a gain-of-function mutation in myeloid leukemias. In parallel with this work, Dunbar et al. also identified using SNP-A missense mutations of C-CBL in seven of 12 patients with UPD 11q.38 This same group subsequently analyzed the prognostic impact of mutations of c-CBL, and found them in 5% to 10% of patients with CMML.19 The median survival time of these patients was 5 months.19
The two other genes identified using this type of approach are ASXL1 and TET-2, which are significant because they may have a role in the control of epigenetic alterations in MDS. ASXL-1 was identified in a UPD in chromosome 20 and has a potential role in chromatin regulation.39 The frequency of mutations of ASXL-1 is approximately 10% in MDS and higher in CMML.40,41
Mutations in TET-2 in myeloid disorders have been reported by several groups.42–45 Nonsense mutations of TET2 have been reported in 26% of patients with MDS.46 The impact of TET2 mutations on the prognosis of MDS is unclear at the present time. In one study, TET2 alterations were identified in 23% of 96 MDS patients, and the 5-year overall survival rate was 77% in mutated patients versus 18% in non-mutated patients.47 The 3-year leukemia-free survival rate was 89% in mutated versus 63% in non-mutated patients. TET2 mutation remained an independent factor of favorable prognosis based on multivariate analysis.47 In contrast, TET2 mutations have been reported to have an adverse effect on CMML.48 When TET2 was first identified, its function was not known. In parallel with these studies, it was reported that a related gene, TET1, had the capacity to transform 5-methylcytosine into 5-methylhydroxycytosine and potentially induce passive induction of DNA hypomethylation.49 Therefore, the function of TET2 can have a significant role in the maintenance of DNA-methylation patterns in MDS. This could also link genetic lesions with epigenetic alterations.
In parallel with the search for genetic lesions, there has been a very significant effort made in the study of epigenetic alterations in patients with MDS, in particular aberrant DNA methylation.50 Until recently, most of the studies of DNA methylation have been single-gene analysis. A number of studies have now been presented implicating patterns of DNA methylation in the prognosis and progression to AML in MDS. In a study by Shen et al.,51 patients with a high methylation score (derived from the analysis of 10 genes) had a significantly worse prognosis than those with a lower score. In another study by the Cleveland Clinic group, methylation was associated with progression to AML.52 In the future, large-scale methylation profiles may help to predict prognosis in MDS.53
Molecular Markers of Response to Therapy
One of the most important areas of research is the identification of biomarkers of response to therapy, in particular for the hypomethylating agents. Over the last 5 years, there has been a revolution in the number of therapeutic alternatives for patients with MDS.29,54,55 A critical example is the discovery by List et al. of the relationship between the presence of a chromosome 5 alterations and response to lenalidomide,29 which resulted in the development of targeted approaches to these patients, as well as an entirely new field of research with the discovery of RPS14 as a critical gene in 5q31.56 This in turn led to the systematic analysis of other candidate genes in the commonly deleted area in 5q.57 However, at the present time, there is no clear molecular alteration to explain the responses observed with lenalidomide29 ; levels of RPS14 are not correlated with response. A gene known as SPARC has been associated with response to lenalidomide,58 as well as a set of genes in an erythroid response pathway.59 A phosphatase has also been shown to be involved with the activity of lenalidomide.60
With the exception of lenalidomide and del5q, there are very few predictive biomarkers of response to therapy in MDS. Erythropoetin levels have a relative role in predicting response to growth factor support in patients with lower-risk disease.61 The group at the NIH has developed a number of algorithms to predict response to immunomodulatory approaches such as the use of ATG and potentially alemtuzumab.22 At the present time, these results, in particular the role of HLA-DR15 and bone marrow cellularity, have not been validated by other centers.62 A CD4/CD8 ratio has been associated with response to ATG therapy,63 and a number of groups have tried to develop flow cytometry assays to diagnose and predict prognosis in MDS. A review of this research is beyond the scope of this paper.
One of the most important areas in the field of MDS research is the development of biomarkers predictive of response to hypomethylating agents. The working hypothesis has been that these drugs work by inducing DNA hypomethylation, and therefore specific methylation patterns should be predictive of response. Until now, however, in most studies there has been no association shown between methylation patterns and response.51,64,65 That said, there are limitations to the type of clinical study where this has been studied and to the technologies used. A relationship between miR-29b and response to decitabine in AML has been reported,66 and, if validated, this finding would be significant for the use of hypomethylating agents in MDS.
Conclusions and the Near Future
As discussed previoiusly, the prognosis for patients with MDS is extremely heterogeneous and is significantly affected by patient intrinsic characteristics such as age and comorbidities. It is also clear that current prognostic classifications such as IPSS, although of extraordinary value, are not precise enough at the present time to be used in all subsets of patients. Efforts such as the WPSS and the classifications from MDACC have positively contributed to the search for better prognostic classifications for MDS. Continuous research into the molecular pathogenesis of this group of disorders and biomarkers of response to current therapeutic approaches is needed.
Acknowledgments
GGM is supported by the Cancer Prevention and Research Institute of Texas (CPRIT), the Leukemia and Lymphoma Society, and NIH grants 1RCTCA147431–01 and 5PO1CA108631–05
Disclosure
Conflict-of-Interest: Author declares no competing financial interests. Off-label drug use: None disclosed.
Correspondence
Guillermo Garcia-Manero MD, Professor of Medicine, Chief, Section of Myelodysplastic Syndromes, Department of Leukemia, University of Texas, MD Anderson Cancer Center, 1515 Holcombe Blvd, Houston, TX 77025; Phone: 713–745- 3428; Fax: 713-563-0289; e-mail: ggarciam@mdanderson.org
