Abstract
All cancers evolve by a process of genetic diversification and “natural selection” akin to the process first described by Charles Darwin for species evolution. The evolutionary, natural history of childhood acute lymphoblastic leukemia (ALL) is almost entirely covert, clinically silent and well advanced by the point of diagnosis. It has, however, been possible to backtrack this process by molecular scrutiny of appropriate clinical samples: (i) leukemic clones in monozygotic twins that are either concordant or discordant for ALL; (ii) archived neonatal blood spots or Guthrie cards from individuals who later developed leukemia; and (iii) stored, viable cord blood cells. These studies indicate prenatal initiation of leukemia by chromosome translocation and gene fusion (or hyperdiploidy) and the post-natal acquisition of multiple, gene copy number alterations (CNAs), mostly deletions. The prenatal or first “hit” occurs very commonly, exceeding the clinical rate of ALL by some 100× and indicating a low rate of penetrance or evolutionary progression. The acquisition of the critical, secondary CNAs requires some Darwinian selective advantage to expand numbers of cells at risk, and the cytokine TGF beta is able to exercise this function. The clonal architecture of ALL has been investigated by single cell analysis with multicolor probes to mutant genes. The data reveal not a linear sequence of mutation acquisition with clonal succession but rather considerable complexity with a tree-like or branching structure of genetically distinct subclones very reminiscent of Darwin’s original 1837 evolutionary divergence diagram. This evolutionary pattern has important implications for stem cells in ALL, for the origins of relapse and for therapeutic targeting.
The year 2009 marks the bicentenary of Charles Darwin’s birth and the 150th anniversary of the publication of The Origin of Species by Means of Natural Selection. This is a real cause for celebration. Darwin’s irresistible body of evidence for evolutionary diversification of species and the provision of a simple and coherent explanation of the driving mechanism radically changed biology forever. Its impact has spread beyond biology into human society, politics, economics and religion—though not always to the common good. That he achieved all this without the foggiest idea of the underlying genetics is extraordinary; indeed, “natural selection” nearly died a death until it was rescued by 20th century genetics. Twenty-first century genomics now provides vivid endorsement of evolutionary relationships and an elaboration of mechanisms for generating genetic and phenotypic diversity in biology, as well as compelling genetic evidence for natural selection within human populations.1,2
Natural Selection: A Beautiful Idea
Darwin painstakingly accumulated evidence for “transmutation,” or the evolutionary descent of species, over 20 years. In contrast, the idea of natural selection itself, as a mechanism, came to him as an epiphany moment in October 1838 when he read Essay on the Principle of Population (1798) by Thomas Malthus, a man of the church and political economist. By a remarkable coincidence, the same book triggered Alfred Wallace to come up with the same idea of natural selection some two decades after Darwin’s insight (though their ideas were publicly co-presented for the first time at the UK’s Linnean Society in 1868, apparently to silence and disinterest!). So, arguably, the best idea ever in biology was lifted from a quite different arena.
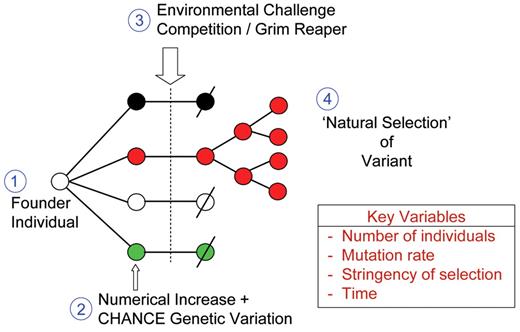
The idea itself is just exquisite. As rarely happens in science, it resolves a fundamental problem at a stroke by combining lucid simplicity with explanatory power. Four basic ground rules are involved (Figure 1 ): (1) a founder individual (or pair) for a species; (2) inherent (genetic) and stable variation arising as the descendent population expands; (3) the imposition of some potent (and lethal) environmental selection (eg, climatic changes, invasion of new predators); and (4) the selective survival and reproduction of individuals who carry the best survival or “adaptive” features. Central to the thesis is the notion that genetic variation, providing the substrate for selection, is essentially random and therefore without direction, purpose or design. Darwin himself advocated this in the early editions of his book describing survival characteristics as “accidental” or “fortuitous.” Almost calamitously, in later (5th and 6th) editions of “The Origin…,” as Darwin struggled to understand the basis of variation, he moved towards a more Lamarkian explanation, in which particular environmental pressures somehow solicited appropriate or corresponding adaptive variation. The crux of the Darwinian model remains, however, that the genetic variation is random and the outcome, or the winners, are the beneficiaries whose variant features just happen, by chance, to match the contemporary challenge to which most others will succumb and perish.
Darwinian Medicine
Darwin was in no position to appreciate the implications of his new biology for medicine or our understanding of disease, although he did comment, as did JBS Haldane more eloquently some 70 years later (in the context of malaria), that lethal infections were the most powerful natural selective force operating on human beings. Today, it is surprising and perhaps alarming that many clinicians are unaware of the relevance of evolutionary, Darwinian biology to medicine and very few medical school curricula include a component of this branch of science.3 There are probably physicians who elect not to believe in our evolution by natural selection. Over the past decade, protagonists of “Darwinian medicine” have advocated a case for its relevance, both for a range of modern, chronic diseases and for specific ailments such as cancer.4 –7 These have all reflected the edict of Theodosius Dobzhansky (1973) that “nothing in biology makes sense except in the light of evolution.” Or perhaps we can now say “….nothing in biology and medicine.” What this new paradigm shift offers is a very plausible foundation for understanding why our historical derivation by the blind, unintelligent and error-prone process of natural selection has inevitably bequeathed vulnerability to faults or deleterious trade-offs.
Natural Selection: The Penalty Points
Given enough time and enough spins of the genetic roulette wheel, natural selection can, and has, produced some fabulous results—the octopus eye, orchids and a self-reflecting human brain. But these and all evolutionary outputs are not the products of purposeful design and, as a consequence, carry flaws and liabilities. Blind engineering cannot escape these problems. Table 1 lists inherent limitations or trade-offs of natural selection that have a major impact on our vulnerability to malfunction and diseases including cancer and leukemia. Elsewhere8 I have argued that principle #2 (Table 1 ), the genetics/environment–lifestyle mismatch, provides a plausible explanation for the etiology of childhood acute lymphoblastic leukemia (ALL). The mismatch arises because the immune system has been selected in our evolutionary past to anticipate infections early in life and when deprived of such exposures, as in our modern, hygienic societies, it can misfire.
Darwinian Natural Selection in Cancer Cell Populations
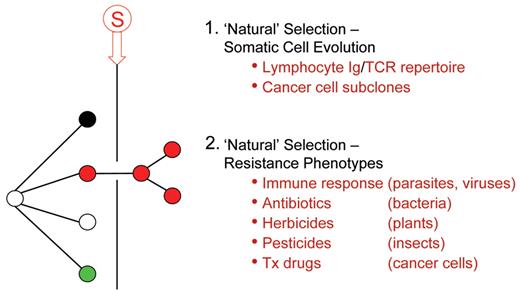
What is also extraordinary about Darwin’s model of natural selection is its applicability beyond speciation into other important areas of biology (Figure 2 ). This includes somatic cell evolution both in the immune repertoire9 and in cancer6,10 and in the many examples of the emergence of resistance, not least with chemotherapy for cancer and leukemia. This alone should validate its medical relevance. The first clear exposition of an evolutionary model for cancer was in Peter Nowell’s 1976 review article for Science.10 This influential paper emphasized the single-cell origins of tumors and leukemia, the subsequent genetic diversification and selection of dominant sub-clones; essentially linear, clonal succession. Although the model proposed was inherently Darwinian, neither Darwin nor natural selection were mentioned in the article, nor was any direct parallel or analogy with species evolution drawn. Nevertheless, cancer genetics over the past 30 years has generally endorsed such an evolutionary model, which can now be elaborated by highlighting micro-environmental restraints or bottlenecks (ie, selective pressures), ecological or histopathological correlates (eg, territorial invasiveness) and a critical role for stem cells (or cancer propagating cells)11 as the repositories of critical mutational change—as with germ cells in sexually reproducing species. And, as in evolution in general, an all pervasive impact of chance.6 The applicability of Darwinian natural selection to cancer is such that it lends itself well to mathematical modelling using methods and principles derived from ecology.12,13
Cancerous Ecosystems
Cancer and leukemic cell populations, despite being mutant escapees, are not autonomous entities and, as with emergent species, have a complex ecology.13 They require and exploit dynamic, reciprocal interactions within the tissue microenvironment and in particular within localized niches.14,15 As the latter are limited by space and resources, this dependence is likely to invoke competition between normal and leukemic cells and between leukemic sub-clones, resulting in further clonal evolution.16 Progressive evolution of leukemic cells may involve increasing occupation of additional or new niches, as happens with metastasis of cancer cells or dissemination of leukemia to ectopic sites such as the central nervous system. Niches may also provide the leukemic stem cells with sanctuaries in which quiescence is the rule17 and greater resistance to therapeutic attack a survival benefit.18 These features all parallel the behavior of species in ecosystems with specialist habitats and in which niche alteration, depletion or competitive hijack can be drivers of evolutionary change.
Is It All Darwinian Natural Selection?
Evolutionary biology has itself evolved very significantly since Darwin’s profound insights, particularly with respect to genetics (Table 2 ). Also, it is clear that prevalent genotypes need not necessarily be solely engendered by natural selection but can arise by other processes (Table 2 ), including chance, founder effects or neutral drift. Clearly this will have implications for the evolution of cancer clones. For example, some mutational features of cancer cells will predictably be neutral or “passenger” with no functional relevance. The germ cell/somatic cell genetic distinction (Table 2 ) is a feature of sexually reproducing organisms. In this respect cancer is more similar to asexually reproducing species. Yet the cancer stem cell concept attributes to cancer propagating or stem cells a germ cell–like property, ie, they are the cellular repository of all effective evolutionary change. There is increasing evidence that epigenetic changes may contribute to cancer cell phenotypes. This would appear to be a non-Darwinian “Lamarkian” type of evolutionary biology, but ironically there is now a reconsideration of whether this type of non-coding change might be inheritable under some circumstances.
Cancer cell evolution might also appear to be on a very fast track compared with species evolution, which in general it is. On the other hand, it is sluggish compared with the evolution of highly mutable viruses or bacteria.
A Darwinian Natural History for Childhood Leukemia
Over the past 20 years, my colleagues and I have elaborated a Darwinian model for the natural history of childhood ALL, the major type of pediatric cancer. The supposed advantage was that this cancer might be relatively simple in its genetics—as compared with, say, adult epithelial carcinomas—and certainly develops over a shorter time frame. The downside, however, is that the natural history of ALL is covert or clinically silent, so, by the time a patient presents with a diagnosis, its evolutionary trajectory is already history. The conundrum was then how to backtrack natural history to its beginnings. In effect, Darwin faced a very similar dilemma: how to uncover decisive evidence for past, historical events. We adopted three principal strategies: twin studies, archived neonatal blood spots and cord bloods and modelling.
Insights from Monozygotic Twins
It was Charles Darwin’s cousin, the geneticist Francis Galton, who first advocated twin studies as a way to evaluate the relative impact of inherited genetics (“nature”) versus environment (“nurture”) on normal and pathological human characteristics. His unbridled (and uncritical) advocacy of the omnipotence of genetics spawned the eugenics movement with its disastrous consequences. Far more credible 20th century research comparing monozygotic (identical) with dizygotic (non-identical/fraternal) twins have, however, proved very informative. For a very wide range of medical conditions such as obesity, autoimmune disease, cancer and neuropathologies, the data strongly implicate a constitutive, genetic background but also (because of lack of 100% concordance of these conditions in identical twins) endorse the idea that gene-environment interaction is important in most cases.22,–24 Concordance of acute leukemia in same sex (and presumed monozygotic) twin children has been recognized since 1880 and a large number of individual case reports published. Concordance rates turn out to be close to 100% for infant leukemia and 10% to 15% for typical childhood B-cell precursor (common) ALL.25 In contrast to virtually all other medical conditions with twin concordance, the explanation for ALL turned out not to be primarily genetic.25 Most (~60%) of monozygotic twins share a single placenta within which there are vascular anastamoses,26 resulting in blood cell chimerism. Wolman27 and, later, Clarkson and Boyse28 suggested that this might account for concordance of leukemia, ie, if leukemia was initiated before birth in one twin, then it would inevitably spread to the other. Boyse and Clarkson predicted this would be true for infant leukemia but not for leukemia in older children (because of the lower concordance rate). It was also anticipated that concordance should also only apply to identical twins with a single or monochorionic placenta.
In a series of studies over some 10 years with multiple twin pairs from all over the world, we were able to validate these predictions by using the clone-specific fusion gene genomic sequences (and IGH, TCR) as unique markers of single-cell origin (data reviewed in Greaves et al25). This was true both for infants (with MLL fusion genes) and for older children (with ETV6-RUNX1 fusions). These data provided compelling evidence for a prenatal origin of ALL and an early or initiating role for chromosome translocations and the resultant chimeric fusion genes.
Blood Spots and Cord Bloods (The “Fossil” Evidence)
It could be argued, however, that since the concordance rate for ALL in children was only 10% to 15%, most cases were in fact postnatal in origin (this was Boyse and Clarkson’s view). To resolve this dilemma we needed to extend the prenatal origin test to non-twinned individuals. This we did via the molecular scrutiny of archived neonatal blood spots or Guthrie cards from individuals who later developed childhood leukemia.29,30 Each blood spot has around 30,000 (~30 μL) nucleated blood cells (or genome copies). Therefore, provided there is at least 1 leukemic cell per 30,000 in blood at birth and the PCR screen with fusion gene-specific genomic sequence primers is optimal, it should be detectable. In practice, most blood spots (for ETV6-RUNX1, MLL fusions and AML1-ETO), though not all, turned out to score positive (reviewed in Greaves and Weimels31) providing direct and unambiguous evidence for a prenatal origin of leukemia in most cases. A negative blood spot is uninterpretable, so the true frequency of prenatal origins is unknown but presumably underestimated.
Additional, though somewhat anecdotal, evidence for prenatal origins of childhood ALL derive from studies on stored cord blood cells. Very rarely, and by serendipity, cord blood is stored at birth for potential future clinical use and that donor later develops childhood leukemia. We have accessed two such cases. In one the donor was diagnosed with hyperdiploid ALL.32 The blood spot of that individual was actually negative for the dominant, clonotypic IGH rearrangement present in the diagnostic sample, but screening of the cord blood revealed its presence at 10−5. Enriching B-lineage progenitors (CD34+/CD19+) by flow sorting revealed that ~6% of these cells carried trisomies of the same chromosome as the eventual ALL.32 Similarly, we have investigated stored cord blood from a patient who developed ETV6-RUNX1–positive ALL (Colman S, Bateman C, Greaves M, unpublished observations, 2009); as anticipated, we identified, via immuno-FISH, putative pre-leukemic cells with ETV6-RUNX1 fusion (at ~10−4 B-lineage cells in blood).32 This, along with other indirect evidence from clonotypic IGH rearrangements in blood spots and in twins with ALL,31 suggests that, like ETV6-RUNX1, hyperdiploidy in ALL may commonly have a prenatal, in utero origin.
Stalled Evolution
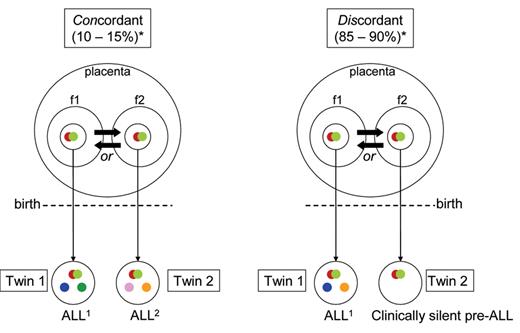
In light of the above data, the 10% to 15% concordance in twins acquires a more plausible explanation: prenatal initiation followed by the requirement for an independent and postnatal hit(s) or mutation(s) for which discordance is the rule (Figure 3 ). This interpretation is indirectly supported by modelling with murine33,34 and human stem cells35 in which a subtle, pre-leukemic phenotype is induced but not overt leukemia. Direct support again comes from twin studies, but this time with monozygotic (and monochorionic) twins who are discordant for ALL. The latter potentially provide a unique insight into the evolutionary history of ALL since both twins are anticipated to share the in utero–initiated pre-leukemic clone. In one twin, the clone will have evolved to overt malignancy via the acquisition of additional genetic abnormalities, whereas in the other twin the same pre-leukemic clone will be stalled (ie, one hit only) in its evolutionary trajectory. We described one such pair with ETV6-RUNX1–positive ALL35 and have been able to access two additional pairs, one with BCR-ABL1–positive ALL and another with hyperdiploid ALL. In each case, the predicted “stalled” pre-leukemic clone with the primary genetic lesion was present and detectable (at 10−3 to 10−4 blood lymphoid cells) in the blood of the healthy co-twin. In the case of the ETV6-RUNX1–positive ALL case, all four additional genetic abnormalities detected in the cells of the twin with ALL (via high resolution SNP arrays; see below) were, as predicted, absent from the pre-leukemic clone (Figure 3 ).
If clonal evolution to overt, clinical ALL requires accumulation of independent mutations before and then after birth, and the concordance rate in twins or probability of this happening in the twin context is 10% to 15%, an important further prediction follows. This is that the evolutionary trajectory of ALL to full malignancy will (like evolution in general) be relatively inefficient and most initiated clones will not develop the necessary complement of mutations and therefore will either stall or regress. We tested this proposition by screening several hundred stored, unselected cord bloods for presence of expanded populations of B-lineage cells with ETV6-RUNX1. The striking result was that 1% (of ~600 screened) of normal newborns were positive for putative pre-leukemic clones at the level in blood of 10−3 to 10−4.36 This is some 100× the incidence (or risk) of ALL with ETV6-RUNX1.
The 1 in 100 probability of an ETV6-RUNX1–positive clone in a newborn evolving to ALL contrasts with the ~1 in 10 probability of this happening for a healthy individual who has a pre-leukemic clone but is also a co-twin of a patient with ALL (see above). One possible reason for this marked discrepancy is that the monozygotic twins will share any inherited genetic risk factors that may contribute to risk of acquiring ALL. We have recently identified such gene variants in a genome-wide association study of childhood ALL.37
Added Complexity in Genetic Evolution of ALL
The natural history scenario that emerged from the above studies was a simple “2 hit” pre-/post-natal model.25,31 Initially, the only common or recurrent second hit recognized was (for ETV6-RUNX1–initiated cases) deletion of the non-rearranged ETV6 allele. With the advent of high-resolution (500K) SNP arrays, this picture changed radically. It became apparent that ALL could have multiple, genome-wide copy number alterations (CNA), most of which were either small intragenic or very large deletions.38 Some of these are undoubtedly neutral or passenger mutations, but others, including CNA involving ETV6, PAX5 and CDKN2A/p16, are both highly recurrent (25%–75% of cases) and encode functions relevant to leukemogenesis. It is therefore assumed that they are “driver” (ie, functional) mutations. In cases with ETV6-RUNX1 fusion an average of six CNAs were found. But where do all these additional genetic changes fit into the evolutionary history of ALL? To resolve this, we again resorted to identical twin pairs. As we reported at ASH 2008,39 using five pairs of monozygotic twins with concordant ETV6-RUNX1–positive ALL, we were able to show that all recurrent “driver” CNA detected (32 in total) were (in contrast to ETV6-RUNX1 itself) different within twin pairs (Figure 3 ). This provides strong evidence that all functional CNA are probably secondary mutations and postnatal in origin in both twins and non-twins with ALL.
Stem Cell Drivers in the Evolution of ALL
The nature and frequencies of the stem cells or cancer propagating cells in ALL has been a contentious issue.40 Twin studies have added an extra dimension to this debate by revealing the putative stem cells are not a fixed entity but themselves evolve both in genotype and phenotype. This insight comes from detailed scrutiny and comparison of leukemic and pre-leukemic populations in the pair of identical twins discordant for ETV6-RUNX–positive ALL and complementary modelling experiments with lentivirally transferred ETV6-RUNX1 in cord blood progenitor cells.35
A minor sub-population of cells in ETV6-RUNX1–positive ALL with the immunophenotype CD34+/CD38−/CD19+ can transfer the leukemia into NOD/SCID mice.35 These candidate stem cells were present, albeit at vastly different frequencies, in both the ALL of the twin with ETV6-RUNX1–positive ALL and her healthy co-twin with pre-leukemia. However, the pre-leukemic stem cells (LSC) were immunophenotypically and genotypically distinct from the overt LSC at diagnosis. Pre-LSC had only a DJH rearrangement in contrast to the VDJ present in LSC, and the former lacked CD10 expression.35 These data indicated that the leukemia propagating, or stem, cells are the focus for evolutionary, genetic change and selection in ALL, as expected from a Darwinian perspective.
Genetic analysis of paired relapse/diagnostic samples by high-resolution SNP arrays indicates that relapse, another evolutionary bottleneck transition in ALL, is associated with selection of cells (presumably stem cells) that have acquired additional genetic abnormalities.41 –42 The process of stem cell evolution is therefore essentially continuous, generating a constantly moving therapeutic target.
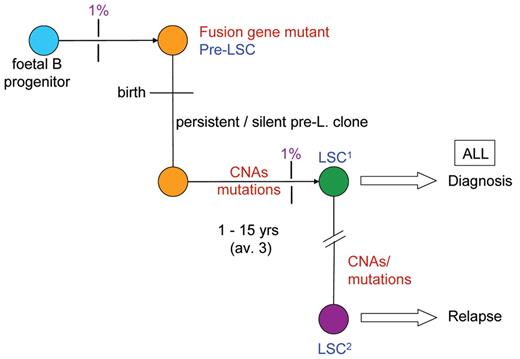
Collectively, the data from twin studies, neonatal blood spots and cord bloods suggest an evolutionary, sequential development of childhood ALL as depicted in Figure 4 .
Transiting the Evolutionary Bottleneck
We know from studies with twins and Guthrie blood spots that pre-ALL clones, driven by ETV6-RUNX1, can persist for up to 14 years, and perhaps longer. At the quantitative level, the pre-ALL clone is remarkably constant around 10−3 to 10−4 of B-lineage blood cells both in unselected cord bloods at birth36 and in the blood of healthy co-twins of patients with ALL.35 The question then becomes: how is it possible for such a modest size clone to acquire the multiple CNA that are associated with a clinical diagnosis of ALL, ie, to transit through the critical evolutionary bottleneck? The evolutionary prediction has to be that the clone needs to be expanded by some kind of selective pressure and subjected to some form of transient instability. If the immune system, via infectious challenge, provides the trigger for ALL as suggested by the epidemiology,8 then one possibility is that one or more cytokine products of a florid immune response might provide the selective force for expansion of pre-leukemic cells.
We assessed the impact of several key immunoregulatory cytokines on three models of ETV6-RUNX1-driven pre-leukemia: murine BaF3 cells expressing inducible ETV6-RUNX1, transgenic mice expressing Eμ ETV6-RUNX1 and human cord blood cells expressing lentiviral-delivered ETV6-RUNX1. In all three models, one cytokine, TGF beta, provided a selective impact.34 Normal hemopoietic stem cells and progenitors cease dividing in response to TGF beta (see Siegel and Massagué43). This operates via TGF beta receptor–initiated SMAD phosphorylation and downstream transcriptional activation of the cell cycle inhibitors p21 and p27. ETV6-RUNX1 expression effectively blocks the response of pre-leukemic cells to TGF beta.34 The consequence of inhibition is that whereas all normal (and competitive) cells stop in their tracks, pre-leukemic cells continue to divide (albeit slowly) and, we presume, in vivo could thereby gain ascendance in their bone marrow niches. The most striking result in this regard was the finding with modelled human pre-leukemic stem cells,35 the latter being strongly selected by TGF beta.34 Such an expansion could then provide the increased cells at risk required for acquisition of CNA and overt ALL. Some form of genetic instability could still be required to generate multiple CNAs. There is little evidence for any general or random genetic instability, as judged by the data from high-resolution SNP arrays.38 An alternative is off-target effects of RAGS or AID.44 –46 Models, however smart, are still only models, as Darwin recognized in his pigeon-breeding observations, and the challenge is to provide evidence that “real” ALL emerges via the same or similar Darwinian selective processes.
Complexity of Clonal Architecture in ALL: Darwin Re-visited
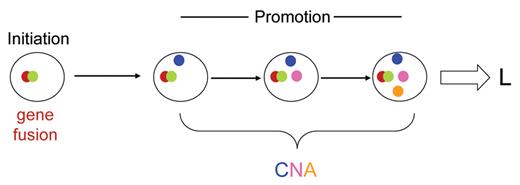
The pattern of mutation-driven natural history that emerges from these studies—and with parallel work in, say, colorectal carcinoma—appears to be as envisioned initially by Nowell: sequential accumulation of genetic changes and concomitant clonal succession. But is it really a linear evolutionary dynamic in ALL (Figure 5 )? There is evidence from some other cancers, for example esophageal47 and colon48 carcinomas, for more complex non-linear cancer cell population dynamics, albeit, in these cancers, ratcheted up by the imposition of genetic instability. The only way to address this issue effectively with leukemia is to interrogate single cells for their composite genetic or mutant profiles.
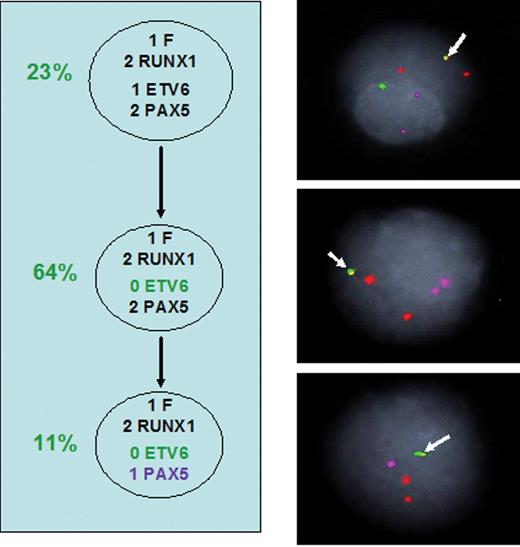
We have produced these genetic snapshots for a series of ETV6-RUNX1–positive ALL using simultaneous multicolor probes for ETV6, RUNX1, PAX5 and CDKN2A/p16 (K Anderson et al, manuscript submitted). Although a few cases appear to have a linear trajectory of sub-clones (Figure 6 ), most are considerably more complex with 3 to 10 genetically distinct sub-clones distributed into several lineages. Figure 7 illustrates one example with moderate complexity. Clearly the clonal architecture in ALL is not a simple linear one at all but rather a complex, branching structure: very much as predicted by Darwin (in his “Transmutation” notebooks) for evolution in general (Figure 8 ). We should have anticipated this from basic ground rules of evolutionary biology.
The implications of this level of diversity in ALL (and we assume other acute leukemias and cancers) are considerable. We already know that relapse can emerge from clones that were either dominant or minor at diagnosis (FW Van Delft et al, manuscript submitted),41,–42 and it is likely that several of the multiple sub-clones or lineages we detect in individual patients are self-sustaining. This suggests that patients with a diagnosis of ALL actually have several independent ALLs, albeit derived from one initial pre-leukemic clone. Therapeutic targeting of particular genetic lesions acquires an additional level of difficulty if not all cells carry the target. An additional corollary concerns the concept of stem cells for ALL, other leukemias and cancer.11 The idea that there might be a unique and definable stem cell (or cancer-propagating cell) is commonplace. This view has been challenged by the identification of AML stem cells with variable self-renewal capacity,49 by the immunophenotypic and genetic distinction, in ALL, between pre-leukemic and overt leukemic stem cells as discussed above,35 and by the demonstration that ALL can be reconstituted in NOD/SCID models by cells with different immunophenotypes from individual patients.40 What our clonal architecture data additionally suggest is that, at one time point, ie, at diagnosis, there could well be multiple, genotypically distinct and independent stem cells for ALL. This is currently being explored by xeno-transplantation.
Limitations of “design” by natural selection.
| From Greaves.7 |
|
| From Greaves.7 |
|
Post-Darwin concepts in evolutionary biology.
|
|
Principles of natural selection.
The figure illustrates four major components involved in derivation of a dominant genetic variant from original founder type by natural selection.
The key variables are four quantitative variables that impact on efficiency and dynamics of natural selection.
 Red color is indicative of favorable trait, “fitness” or adaptation.
 Slash indicates death.
Principles of natural selection.
The figure illustrates four major components involved in derivation of a dominant genetic variant from original founder type by natural selection.
The key variables are four quantitative variables that impact on efficiency and dynamics of natural selection.
 Red color is indicative of favorable trait, “fitness” or adaptation.
 Slash indicates death.
The pervasiveness of Darwinian, natural selection in biology.
 Stringent selective pressure resulting in natural selection of (red) genetic variant.
Tx indicates therapeutic.
The pervasiveness of Darwinian, natural selection in biology.
 Stringent selective pressure resulting in natural selection of (red) genetic variant.
Tx indicates therapeutic.
Acute lymphoblastic leukemia (ALL) in monozygotic/monochorionic twins.
Diagram illustrating sequence and developmental timing of critical mutational events in ALL in monozygotic twins (with one placenta) with either concordant (shared) ALL or discordant ALL (ie, in one twin only).
 Fusion gene (= initiating lesion).
 Copy number variation (secondary, postnatal gene deletions or gains).
*Concordant/discordant percentages. Probability that second twin will develop ALL after it is diagnosed in first twin.
f1, f2 Fetus.
 Transmission of pre-leukemic clone from one twin to the other (via intra-placental vascular anastomoses). Direction of transfer unknowable.
Acute lymphoblastic leukemia (ALL) in monozygotic/monochorionic twins.
Diagram illustrating sequence and developmental timing of critical mutational events in ALL in monozygotic twins (with one placenta) with either concordant (shared) ALL or discordant ALL (ie, in one twin only).
 Fusion gene (= initiating lesion).
 Copy number variation (secondary, postnatal gene deletions or gains).
*Concordant/discordant percentages. Probability that second twin will develop ALL after it is diagnosed in first twin.
f1, f2 Fetus.
 Transmission of pre-leukemic clone from one twin to the other (via intra-placental vascular anastomoses). Direction of transfer unknowable.
Does ALL develop via a linear clonal architecture? Diagram illustrates a hypothetical sequence of linear acquisition of genetic changes within a single clonal lineage. L indicates leukemia diagnosis; CNA, copy number alterations (3 shown in different colors).
Does ALL develop via a linear clonal architecture? Diagram illustrates a hypothetical sequence of linear acquisition of genetic changes within a single clonal lineage. L indicates leukemia diagnosis; CNA, copy number alterations (3 shown in different colors).
Sub-clonal genetic structure in a patient withETV6-RUNX1–positive acute lymphoblastic leukemia (ALL). Arrow, ETV6-RUNX1 fusion (F). RUNX1, orange. ETV6, green. PAX5, magenta. Circles (percentage) = subclones with distinctive genotypes (gene copy number variations) and their relative proportions in the total ALL cell population.
Sub-clonal genetic structure in a patient withETV6-RUNX1–positive acute lymphoblastic leukemia (ALL). Arrow, ETV6-RUNX1 fusion (F). RUNX1, orange. ETV6, green. PAX5, magenta. Circles (percentage) = subclones with distinctive genotypes (gene copy number variations) and their relative proportions in the total ALL cell population.
Sub-clonal genetic structure in patient withETV6-RUNX1–positive acute lymphoblastic leukemia (ALL). Dashed arrow = possible derivation. % proportion of fusion gene–positive cells in leukemic population with particular genotype. 0, 1, 2, 3 numbers against gene name: copy number identified by FISH. F, ETV6-RUNX1 fusion. 1/2/3 RUNX1, copy number of chromosome 21 region including RUNX1 gene.
Sub-clonal genetic structure in patient withETV6-RUNX1–positive acute lymphoblastic leukemia (ALL). Dashed arrow = possible derivation. % proportion of fusion gene–positive cells in leukemic population with particular genotype. 0, 1, 2, 3 numbers against gene name: copy number identified by FISH. F, ETV6-RUNX1 fusion. 1/2/3 RUNX1, copy number of chromosome 21 region including RUNX1 gene.
From Darwin’s 1837 transmutation notebook showing descent of variants (A, B, C, D) from a common precursor .
From Darwin’s 1837 transmutation notebook showing descent of variants (A, B, C, D) from a common precursor .
Disclosures Conflict-of-interest: The author declares no competing financial interests. Off-label drug use: None disclosed.
Acknowledgments
The author’s research is supported by Leukaemia Research (UK), The Kay Kendall Leukaemia Fund (UK) and The Institute of Cancer Research, UK.
References
Author notes
Section of Haemato-Oncology, The Institute of Cancer Research, Sutton, Surrey, United Kingdom

