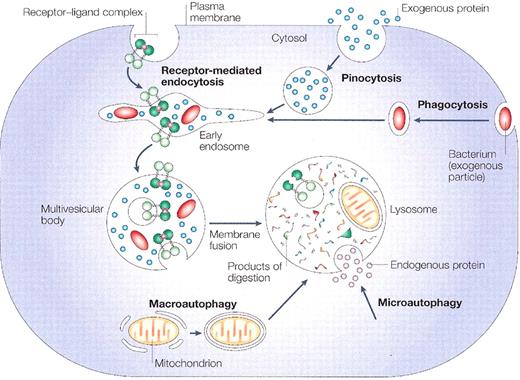
The four digestive processes mediated by the lysosome:
(i) specific receptor-mediated endocytosis, (ii) pinocytosis (non-specific engulfment of cytosolic droplets containing extracellular fluid), (iii) phagocytosis (of extracellular particles), and (iv) autophagy (micro- and macro-; of intracellular proteins and organelles)
(with permission from Nature Publishing Group. Published originally in Ref. 83).
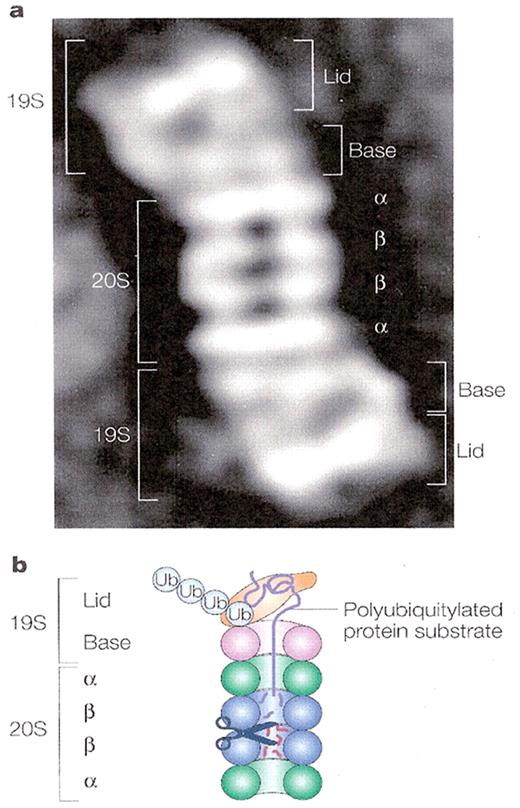
The proteasome.
The proteasome is a large, 26S, multicatalytic protease that degrades polyubiquitinated proteins to small peptides. It is composed of two sub-complexes: a 20S core particle (CP) that carries the catalytic activity, and a regulatory 19S regulatory particle (RP). The 20S CP is a barrel-shaped structure composed of four stacked rings, two identical outer α rings and two identical inner β rings. The eukaryotic α and β rings are composed each of seven distinct subunits, giving the 20S complex the general structure of α1–7β1–7β1–7α1–7. The catalytic sites are localized to some of the β subunits. Each extremity of the 20S barrel can be capped by a 19S RP each composed of 17 distinct subunits, 9 in a “base” sub-complex, and 8 in a “lid” sub-complex. One important function of the 19S RP is to recognize ubiquitinated proteins and other potential substrates of the proteasome. Several ubiquitin-binding subunits of the 19S RP have been identified; however, their biological roles mode of action have not been discerned. A second function of the 19S RP is to open an orifice in the a ring that will allow entry of the substrate into the proteolytic chamber. Also, since a folded protein would not be able to fit through the narrow proteasomal channel, it is assumed that the 19S particle unfolds substrates and inserts them into the 20S CP. Both the channel opening function and the unfolding of the substrate require metabolic energy, and indeed, the 19S RP “base” contains six different ATPase subunits. Following degradation of the substrate, short peptides derived from the substrate are released, as well as reusable ubiquitin (with permission from Nature Publishing Group. Published originally in Ref. 83).
a. Electron microscopy image of the 26S proteasome from the yeast S. cerevisiae.
b. Schematic representation of the structure and function of the 26SA proteasome.
The ubiquitin-proteasome proteolytic system.
Ubiquitin is activated by the ubiquitin-activating enzyme, E1 (1) followed by its transfer to a ubiquitin-carrier protein (ubiquitin-conjugating enzyme, UBC), E2 (2). E2 transfers the activated ubiquitin moieties to the protein substrate that is bound specifically to a unique ubiquitin ligase E3. The transfer is either direct [(3) in the case of RING finger ligases] or via an additional thiol-ester intermediate on the ligase [(4, 4a) in case of HECT domain ligases]. Successive conjugation of ubiquitin moieties to one another generates a polyubiquitin chain that serves as the binding (5) and degradation signal for the downstream 26S proteasome. The substrate is degraded to short peptides (6), and free and reusable ubiquitin is released by de-
Some of the different functions of modification by ubiquitin and ubiquitin-like proteins.
A. Proteasomal-dependent degradation of cellular proteins (see Figure 4).
B. Mono or oligoubiquitination targets membrane proteins to degradation in the lysosome/vacuole. C. Monoubiquitination, or D. a single modification by a ubiquitin-like (UBL) protein, SUMO for example, can target proteins to different subcellular destinations such as nuclear foci or the nuclear pore complex (NPC). Modification by UBLs can serve other, non-proteolytic, functions, such as protecting proteins from ubiquitination or activation of E3 complexes. E. Generation of a Lys63-based polyubiquitin chain can activate transcriptional regulators, directly or indirectly [via recruitment of other proteins (Protein Y; shown), or activation of upstream components such as kinases]. Ub denotes ubiquitin, K denotes Lys, and S denotes Cys. (with permission from Nature Publishing Group. Published originally in Ref. 83).
Aberrations in the ubiquitin-proteasome system and pathogenesis of human diseases.
Normal degradation of cellular proteins maintains them in a steady state level, although this level may change under various pathophysiological conditions (upper and lower right side). When degradation is accelerated due to an increase in the level of an E3 (Skp2 in the case of p27, for example), or overexpression of an ancillary protein that generates a complex with the protein substrate and targets it for degradation (the Human Papillomavirus E6 oncoprotein that associates with p53 and targets it for degradation by the E6-AP ligase, or the cytomegalovirus-encoded ER proteins US2 and US11 that target MHC class I molecules for ERAD), the steady state level of the protein decreases (upper left side). A mutation in a ubiquitin ligase [such as occurs in Adenomatous Polyposis Coli – APC, or in E6-AP (Angelmans’ Syndrome)] or in the substrate’s recognition motif (such as occurs in β-catenin or in ENaC) will result in decreased degradation and accumulation of the target substrate.
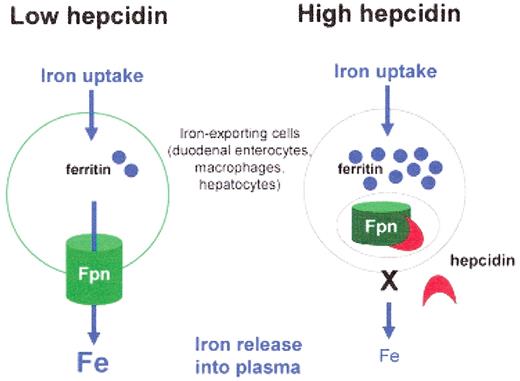
The effect of the hepcidin-ferroportin interaction on cellular iron export. When hepcidin concentrations are low, cellular iron is exported into plasma through membrane-associated ferroportin (Fpn). When hepcidin concentrations are high, hepcidin binds to ferroportin, and ferroportin is internalized and degraded. As a consequence of the loss of ferroportin, cellular iron export decreases and iron accumulates in cytoplasmic ferritin.
The effect of the hepcidin-ferroportin interaction on cellular iron export. When hepcidin concentrations are low, cellular iron is exported into plasma through membrane-associated ferroportin (Fpn). When hepcidin concentrations are high, hepcidin binds to ferroportin, and ferroportin is internalized and degraded. As a consequence of the loss of ferroportin, cellular iron export decreases and iron accumulates in cytoplasmic ferritin.
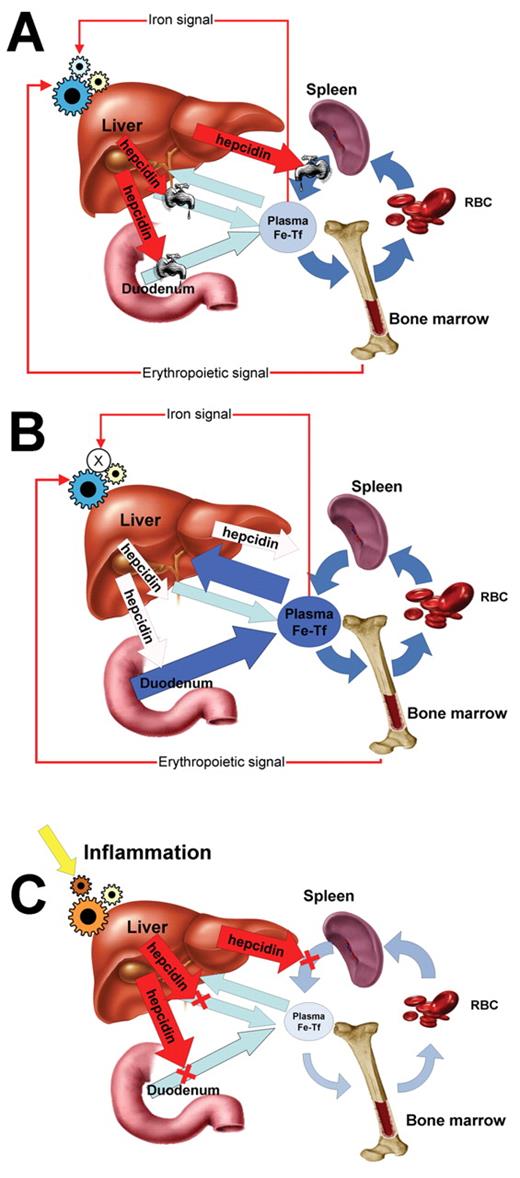
Regulation of systemic iron flows in normal subjects (A), patients with hereditary hemochromatosis (B) and patients with anemia of inflammation (C).
Iron flows are depicted by blue arrows and the effect of hepcidin by red arrows. Hepcidin-mediated regulation of iron efflux through ferroportin is depicted by valves that variably restrict iron flows. When hepcidin is deficient (B), iron absorption in the duodenum is increased, plasma transferrin becomes saturated with iron, and excess iron flows into the liver (large dark blue arrows). In anemia of inflammation (C), hepcidin synthesis is stimulated by inflammatory cytokines, and increased hepcidin (large red arrows) blocks major iron flows into plasma (light blue arrows). Plasma iron is decreased, limiting erythropoiesis.
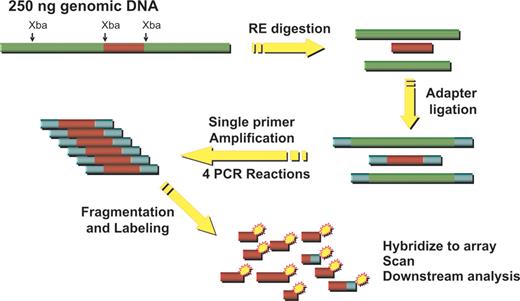
Schematic representation of DNA labeling procedure used for single nucleotide polymorphism (SNP) microarray hybridization analysis.
Adapted from ref. 39.
Schematic representation of DNA labeling procedure used for single nucleotide polymorphism (SNP) microarray hybridization analysis.
Adapted from ref. 39.
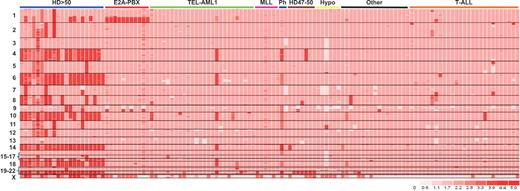
Heat map showing DNA copy number changes in a representative sample of 123 pediatric acute lymphoblastic leukemia (ALL) cases. The map was generated using dChipSNP and a Hidden Markov Model copy number inference algorithm. Each case is represented by a column and single nucleotide polymorphisms (SNPs) are arranged in rows by chromosomal location. Pink represents diploid copy number, light pink mono-allelic deletion, white bi-allelic deletion, and red amplification.
Heat map showing DNA copy number changes in a representative sample of 123 pediatric acute lymphoblastic leukemia (ALL) cases. The map was generated using dChipSNP and a Hidden Markov Model copy number inference algorithm. Each case is represented by a column and single nucleotide polymorphisms (SNPs) are arranged in rows by chromosomal location. Pink represents diploid copy number, light pink mono-allelic deletion, white bi-allelic deletion, and red amplification.
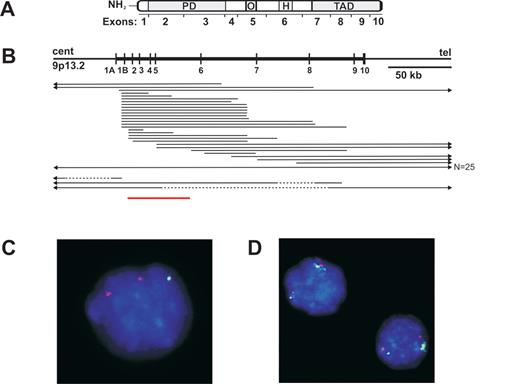
Schematic representation ofPAX5deletions in pediatric acute lymphoblastic leukemia (ALL).
(A) PAX5 domain structure. PD, paired domain; O, octomer; H, homeodomain-like; TAD, transactivation domain. (B) PAX5 genomic organization and extent of PAX5 hemizygous deletions (solid line), homozygous deletions (dashed line), and amplification (red line). (C–D) Fluorescent in situ hybridization of interphase nuclei showing mono-allelic deletion (C) and focal internal amplification of PAX5 (D) within leukemic blasts. PAX5 probe is green, control probe red.
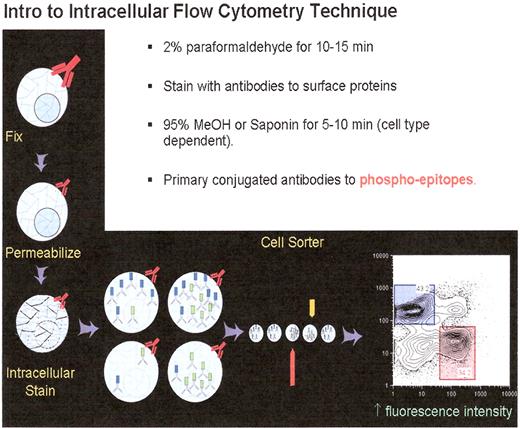
Fixation and staining of cells for phospho flow analysis. Cells are obtained and placed in culture, staring at it with appropriate cytokines or other cellular induction conditions, and at an experimentally determined time post-stimulation the cells are fixed with paraformaldehyde. As noted in the primary text the cells are permeabilized and then stained for intracellular and surface epitopes.
Fixation and staining of cells for phospho flow analysis. Cells are obtained and placed in culture, staring at it with appropriate cytokines or other cellular induction conditions, and at an experimentally determined time post-stimulation the cells are fixed with paraformaldehyde. As noted in the primary text the cells are permeabilized and then stained for intracellular and surface epitopes.
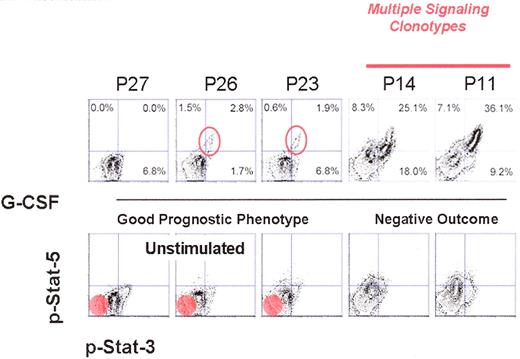
A potential clinical progression map. On the X and Y axes of each graph are the relative level of phosphorylated Stat-3 and Stat5 present in each cell. The cells become denser; these are displayed as contour maps. The lower panel set by the basal phosphorylation states of the blood cells without any stimulation. The red circle in the bottom left-hand set of three panels represents where unstimulated cells from a normal individual would lie. As can be seen already in all of these patients there is at least a basal increase in the phosphorylation state of Stat3. As noted in the primary text, G-CSF stimulation results in the appearance of the subpopulation of cells, most predominant in patient 14 and patient 11, that are increasingly positive for either Stat3 or Stat5. The open circles in patient 26 and patient 23 demarcate a subpopulation of cells that might be the initial evolution of a signaling clonotype that is more obviously evidenced in patient 14 and patient 11.
A potential clinical progression map. On the X and Y axes of each graph are the relative level of phosphorylated Stat-3 and Stat5 present in each cell. The cells become denser; these are displayed as contour maps. The lower panel set by the basal phosphorylation states of the blood cells without any stimulation. The red circle in the bottom left-hand set of three panels represents where unstimulated cells from a normal individual would lie. As can be seen already in all of these patients there is at least a basal increase in the phosphorylation state of Stat3. As noted in the primary text, G-CSF stimulation results in the appearance of the subpopulation of cells, most predominant in patient 14 and patient 11, that are increasingly positive for either Stat3 or Stat5. The open circles in patient 26 and patient 23 demarcate a subpopulation of cells that might be the initial evolution of a signaling clonotype that is more obviously evidenced in patient 14 and patient 11.
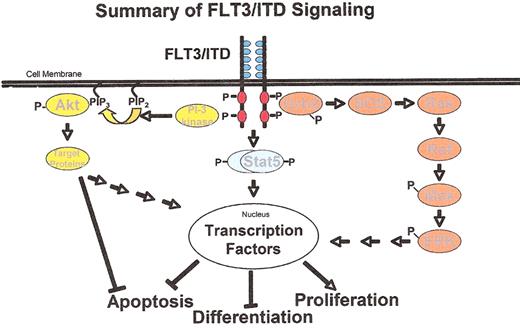
Cartoon of signaling through constitutively activated FLT3. Shown are the three major pathways through which mutant FLT3 signals.
Cartoon of signaling through constitutively activated FLT3. Shown are the three major pathways through which mutant FLT3 signals.
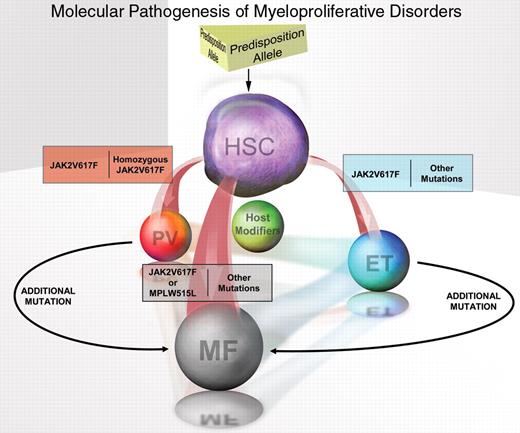
Model of the molecular pathogenesis of polycythemia vera (PV), essential thrombocytosis (ET), and myelofibrosis (MF).
Illustration by Eric Smith.
Model of the molecular pathogenesis of polycythemia vera (PV), essential thrombocytosis (ET), and myelofibrosis (MF).
Illustration by Eric Smith.
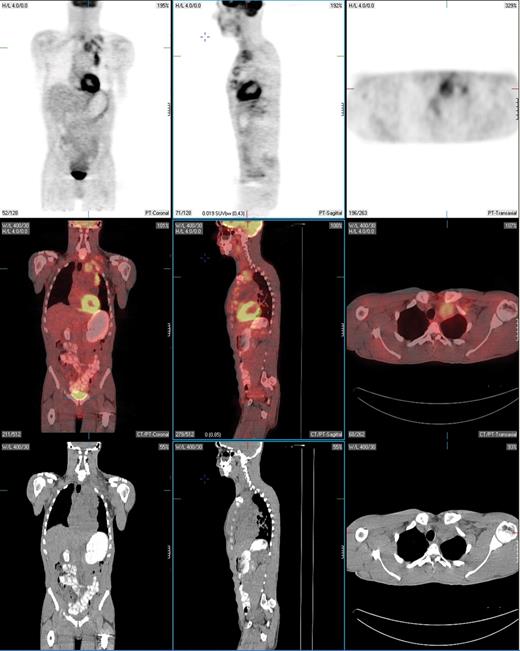
PET-positive residual mass in the anterior mediastinum extending into the left supraclavicular region in a patient with nodular sclerosis Hodgkin lymphoma. This patient underwent a restaging PET/CT scan 2 months following treatment with 6 cycles of ABVD. Fused PET/CT images show that the residual mass uptake is clearly greater than that of mediastinal blood pool structures, consistent with persistent disease. This was confirmed by fine needle aspiration and the patient then underwent salvage chemotherapy.
PET-positive residual mass in the anterior mediastinum extending into the left supraclavicular region in a patient with nodular sclerosis Hodgkin lymphoma. This patient underwent a restaging PET/CT scan 2 months following treatment with 6 cycles of ABVD. Fused PET/CT images show that the residual mass uptake is clearly greater than that of mediastinal blood pool structures, consistent with persistent disease. This was confirmed by fine needle aspiration and the patient then underwent salvage chemotherapy.
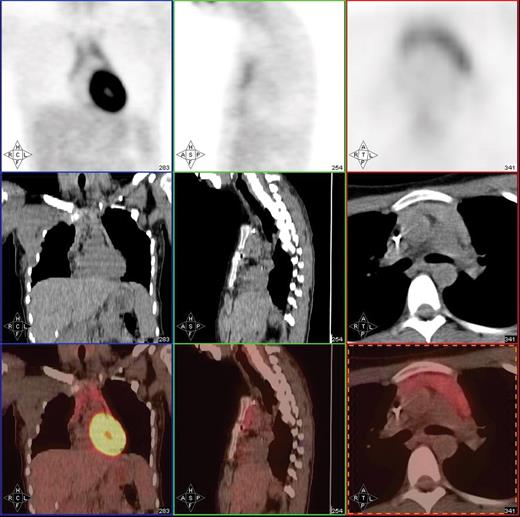
Post-treatment PET/CT scan in a 20-year-old patient with Hodgkin lymphoma showing thymic hyperplasia with otherwise no PET evidence of disease.
Post-treatment PET/CT scan in a 20-year-old patient with Hodgkin lymphoma showing thymic hyperplasia with otherwise no PET evidence of disease.
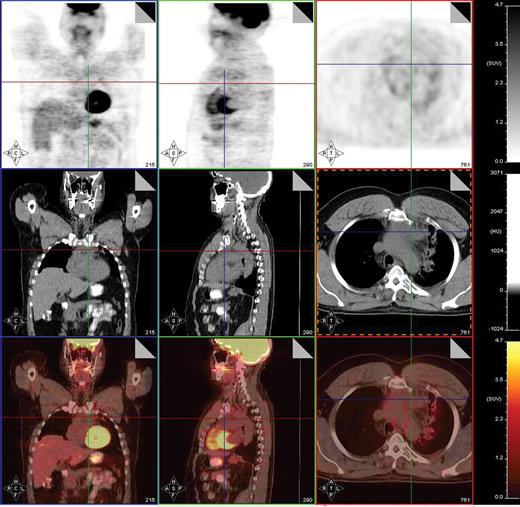
Post-treatment PET/CT scan performed 2 months after treatment with 8 cycles of AVD followed by involved field radiation therapy in a patient with stage IIA mixed cellularity Hodgkin lymphoma showing a PET-negative residual mass in the mediastinum measuring 4.2 × 2.9 cm. PET/CT was otherwise negative. This patient is currently without evidence of disease after 23 months of follow-up post therapy.
Post-treatment PET/CT scan performed 2 months after treatment with 8 cycles of AVD followed by involved field radiation therapy in a patient with stage IIA mixed cellularity Hodgkin lymphoma showing a PET-negative residual mass in the mediastinum measuring 4.2 × 2.9 cm. PET/CT was otherwise negative. This patient is currently without evidence of disease after 23 months of follow-up post therapy.
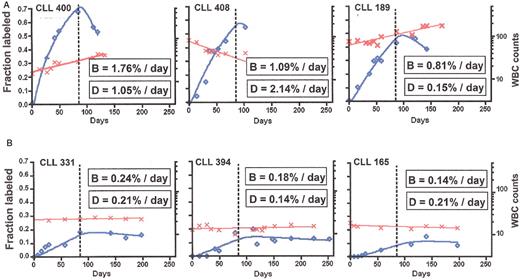
Examples of kinetics of B-cell chronic lymphocytic leukemia (B-CLL) cell birth (B) and death (D).
Percent 2H enrichment in the DNA of leukemic cells was measured and converted into a fraction of labeled cells (⋄, left vertical axis) as described.27 A two-compartment model was fit to the data using non-linear curve fitting software. WBC counts taken during the study are plotted on a log scale at right vertical axis (X). An exponential growth function was fit to the WBC data to provide a growth rate for the leukemic cells in the blood (Table 2).
A. Three patients with faster birth rates.
B. Three patients with slower birth rates.
Calculated death rates vary and correlate with changes in WBC levels.
Hypothetical model for the promoting roles of antigen stimulation and accessory signals in B-cell chronic lymphocytic leukemia (B-CLL).
[Left] B cells from U-CLL may be stimulated by binding (auto)antigen to the BCR. The balance of negative and positive signals delivered via the BCR and survival signals transduced by IgD and delivered by other cells, cytokines, and chemokines determine whether the leukemic cell proliferates or dies by apoptosis.
[Right] B cells from M-CLL are less capable of triggering apoptosis, survival, or proliferation either due to significantly diminished ability to bind antigen because of changes in the structure of the BCR (clonal ignorance), unavailability of antigen, or defective BCR signaling, despite adequate binding of antigen (anergy; green diamond-shaped antigen).
Republished, with permission, from Chiorazzi N, et al. N Engl J Med 2005: 352: 804–815. Copyright © 2005 Massachusetts Medical Society. All rights reserved.
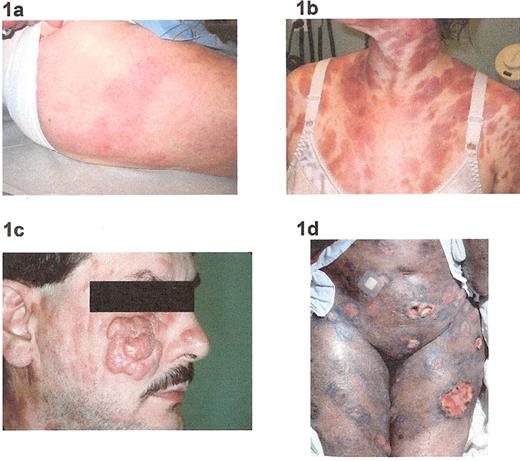
Clinical manifestations of mycosis fungoides: 1a) patches; 1b) plaques, 1c) tumors; 1d) ulcerations.
Clinical manifestations of mycosis fungoides: 1a) patches; 1b) plaques, 1c) tumors; 1d) ulcerations.
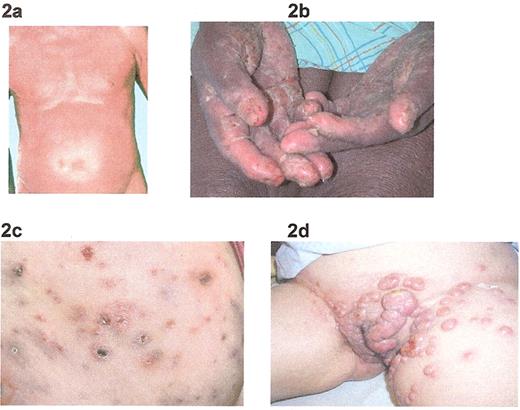
Clinical manifestations: 2a) Sézary syndrome; 2b) palmar keratoderma; 2c) lymphomatoid papulosis; 2d) anaplastic large T-cell lymphoma
Clinical manifestations: 2a) Sézary syndrome; 2b) palmar keratoderma; 2c) lymphomatoid papulosis; 2d) anaplastic large T-cell lymphoma
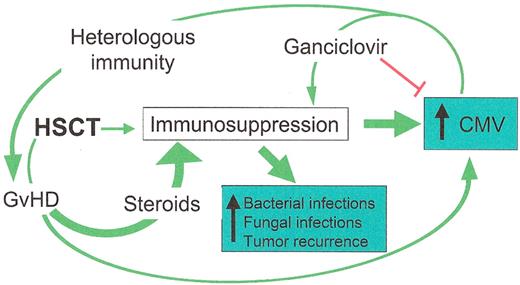
Interactions between cytomegalovirus (CMV), graft-versus-host disease (GvHD), and other adverse events.
Interactions between cytomegalovirus (CMV), graft-versus-host disease (GvHD), and other adverse events.
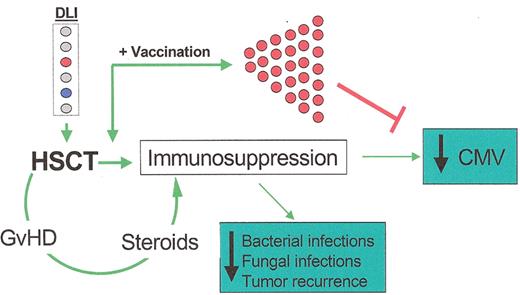
Proposed effects of anti-cytomegalovirus (CMV) vaccination (veDLI) on CMV, graft-versus-host disease (GvHD), and other adverse events after hematopoietic stem cell transplantation (HSCT).
Proposed effects of anti-cytomegalovirus (CMV) vaccination (veDLI) on CMV, graft-versus-host disease (GvHD), and other adverse events after hematopoietic stem cell transplantation (HSCT).
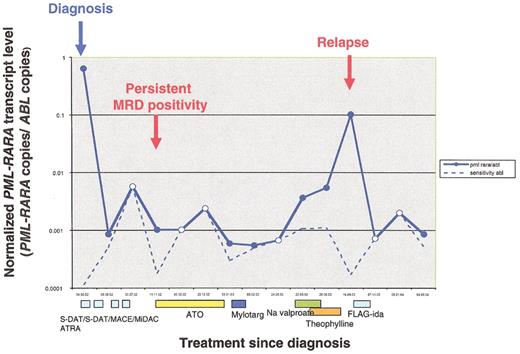
Serial MRD monitoring for thePML-RARα fusion by real-time quantitative RT-PCR (RQ-PCR).
This figure demonstrates fluctuation in PML-RARα transcript copy numbers normalized to ABL (bold blue line) in serial marrow samples taken over the treatment course of this patient, initially treated in the UK MRC AML12 trial. The sensitivity for each assay is calculated on the basis of ABL expression in the given sample and the difference in Cycle threshold value (ΔCt) between PML-RARα and ABL at diagnosis and is denoted by the dotted line. Samples testing PCR positive are indicated by filled blue circles and PCR negative by white circles (for samples testing PCR negative, the sensitivity and normalized fusion gene copy number data points are superimposed). This analysis demonstrates the advantages of RQ-PCR to investigate kinetics of molecular response and relapse, as well as identifying poor quality samples likely to give “false negative” results. A 3-log reduction in PML-RARα transcript level was observed following induction; the post-course 2 sample afforded a sensitivity of <1 in 500 and hence yielded a “false-negative” PCR result. The patient was retreated at the point of molecular relapse with arsenic trioxide (ATO), which led to a net reduction in PML-RARα fusion transcript levels. The patient was considered unfit for further intensive therapy at that stage; subsequent sequential monitoring revealed a steady rise in PML-RARα transcript levels, successfully predicting a frank hematological relapse within 5 months. The patient received re-induction therapy, achieving PCR negativity at a sensitivity of 1 in 1000. Further recurrence of PCR positivity predicted a subsequent relapse.
(Figure courtesy of D.Grimwade, Y. Hasan and E. Nugent).
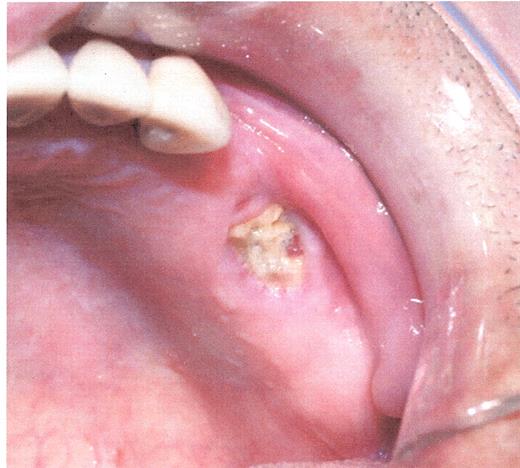
Stage I osteonecrosis of the jaw (ONJ). Patient with myeloma on zoledronic acid for 18 months.
Stage I osteonecrosis of the jaw (ONJ). Patient with myeloma on zoledronic acid for 18 months.
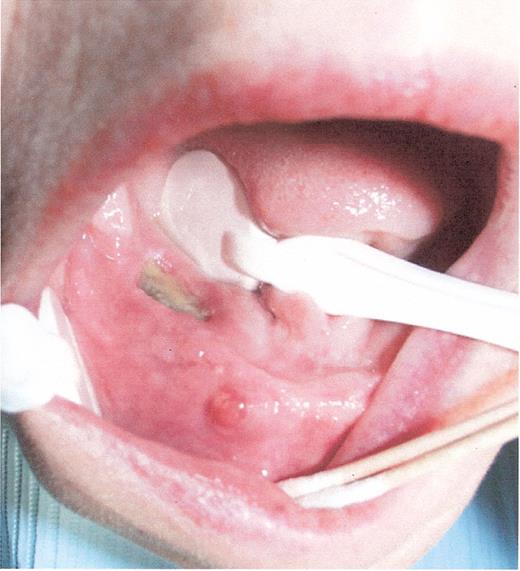
Stage II osteonecrosis of the jaw (ONJ). Patient on zoledronic acid for 18 months.
Stage II osteonecrosis of the jaw (ONJ). Patient on zoledronic acid for 18 months.
Stage III osteonecrosis of the jaw (ONJ). Patient on pamidronate for 54 months followed by zoledronate for 18 months.
Stage III osteonecrosis of the jaw (ONJ). Patient on pamidronate for 54 months followed by zoledronate for 18 months.
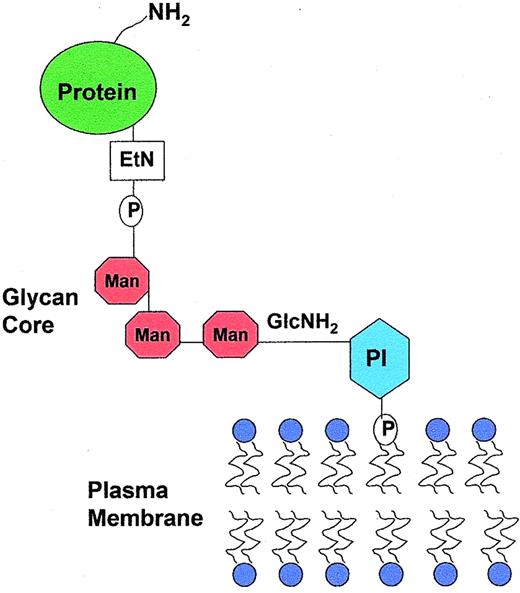
Structure of the GPI anchor. Phosphatidylinositol (PI) is inserted into the lipid bilayer of the plasma membrane. The glycan core, which contains the proaerolysin binding site, consists of a molecule of N-glucosamine (GlcNH2), three manose molecules (Man) and a molecule of ethanolamine (EtN). The representative protein is covalently attached through an amide bond to an ethanolamine on the terminal mannose.
Structure of the GPI anchor. Phosphatidylinositol (PI) is inserted into the lipid bilayer of the plasma membrane. The glycan core, which contains the proaerolysin binding site, consists of a molecule of N-glucosamine (GlcNH2), three manose molecules (Man) and a molecule of ethanolamine (EtN). The representative protein is covalently attached through an amide bond to an ethanolamine on the terminal mannose.
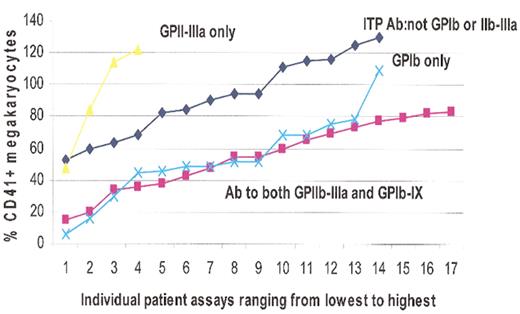
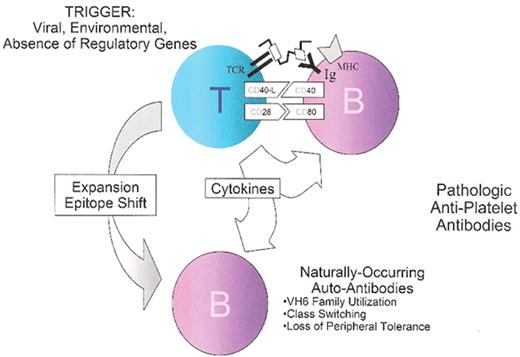
Acute immune thrombocytopenic purpura (ITP) plasma effect on megakaryopoiesis.
Acute immune thrombocytopenic purpura (ITP) plasma effect on megakaryopoiesis.

![Ciechanover Figure 5. The ubiquitin-proteasome proteolytic system. / Ubiquitin is activated by the ubiquitin-activating enzyme, E1 (1) followed by its transfer to a ubiquitin-carrier protein (ubiquitin-conjugating enzyme, UBC), E2 (2). E2 transfers the activated ubiquitin moieties to the protein substrate that is bound specifically to a unique ubiquitin ligase E3. The transfer is either direct [(3) in the case of RING finger ligases] or via an additional thiol-ester intermediate on the ligase [(4, 4a) in case of HECT domain ligases]. Successive conjugation of ubiquitin moieties to one another generates a polyubiquitin chain that serves as the binding (5) and degradation signal for the downstream 26S proteasome. The substrate is degraded to short peptides (6), and free and reusable ubiquitin is released by de-](https://ash.silverchair-cdn.com/ash/content_public/journal/hematology/2006/1/10.1182_asheducation-2006.1.505/5/m_ciechanover_fig6color.jpeg?Expires=1765134205&Signature=BNmxEZaRX08oHwQKLjI6ILnDzRVGc1A0UK3pNmSPE-SGDgqUp9n9NAzf5SJBV0F7d5hB7ZlmxAHpR5ZVfwDaV2UGv-BIt~JfGX~0PKhb7s1O5~Id2HJ17OCr-5~ZET7m6HJOAwwxf4-WQuFKGZPxQfdeNUxuYMkbp8E4Rg~JQFdtogYMf3UkzGVlnwV96tAoYtLB9ksKERqHYuxiOQr2ct3PmvTrJDMFMdyjIkaovHnqWuDbnyOlYSadIvfGK9sdGxlu5c-jugyLwguBjIi3y4Jv693fldGKcQBjIsjz5JKcF8ipBRw3G1GDEw7T4SkqRgBjpSWSnrWxpVgZjnJUmQ__&Key-Pair-Id=APKAIE5G5CRDK6RD3PGA)
![Ciechanover Figure 7. Some of the different functions of modification by ubiquitin and ubiquitin-like proteins. / A. Proteasomal-dependent degradation of cellular proteins (see Figure 4). / B. Mono or oligoubiquitination targets membrane proteins to degradation in the lysosome/vacuole. C. Monoubiquitination, or D. a single modification by a ubiquitin-like (UBL) protein, SUMO for example, can target proteins to different subcellular destinations such as nuclear foci or the nuclear pore complex (NPC). Modification by UBLs can serve other, non-proteolytic, functions, such as protecting proteins from ubiquitination or activation of E3 complexes. E. Generation of a Lys63-based polyubiquitin chain can activate transcriptional regulators, directly or indirectly [via recruitment of other proteins (Protein Y; shown), or activation of upstream components such as kinases]. Ub denotes ubiquitin, K denotes Lys, and S denotes Cys. (with permission from Nature Publishing Group. Published originally in Ref. 83).](https://ash.silverchair-cdn.com/ash/content_public/journal/hematology/2006/1/10.1182_asheducation-2006.1.505/5/m_ciechanover_fig7color.jpeg?Expires=1765134205&Signature=NomSrpikBM5vVY-Z8wGtgtT-xCauj5pYLg7bvrdYScpz6vmcqU-wO-8YUOQEkKgoMPc2Yl9OkWaaFPyNrrgMAJl4x-SENPRxQgGqYiknsalg7UcjJU5kWK3rIkpWIlmV~cQNpSq5wN5BGBboQpz6ZtVIVfr5KH1ELb0jiVEYHAkgUVxE4ayEHZ5E~KVctWtePBoRfnFYM1n0EHZvNEGmnE5-Hf~wIMzMAW4u1P0GX66uYIzOJBbKitaOJpZJTaLy3iPjBm12rrjgOB5LYtRCEOATO07ZX3XBH~tmcHccZOxPxdXfzRL5UWtQa4Wm7e0AiMT8dB5xyXPagytnA~5Tgw__&Key-Pair-Id=APKAIE5G5CRDK6RD3PGA)
![Ciechanover Figure 8. Aberrations in the ubiquitin-proteasome system and pathogenesis of human diseases. / Normal degradation of cellular proteins maintains them in a steady state level, although this level may change under various pathophysiological conditions (upper and lower right side). When degradation is accelerated due to an increase in the level of an E3 (Skp2 in the case of p27, for example), or overexpression of an ancillary protein that generates a complex with the protein substrate and targets it for degradation (the Human Papillomavirus E6 oncoprotein that associates with p53 and targets it for degradation by the E6-AP ligase, or the cytomegalovirus-encoded ER proteins US2 and US11 that target MHC class I molecules for ERAD), the steady state level of the protein decreases (upper left side). A mutation in a ubiquitin ligase [such as occurs in Adenomatous Polyposis Coli – APC, or in E6-AP (Angelmans’ Syndrome)] or in the substrate’s recognition motif (such as occurs in β-catenin or in ENaC) will result in decreased degradation and accumulation of the target substrate.](https://ash.silverchair-cdn.com/ash/content_public/journal/hematology/2006/1/10.1182_asheducation-2006.1.505/5/m_ciechanover_fig8color.jpeg?Expires=1765134205&Signature=uFyFjJOC92UdKXTOwqmBjH8rOA25rFtVZU7E105MF6WZ0hffB5RO6QwtuV3PE2158z38qQDN-fBotzkdPf3~nn8J2yNbIjUS1YqLsc4KnMVMMijtvVQCmR4X0FS-Ger37ZkKlDGn3DlD-2-MkLFAZMLljzPbrZxmbNjWOliUuAdX~ROt7FEmx8w8EhrsQIXlO7CB3KfEYQRI8IVYSAsjdn6wp5nO~nrJRC~Fn2wIOXg8YXmuyd9DzYv4w6D3HGzIHQkKl0duFewLVSpuB18~lMCjUwr8am1YbW0W5FipdZHp0Nr2kkvswQGU1FlG6~qVos83LVDrBj6hpzBmQBRtpA__&Key-Pair-Id=APKAIE5G5CRDK6RD3PGA)
![Chiorazzi Figure 2. Hypothetical model for the promoting roles of antigen stimulation and accessory signals in B-cell chronic lymphocytic leukemia (B-CLL). / [Left] B cells from U-CLL may be stimulated by binding (auto)antigen to the BCR. The balance of negative and positive signals delivered via the BCR and survival signals transduced by IgD and delivered by other cells, cytokines, and chemokines determine whether the leukemic cell proliferates or dies by apoptosis. / [Right] B cells from M-CLL are less capable of triggering apoptosis, survival, or proliferation either due to significantly diminished ability to bind antigen because of changes in the structure of the BCR (clonal ignorance), unavailability of antigen, or defective BCR signaling, despite adequate binding of antigen (anergy; green diamond-shaped antigen). / Republished, with permission, from Chiorazzi N, et al. N Engl J Med 2005: 352: 804–815. Copyright © 2005 Massachusetts Medical Society. All rights reserved.](https://ash.silverchair-cdn.com/ash/content_public/journal/hematology/2006/1/10.1182_asheducation-2006.1.505/5/m_chiorazzi_fig2color.jpeg?Expires=1765134205&Signature=LAI1iVrDBOLqw0yCKukyMavjafje0gqMQ0kzlMRLSFZIpmTOux25WRsHqHX0HK6uRE83txoY-VN-4F0ILEQgBNDKc16VGjPJoJka9Ho7a3j8zmDRJyivWch9Z8oSLHWcVvDlZ6N0kFcz4pYO7YUGID9P2Qs5UoAfgPx9-gH8XaivF1MH3BtOgHzqtNqFyAgEoy2-JhRppIqIBuqCj3ET-PDFQeevxtH1Ar5~52zQk98LtCINFYbLvFSUPDcqUYhfMOkp3Jsu9SvtBgbUcbrsWGYRVt1j9R6JYks0UswCChI5ahkHDcl-sAVU4BSgUqkb88lFR16Aw6O5Yq7LB2~Mnw__&Key-Pair-Id=APKAIE5G5CRDK6RD3PGA)
