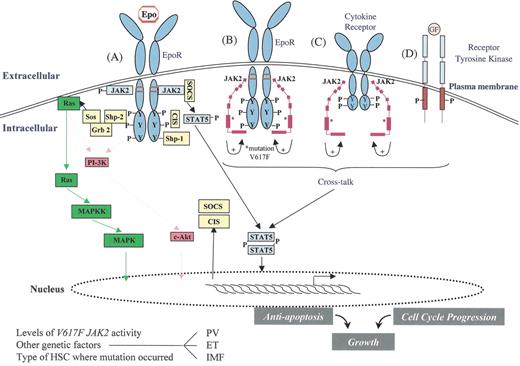
JAK2 signaling in myeloproliferative disorders (MPD).
Activation of JAK2 occurs physiologically when Epo binds to the EpoR and results in an activated dimeric conformation to the receptor (A). A number of signaling molecules (such as STAT5) become recruited to the phosphorylated receptor and JAK2. These molecules subsequently become themselves phosphorylated and activated. This results in specific gene expression pattern leading to proliferation, survival and differentiation of erythroid progenitors. At the same time, negative regulators such as SOCS and CIS proteins are induced and recruited to the receptor as well as phosphatases, such as Shp1, which negatively modulates signaling. The V617 JAK2 mutant (depicted as a modular protein in B and C) is able to bind to the cytoplasmic domain of EpoR (B) and presumably to the cytoplasmic domain of other cytokine receptors (C) and to phosphorylate discrete tyrosine (Y) residues. The V617F mutation is shown as (*) in the pseudokinase domain (B and C), and this mutation presumably activates the kinase domain of the same JAK2 molecule (intramolecular activation). The mutant JAK2 may activate cytokine receptor signaling by scaffolding to the cytoplasmic domain of EpoR and of other JAK2-utilizing cytokine receptors. This might lead to constitutive activation of STAT5, MAP-kinase, phosphatidylinositol-3-kinase (PI-3-kinase) and Akt. Activation of receptor tyrosine kinases such as IGF1 receptor (D) may synergize with the signaling of the V617 JAK2 mutant, and this cross-talk between Janus kinases and receptor tyrosine kinases may contribute to the pathogenesis of MPDs.
Depending on the level of enzymatic activity of the V617 JAK2 mutant, on the precise hematopoietic stem cell (HSC) subset where the mutation originally occurs, and on other genetic events, possibly involving SOCS or phosphatase genes, the V617 JAK2 mutant may lead to polycythemia vera (PV), essential thrombocythemia (ET), or idiopathic myelofibrosis (IMF).
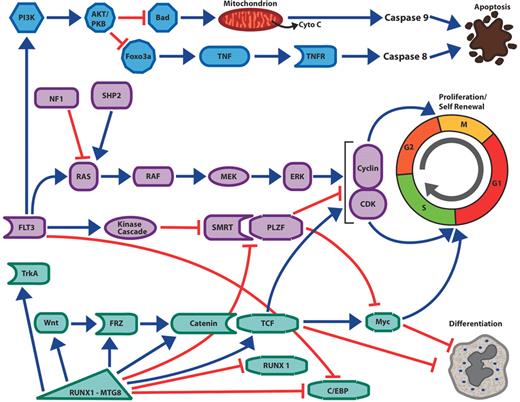
Interconnected pathways of survival, proliferation and self-renewal in acute myelogenous leukemia (AML).
Activating mutations of the Flt3 receptor tyrosine kinase activates the PI 3-kinase pathway and the AKT kinase, leading inhibition of the pro-apoptotic BH3-only protein Bad; this discourages mitochondrial-mediated apoptosis and caspase 9 activation. Activation of AKT also inactivates the Foxo3a transcription factor leading to decreased expression of components of the extrinsic cell death pathway mediated by members of the tumor necrosis factor and their cognate receptors. Activating mutations of the Flt3 kinase, ras or Shp2 protein as well as inactivating mutations of neurofibromin (NF1) leads to activation of the Map kinase pathway, the upregulation of cyclins, decreased expression of cyclin-dependent kinases and increased cell proliferation. Flt3 activation may also encourage cell proliferation by deactivation of transcription factor complexes. The PLZF growth suppressor, which inhibits cell growth by repression of c-myc and cyclin A2, binds to a critical co-factor SMRT. In response to activation of tyrosine kinase pathways, SMRT is phosphorylated, exported from the nucleus and is no longer able to cooperate with PLZF to repress transcription and cell growth. Chimeric transcription factors such as RUNX1-MTG8 and PML-RAR can upregulate components of the Wnt/catenin pathway. Wnt signaling through T cell factor (TCF) transcription factors stimulates myc and cyclin D1 expression as well as other target genes, leading to both proliferation and the ability of the undifferentiated leukemic stem cell to renew itself in the absence of differentiation. The differentiation block in AML may occur by several different mechanisms. Flt3 mutations are associated with decreased C/EBP expression, and Flt3 inhibitors lead to increased expression of that critical myeloid transcription factor. In the case of leukemia associated with RUNX1-MTG8 expression, the fusion protein acts as a dominant negative form of Runx1. Runx1, which is essential for myeloid development, normally synergizes with the C/EBP transcription factors to stimulate myeloid genes. In contrast Runx1-MTG8 blocks C/EBP function and expression and thereby blocks myeloid differentiation. Increased Wnt signaling due to the fusion protein can increase myc expression, which also favors proliferation and self-renewal over differentiation. Runx1-MTG8 can increase expression of TrkA, potentially contributing to cell proliferation.
Green arrows = stimulatory pathways. Red lines = inhibitory pathways.
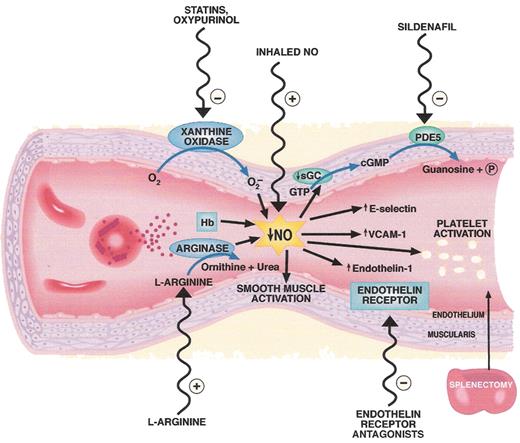
Pathogenesis and therapeutic targets in hemolysis-associated pulmonary hypertension and vasculopathy. Intravascular hemolysis releases hemoglobin into plasma which reacts with and destroys endothelial derived nitric oxide (NO). Arginase is also released from the red cell into plasma during hemolysis and degrades arginine, further reducing NO formation from arginine. Xanthine oxidase bound to endothelium produces superoxide which also inhibits NO. Reduced NO bioavailability promotes vasoconstriction, activation of adhesion molecules (VCAM), activation of endothelin-1, a potent vasoconstrictor, and activation of platelets and thrombosis (tissue factor). Splenectomy is associated with pulmonary hypertension and may increase thrombotic risk as well as intravascular hemolysis. A number of therapies that target these pathways are shown on the outside of the blood vessel.
Abbreviations: Hb, hemoglobin; PDE5, phosphodiesterase 5; VCAM-1, vascular cell adhesion molecule-1.
Figure reproduced with permission from Lin et al.63
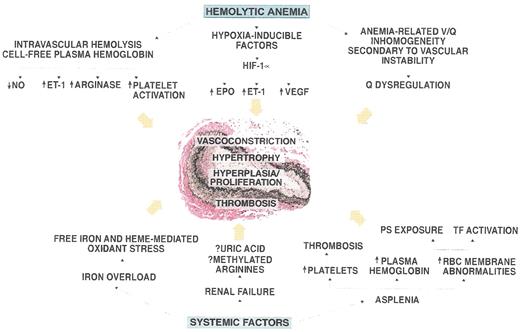
Pathogenesis of pulmonary hypertension in patients with hemolytic disorders.
The vessel shown in the figure is an autopsy specimen from a 55-year-old male with sickle cell disease and pulmonary hypertension and demonstrates the intimal and medial pulmonary arterial proliferative vasculopathy characteristic of the disease. Mechanistic factors related to hemolytic anemia and systemic complications of sickle cell disease that may contribute to the development of this vasculopathy are shown around the vessel.
Abbreviations: NO, nitric oxide; ET-1 endothelin 1; HIF, hypoxia inducible factor; EPO, erythropoietin; VEGF, vascular endothelial growth factor; PS, phosphatidylserine; TF, tissue factor; Q, lung perfusion.
Figure reproduced from Machado et al. with permission59
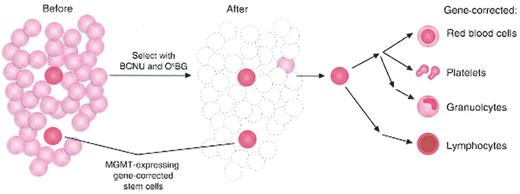
Gene therapy with hematopoietic stem cells (HSCs) and post-transduction selection.42
Limiting numbers of MGMT-expressing gene-corrected cells are expanded by initially killing most of the of untransduced HSCs with BCNU and O6-benzylguanine (O6BG) therapy. Self-renewal and expansion of MGMT gene-corrected HSCs repopulate all hematopoietic lineages.
Reprinted with permission from
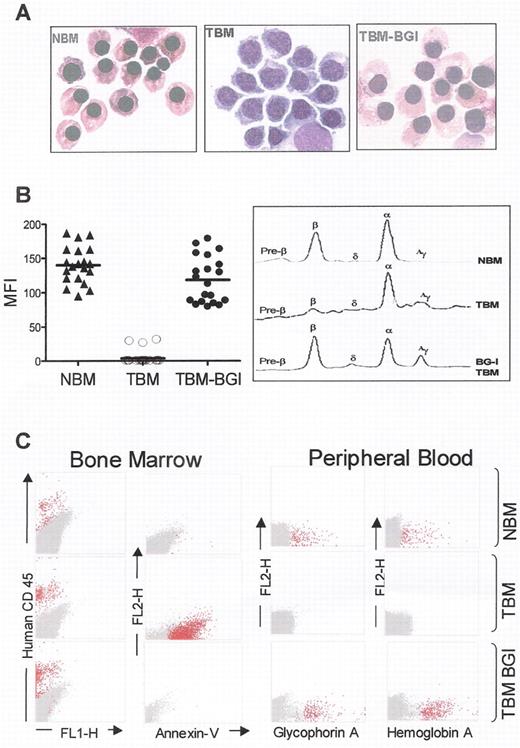
Correction of β-thalassemia major in vitro and in vivo, in immune deficient mice.
(A) Morphology of cultured CD34+ cells at day 10 of erythroid differentiation showing formation of hemoglobinized orthochromatic normoblasts in normal bone marrow (NBM). Normoblasts derived from thalassemia bone marrow CD34+ cells (TBM) fail to hemoglobinize and arrest at the polychromatophil normoblast stage of erythropoiesis, and undergo apoptosis thereafter. In contrast, normoblasts derived from TBM CD34+ cells transduced with the BGI vector (TBM-BGI) hemoglobinize and mature like those from NBM. (B) High level gene transfer and β-globin production in individual BFUe from thalassemia major bone marrow CD34+ cells transduced with the BGI vector. Individual BFUe were picked at 2 weeks and labeled with anti-HbA antibody and analyzed by FACS. The mean fluorescence intensity (MFI) of HbA expression from 20 individual BFUe colonies from NBM, TBM and TBM-BGI from one experiment is shown (left panel). Normal levels of β-globin production were seen in TBM-BGI erythroid liquid cultures, as shown by reverse phase HPLC analysis (right panel). (C) Reversal of ineffective erythropoiesis and expression of human β-globin in β2Mnull NOD-SCID mice. FACS analysis of β2Mnull NOD-SCID mouse bone marrow and blood was performed 12–16 weeks following transplant with NBM, TBM and TBM-BGI CD34+ cells. Representative dot-plots showing human CD45 (column 1) and Annexin-V staining (column 2), demonstrate sustained human cell engraftment in all mice, but presence of apoptotic cells only in TBM xenografts. Peripheral blood of the mice transplanted with NBM, TBM and TBM-BGI analyzed for glycophorin A (column 3) and HbA (column 4) expression shows presence of circulating human erythroid cells. All samples in columns 1–4 were gated on the basis of appropriate isotype controls and events falling within this gate are shown in dark gray. All events labeled with the respective human antibodies are shown in red. For intracellular HbA staining, human ζ-globin was used as the negative control and events falling within this gate are shown in dark gray. HbA labeled events falling outside this gate are shown in red.
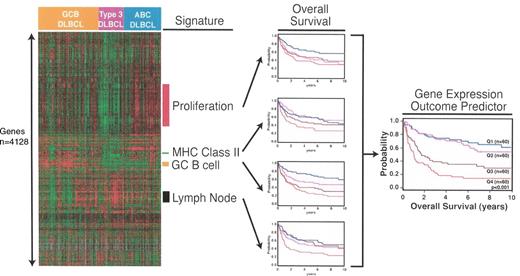
The use of gene expression signatures to form the gene expression outcome predictor in diffuse large B-cell lymphoma. Reproduced with kind permission of LM Staudt. See reference 9.
The use of gene expression signatures to form the gene expression outcome predictor in diffuse large B-cell lymphoma. Reproduced with kind permission of LM Staudt. See reference 9.
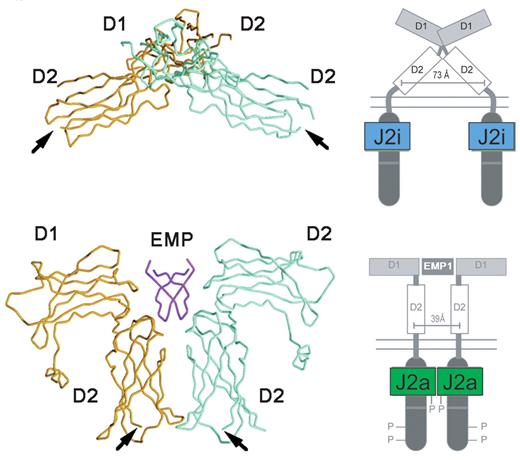
The structure of EPO-R in the absence and presence of an activating ligand.
The α-carbon trace of the extracellular domain of EPO receptor in the absence (A) and presence (B) of an activating EPO mimetic peptide (EMP) is shown, along with a cartoon representation of the intracytoplasmic events that ensue upon ligand binding.
J2i indicates inactive JAK2; J2a, active JAK2.
Adapted from Livnah et al24 and reproduced with permission. Copyright 1999 AAAS.
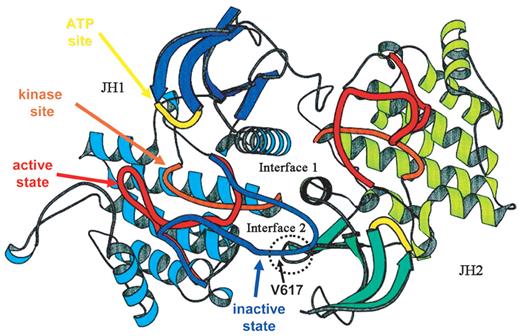
A proposed structure of JAK2.
The ribbon diagrams of the JH1 (predominant color blue) and JH2 (predominant color green) domains of JAK2 are shown, modeled on the structure of the dimeric fibroblast growth factor receptor structure. The activation loop of JH1 is shown in possible conformations, active (red) and inactive (blue) The kinase site is shown in orange and the adenosine triphosphate (ATP) binding site in yellow. The site of interaction of JH2 and the activation domain of JH1 is shown encircled, along with the location of Val617.
Adapted from Lindauer et al26 and reproduced with permission of Oxford University Press.
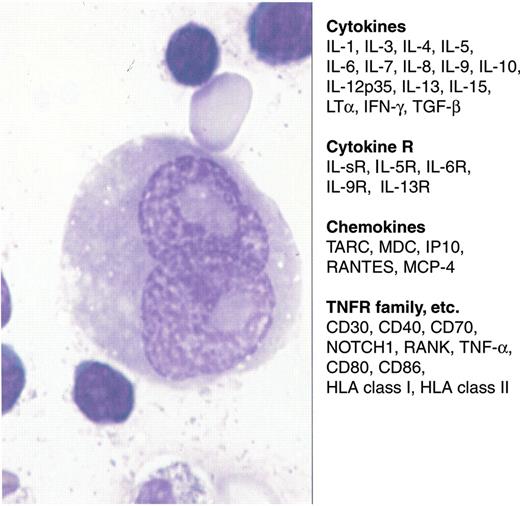
Cytokines, chemokines and various receptors in Reed-Sternberg cells.
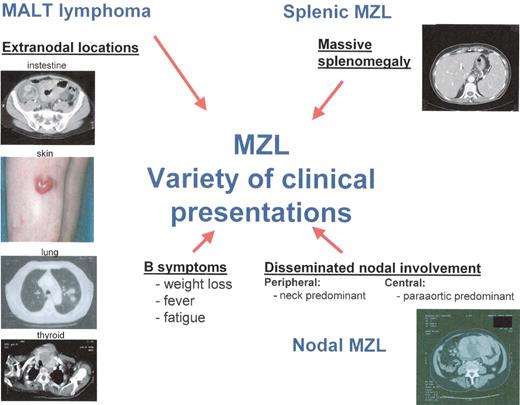
Variety of clinical presentations of marginal zone lymphoma (MZL).
Variety of clinical presentations of marginal zone lymphoma (MZL).
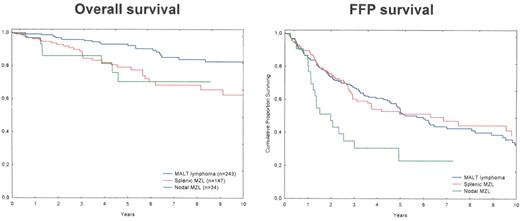
Overall and freedom-from-progression (FFP) survivals of the 424 patients with marginal zone lymphoma (MZL) treated in CHLS between 1988 and June 2005.
Overall and freedom-from-progression (FFP) survivals of the 424 patients with marginal zone lymphoma (MZL) treated in CHLS between 1988 and June 2005.
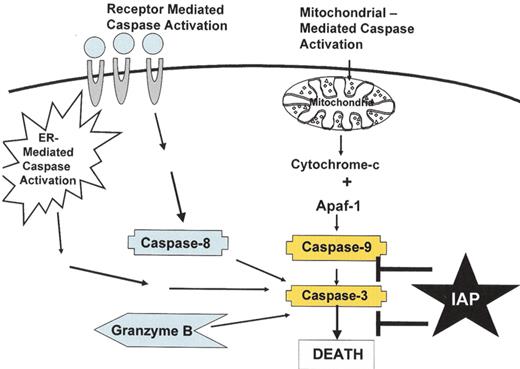
Pathways of caspase activation.
There are at least four pathways to activate caspases, including: (a) the mitochondrial pathway where damage to the mitochondria leads to release of cytochrome c and activation of caspase 9, (b) the death receptor pathway where the TNF family of death receptors activate caspase 8, (c) a pathway connected to the endoplasmic reticulum, and (d) the direct activation of effector caspases by Granzyme B. The IAP family of proteins inhibits caspases 3, 7 and 9.
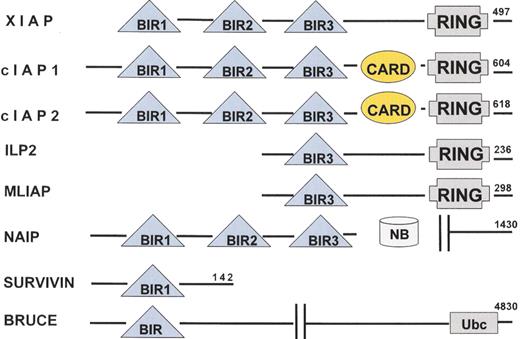
Human IAP family members.
Eight human IAP family members have been identified. All IAP family members contain at least one BIR domain and they may also contain RING and CARD domains.
Human IAP family members.
Eight human IAP family members have been identified. All IAP family members contain at least one BIR domain and they may also contain RING and CARD domains.
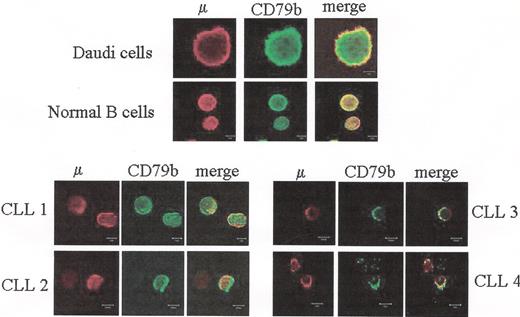
Defective assembly of Ig M and CD79b chains in chronic lymphocytic leukemia (CLL) patients.
Peripheral blood lymphocytes (PBLs) from four CLL patients, purified normal B cells or Daudi cells were fixed with PFA, permeabilized with saponin and co-labeled with anti-m Ab together with anti-CD79b Ab. The m chain was detected with a secondary Ab conjugated with Alexa 546 (red), the CD79b chain was detected with an Ab conjugated with FITC followed by an Ab conjugated with Alexa 488 (green). Yellow color at merged images indicates co-localization of the m and CD79b. It is shown that whereas m and CD79b co-localize in normal and Daudi B cells, co-localization is impaired in the case of CLL B cells.
Analysis of the subcellular localization of the various B-cell receptor (BCR) components by immunofluorescence microscopy. Fixed and permeabilized chronic lymphocytic leukemia (CLL) B cells were incubated with various combinations of mAbs as follows: anti-anticalnexin and anti-m (A), anti-C79a and anticalnexin (B), and anti-CD79b and anti-TGN46 (C). Red and green images were collected and merged, with yellow coloration indicating co-localization. It is shown that there is co-localization of m and CD79a molecules with calnexin, indicating a retention of these molecules in the reticulum endosplasmic (RE) compartment. In contrast, CD79b co-localization with TGN46, which indicates that CD79b has not been retained in the RE compartment and attained the Golgi compartment.
Analysis of the subcellular localization of the various B-cell receptor (BCR) components by immunofluorescence microscopy. Fixed and permeabilized chronic lymphocytic leukemia (CLL) B cells were incubated with various combinations of mAbs as follows: anti-anticalnexin and anti-m (A), anti-C79a and anticalnexin (B), and anti-CD79b and anti-TGN46 (C). Red and green images were collected and merged, with yellow coloration indicating co-localization. It is shown that there is co-localization of m and CD79a molecules with calnexin, indicating a retention of these molecules in the reticulum endosplasmic (RE) compartment. In contrast, CD79b co-localization with TGN46, which indicates that CD79b has not been retained in the RE compartment and attained the Golgi compartment.
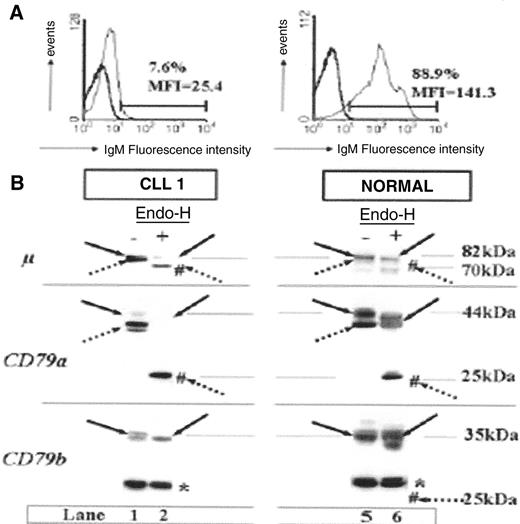
Differences in IgM surface expression pro-files and B-cell receptor (BCR) component glycosylation status between chronic lymphocytic leukemia (CLL) patients and healthy subjects.
(A) Flow cytometry analysis of surface IgM staining. Results from a representative patient weakly expressing IgM, and from a representative healthy subject are shown.
(B) Glycosylation analysis of BCR components. Cell extracts (20 g) produced by lysis in modified bovine serum (MBS) were incubated at 37°C in the presence (+) or absence (−) of Endo-H and separated by 10% SDS-PAGE, and the resulting protein bands were transferred to nitrocellulose. Filters were probed with mAbs as follows: rabbit anti-m heavy chain, mouse anti-CD79a (CD79a), or anti-CD79b (CD79b), and immunoreactive bands were detected with an appropriate horseradish peroxidase–linked secondary antibody. Immature glycosylated (dotted arrows) and mature glycosylated (solid arrows) proteins are indicated for each staining. Forms deglycosylated by Endo-H treatment are indicated by #. Molecular masses are indicated in kilodaltons (kDa). The asterisk indicates a nonspecific band at 30 kDa constantly observed with the anti-CD79b probe from Pharmingen. It is shown that a majority of m and CD79a chains produced by CLL B cells are still sensitive to Endo-H, indicating that they are immature.
This contrasts with normal B cells where a majority of m and CD79a molecules are resistant to Endo-H. Interestingly, no defect in glycosylation could be found for CD79b molecules.
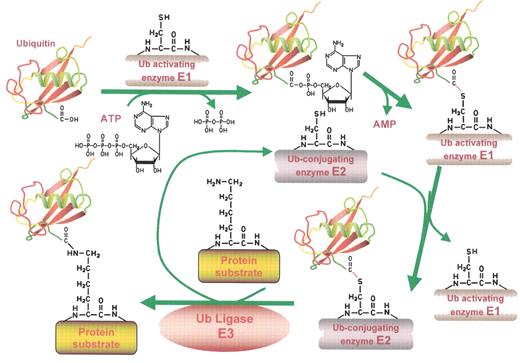
The ubiquitin conjugating pathway.
Proteins destined for degradation through the ubiquitin-proteasome pathway are first labeled with ubiquitin (Ub) tags by the Ub conjugating machinery detailed in this figure. In the initial step, ubiquitin, a highly conserved 8.5 kDa protein, is activated in an ATP-dependent fashion by an E1 Ub activating enzyme, forming a high energy Ub-E1 bond. The thiolester linkage is preserved during the next step, in which the Ub moiety is transferred to an E2 Ub conjugating enzyme. In association with an E3 ubiquitin ligase, the E2 then generally transfers the Ub moiety to an ε-amino group of a specific lysine residue of the target protein. Several cycles of this reaction occur to generate the poly-ubiquitin chains that mark a protein for proteolysis. This figure has been adapted from ScienceSlides 2005 (VisiScience Inc.; www.visiscience.com) with permission of the publisher.
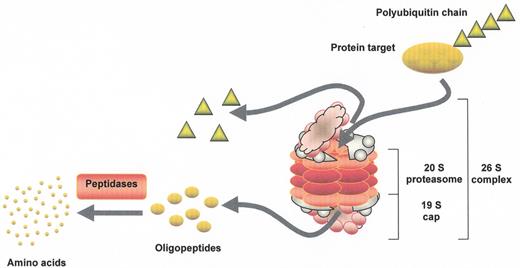
Proteasome-mediated proteolysis.
Polyubiquitinated proteins are substrates for proteolysis by the 26S proteasome, which is made up of a core 20S particle and two 19S regulatory cap structures at either end. The 20S core is arranged as four stacked rings, with each of the outer rings containing α subunits that serve a structural function, while the two inner rings contain β subunits that encode the proteolytic activities. Ub tags are recognized by subunits of the cap structure and removed by deubiquitinating enzymes for later reuse. Protein targets are then unwound in an ATP-dependent fashion and fed into a central chamber in the proteasome, where the proteases generate oligopeptides that are later further degraded outside of the proteasome into their constituent amino acids. This figure has been adapted from ScienceSlides 2005 (VisiScience Inc.; www.visiscience.com) with permission of the publisher.
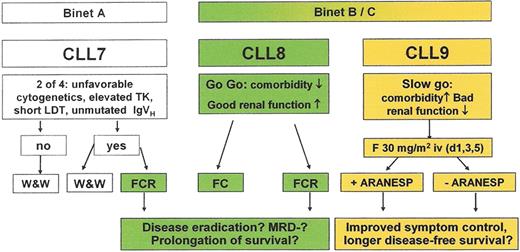
Current treatment strategy of the German CLL Study group.
For further explanations see text or contact www.dcllsg.de.
Abbreviations: ARANESP, darbepoietin alfa; CLL, chronic lymphocytic leukemia; FC, fludarabine plus cyclophosphamide; FCR, fludarabine, cyclophosphamide plus rituximab; GCLLSG, German CLL study group; MRD, minimal residual disease.
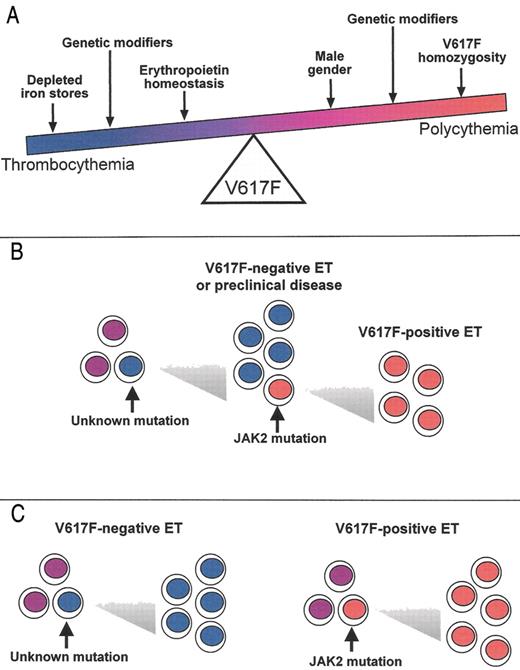
The continuum model for V617F-positive thrombocythemia and polycythemia.
The phenotypic consequences of the V617F mutation, and hence the position of any individual within the continuum, will depend on physiological and genetic modifiers. Erythropoiesis is constrained by iron deficiency and low serum erythropoietin, but is promoted by male gender and V617F-homozygosity. Other acquired and inherited modifiers are also likely to affect the phenotype. The position of the arrows is not meant to denote the relative strength of the various modifiers.
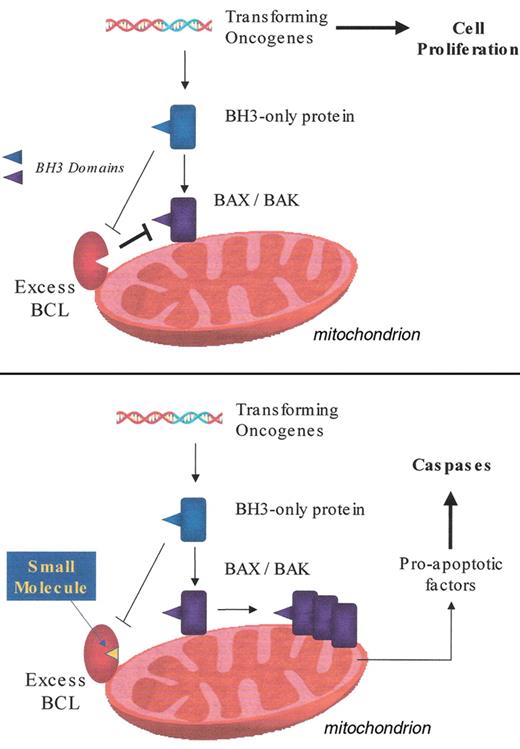
The mitochondrial apoptosis pathway. Inhibition by excess pro-survival BCL-2 members (upper panel) and reversal of this inhibition by small molecule BCL-2 antagonist (lower panel). Details are given in the text.
The mitochondrial apoptosis pathway. Inhibition by excess pro-survival BCL-2 members (upper panel) and reversal of this inhibition by small molecule BCL-2 antagonist (lower panel). Details are given in the text.
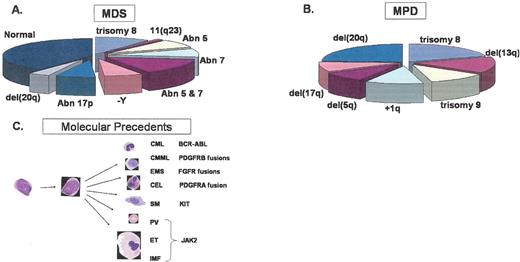
Common chromosomal deleted regions, duplications and other abnormalities associated with (A) MDS, (B) MPD and (C) activated kinases associated with MPD. The pie charts represent the percentages of patients with the indicated cytogenetic abnormalities estimated from the following studies: Fig. 1A, based on data in List AF et al, 2004 , and Fig. 1B from based on data in Bench.1
Abbreviations: CML, chronic myelogenous leukemia; CMML, chronic myelomonocytic leukemia, EMS, 8p11 myelo-proliferative syndrome; CEL, chronic eosinophilic leukemia; SM, systemic mastocytosis; PV, polycythemia vera; ET, essential thrombocythemia; IMF, idiopathic myelofibrosis.
Reproduced with permission from a slide provided by Dr. Anthony Green.

