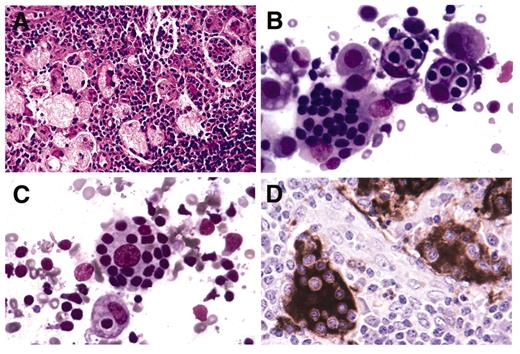
(in McClain et al). Sinus histiocytosis with massive lymphadenopathy involving a cervical lymph node.
A. Expanded lymph node sinuses filled with distinctive histiocytes in a background rich in plasma cells, foamy macrophages and small lymphocytes.
B. Distinctive histiocytes exhibiting emperipolesis where intact lymphocytes, some housed in vacuoles, are present within the cytoplasm.
C. Emperipolesis in a histiocyte with a prominent central nucleolus and a delicate nuclear membrane.
D. Immunohistochemical staining for the S100 protein highlights histiocytes with emperipolesis.
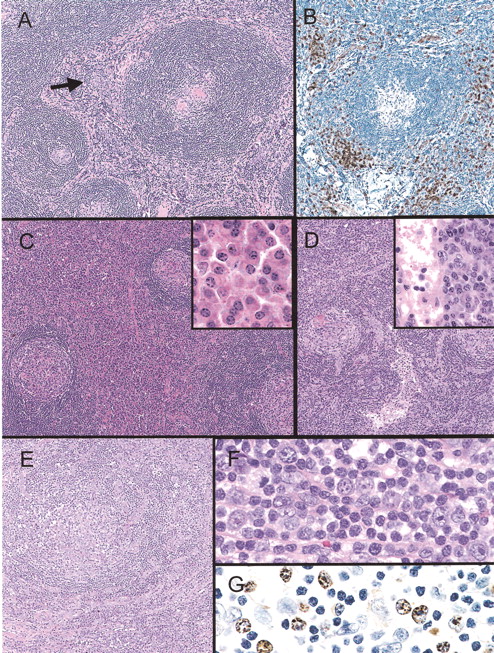
(in McClain et al). Histopathology and selected immunophenotypic features of major subtypes of Castleman disease.
Hyaline vascular Castleman disease. (A) There are large follicles with wide mantle zones with focally concentric rings of small lymphocytes and regressively transformed germinal centers. The interfollicular region shows vascular proliferation and foci of plasmacytoid dendritic cells (arrow). (B) A CD123 immunostain highlights the plasmacytoid dendritic cells.
Plasma cell Castleman disease (C) In contrast to the above, the follicles appear more hyperplastic and there are sheets of plasma cells in some interfollicular regions (inset).
Multicentric Castleman disease (D) This lymph node biopsy is similar to the plasma cell type of Castleman disease; however, note the intact dilated sinus.
Multicentric Castleman disease, plasmablastic type (E) Note the follicle with a mantle zone that appears somewhat disrupted. There are foci of numerous polyclonal plasma cells (in lower portion of image). (F) Large plasmablasts (immunoblasts) with prominent nucleoli are seen in and around the mantle. (G) The plasmablasts show nuclear positivity with the immunostain for HHV8 latent nuclear antigen.
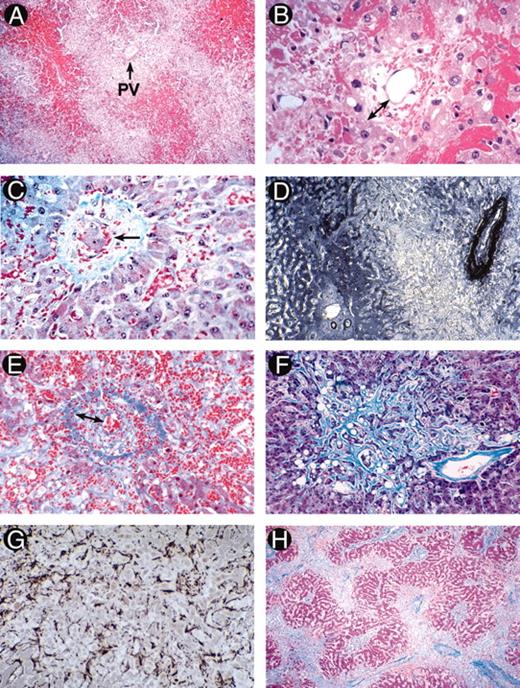
(in Wingard et al). Photomicrographs illustrating the evolution of histological abnormalities of sinusoidal obstructive syndrome (SOS).
A and B. Fatal SOS 23 days post-autograft (H&E). A, showing hemorrhage in zone 3 with sparing of zone 1 (PV, portal vein); B, high power section showing early changes of concentric venular luminal narrowing by a widened subendothelial zone (double arrow) containing entrapped red cells. The surrounding changes include necrotic hepatocytes, disrupted sinusoids, and hemorrhage into the space of Disse.
C. Severe SOS 21 days post-allograft (Gomori trichrome). Hepatocyte dropout, sinusoidal congestion, and embolization of a cluster of hepatocytes (arrow) into a partially collagenized venule.
D. Immunostained liver section of early SOS with anti-factor VIII/vWF, showing intense perivenular and adventitial staining, loss of the hepatocyte staining in zone 3, and preservation of portal and zone 1 anatomy.
E. Fatal SOS 31 days post-allograft (Mallory trichrome). A small sublobular venule nearly occluded by loose extracellular matrix and red cells within the widened subendotheial zone (double arrows). Extensive necrosis has obliterated the liver cords which are replaced by fine curvilinear strands of connective tissue admixed with red cells.
F and G. Fatal SOS 37 days after gemtuzamub ozogamicin infusion for relapsed AML post-transplant. F illustrates extensive zone 3 sinusoidal fibrosis adjacent to a non-occluded sublobular venule (Mallory trichrome). G is an immunostain of the same specimen with anti-alpha smooth muscle actin showing proliferation of activated hepatic stellate cells lining perivenular sinusoids.
H. Fatal SOS 67 days post-allograft (Mallory trichrome), showing a pattern of “reverse” cirrhosis with confluent bridging between collapsed, fibrotic perivenular zones containing venules occluded by fibrous matrix.
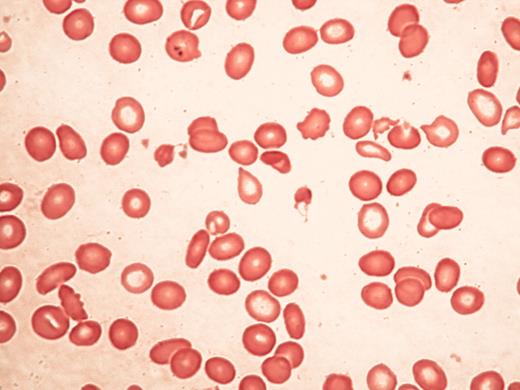
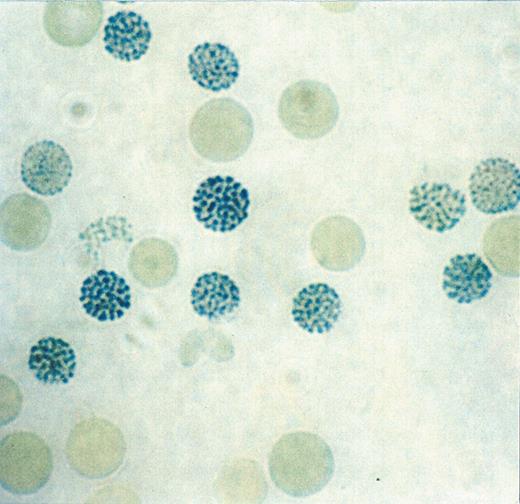
Typical blood findings inαthalassemia myelodysplasia syndrome (ATMDS).
A. A peripheral blood smear (May-Grünwald-Giemsa, ×400) from an untransfused patient. Many red cells are hypochromic and/or microcytic, while others appear relatively normal and well-preserved, presumably the descendants of non-thalassemic clones.
B. Classic hemoglobin H inclusions (HbH) in an ATMDS patient seen after supravital staining (Brilliant cresyl blue, ×400).
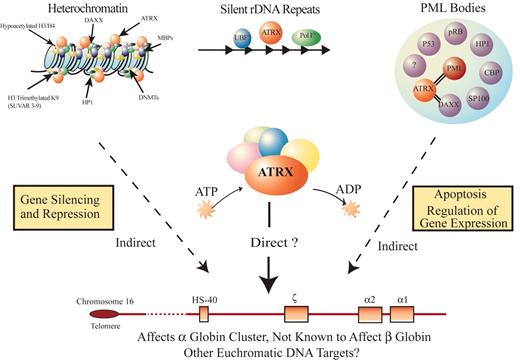
A model for how ATRX might influence gene expression.
ATRX is part of a multiprotein complex that uses the energy of ATP hydrolysis to remodel chromatin and/or its associated DNA in a way that affects transcriptional activity at euchromatic loci, including the α globin gene cluster. This interaction may be a result of alteration of the regional distribution of heterochromatin by the complex and/or recruitment of transcription factors (either directly or indirectly) that alter gene expression. ATRX function may be associated with its presence at one of its target nuclear locations (e.g., heterochromatin, ribosomal DNA repeats, and/or PML bodies) in addition to euchromatic sites. Potential points for interaction between ATRX and myelodysplasia (MDS) leading to a more severe hematologic phenotype than in ATR-X syndrome include: (1) the multiprotein complex of which ATRX is a part, (2) the transcription factors whose binding to DNA is affected by the ATRX complex, and (3) epigenetic modifications of histone-associated DNA leading to alterations in chromatin conformation.
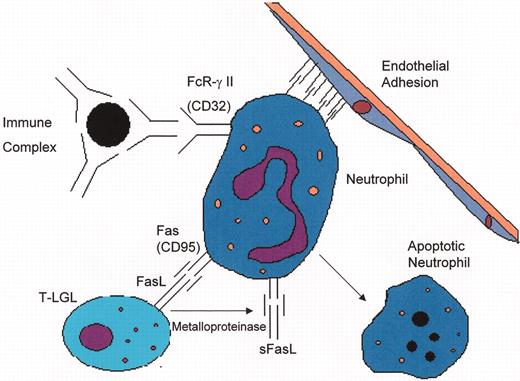
(in Berliner et al). Mechanisms of neutropenia in T cell large granular lymphocyte leukemia (T-LGL) and Felty’s syndrome (FS).
(in Berliner et al). Mechanisms of neutropenia in T cell large granular lymphocyte leukemia (T-LGL) and Felty’s syndrome (FS).
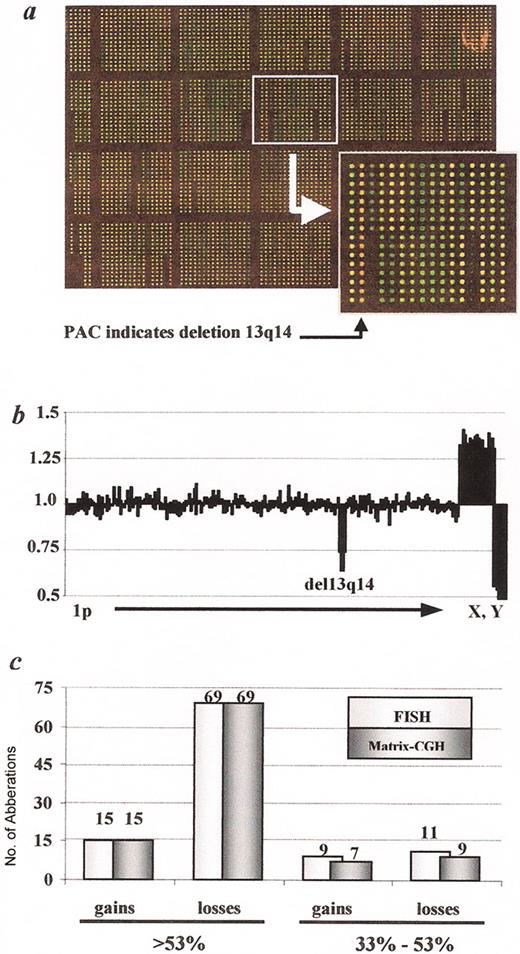
(in Byrd et al). Genome-wide diagnosis of genomic aberrations by matrix CGH (Schwänen 2004).
A. Image of a DNA chip after matrix CGH hybridization with DNA derived from a CLL patient carrying a 13q14 deletion (labeled in green; Cy3) versus human control DNA (labeled in red; Cy5). Insert: PAC clone in 13q14 with a dominantly red fluorescence signal after hybridization, indicating the deletion within this region (see arrowhead).
B. Example of a profile of signal ratios arranged in ascending chromosomal order beginning with 1p and ending with the X and Y chromosome. The cluster of fragments detecting deletion within 13q14 is indicated. In addition the gender mismatch (CLL sample: female, control DNA sample: male) is detected by the imbalanced ratio of the X and Y chromosomes.
C. Assessment of the diagnostic power of the matrix CGH chip by comparison with data obtained by FISH with a comprehensive probe set. In 107 CLL displaying a total of 27 gains and 95 losses, all recurrently imbalanced regions were correctly identified, if the proportion of cells carrying the respective gains or losses was larger than 53% as determined by FISH.
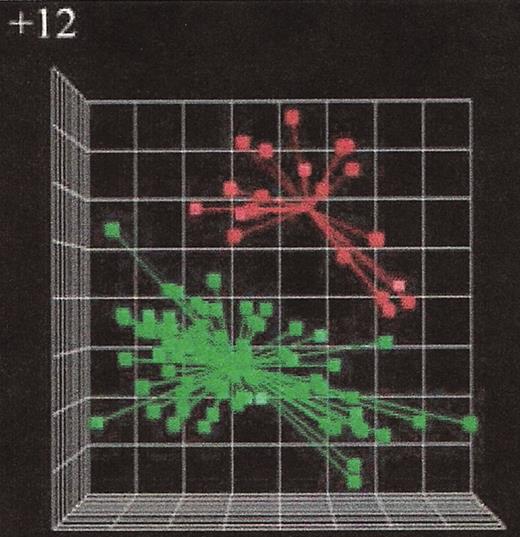
(in Byrd et al). Microarray gene expression analysis of chronic lymphocytic leukemia (CLL) cases with or without trisomy 12.25
The principal component analysis of the first three principal components defined by the predictor variables shows a clear separation of the cases with trisomy 12 (red symbols in the right upper quadrant) from the cases without trisomy 12 (green symbols in the lower left quadrant) indicating distinct gene expression signatures when comparing CLL groups with different genomic aberrations.
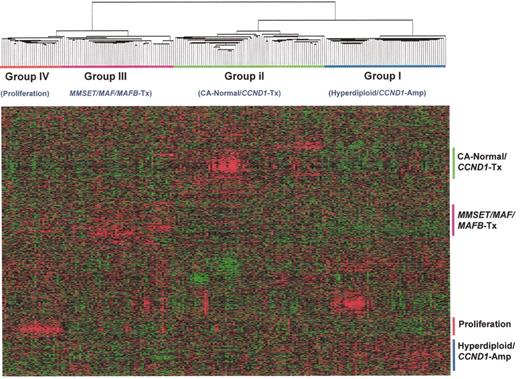
(in Harousseau et al). Hierarchical cluster subgroups are correlated with distinct cytogenetic and molecular genetic abnormalities.
Using normalized expression levels of 4580 genes, a 2-dimensional unsupervised hierarchical clustering analysis was performed on CD138-enriched myeloma cells from 221 newly diagnosed myelomas. The hierarchical clustering was performed using the Average Linkage Clustering with center correlation. Two major cluster branches are created containing Hyperdiploid/CCND1 Low and Normal karyotypes and CCND1 spikes defining another. The other branch consisted of two groups defined by a proliferation signature and the other harboring virtually all MMSET, MF, and MAFB spikes. Cluster groups, designated I, II, III, and IV, are indicated.
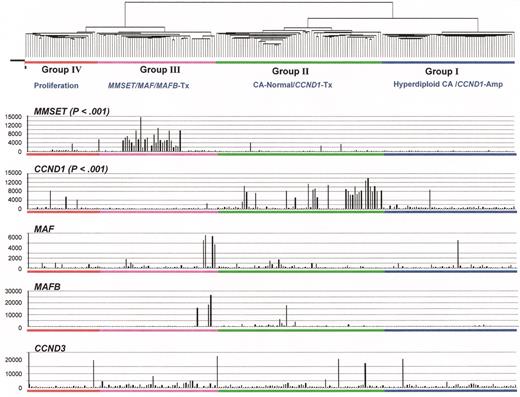
(in Harousseau et al). Relationship of spiked gene expression and cluster-defined subgroups.
Myeloma oncogenes hyperactivated by 14q32 translocations can be visualized with microarray. Gene spikes are non-randomly distributed among unsupervised hierarchical cluster-defined myeloma subgroups. The quantitative measure of mRNA expression, the so-called Affymetrix signal, in each of 221 myeloma cases is indicated on the vertical axis. The gene expression profiling (GEP)-defined groups are indicated. Unlike the MMSET and CCND1 spikes, MAF and MAFB spikes are not linked to one single group; however, this is likely due to the small numbers of cases as the trend was for both spikes to be in Group III.
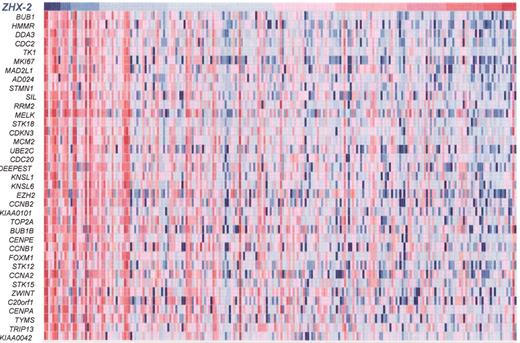
(in Harousseau et al).ZHX-2expression is inversely correlated with expression of proliferation genes in 221 myeloma cases.
The expression level of ZHX-2 (top row) is ordered from the lowest level (blue) on the left to the highest level (red) on the right. Expression higher than the median (red) and lower than the median (blue) of proliferation genes (rows) is presented for each patient (columns). Note the inverse correlation of proliferation genes and ZHX-2. This data, combined with the facts that ZHX-2 negatively regulates NF-Y and ZHX-2 loss is linked with poor outcome, strongly implies that loss of ZHX-2 gene expression results in upregulation of proliferation genes, imparting poor prognosis.
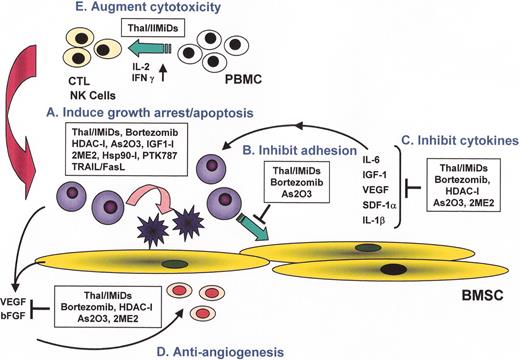
(in Harousseau et al). Novel biologically-based therapies targeting multiple myeloma (MM) cells and the bone marrow (BM) microenvironment: A. induce G1 growth arrest and apoptosis in MM cell lines and patient cells resistant to conventional chemotherapy; B. decrease MM cell-BM stromal cell binding; C. decrease cytokine production and sequelae in the BM microenvironment; D. decrease angiogenesis; and E. induce host anti-MM immunity.
(in Harousseau et al). Novel biologically-based therapies targeting multiple myeloma (MM) cells and the bone marrow (BM) microenvironment: A. induce G1 growth arrest and apoptosis in MM cell lines and patient cells resistant to conventional chemotherapy; B. decrease MM cell-BM stromal cell binding; C. decrease cytokine production and sequelae in the BM microenvironment; D. decrease angiogenesis; and E. induce host anti-MM immunity.
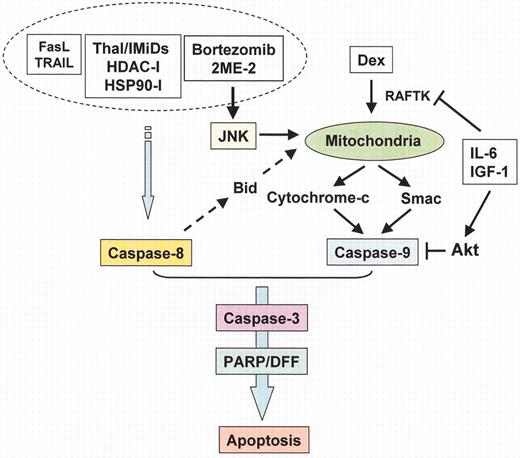
(in Harousseau et al). Apoptotic signaling pathways triggered by conventional and novel therapies.
Radiation (IR), Fas/FasL, TRAIL and thalidomide/immunomodulatory analogs (IMiDs) trigger caspase-8, whereas arsenic trioxide (As2O3) and dexamethasone (Dex) trigger caspase-9, activation. Bortezomib induces both caspase-8 and caspase-9 activation. Interleukin (IL)-6 and insulin-like growth factor (IGF)-1 activate PI3-K/Akt cascade, which inhibits caspase-9/caspase-3 apoptotic signaling.
(in Harousseau et al). Interaction of multiple myeloma (MM) cells and their bone marrow (BM) milieu. Binding of MM cells to BM stem cells (BMSCs) triggers adhesion- and cytokine-mediated MM cell growth, survival, drug resistance, and migration.
MM cell binding to BM stromal cells induces activation of p42/44 MAPK and NF-κB in BM stromal cells. Activation of NF-κB upregulates adhesion molecules on both MM cells and BM stromal cells. Cytokines secreted from MM cells induce interleukin (IL)-6 secretion (tumor necrosis factor-alpha [TNFα], vascular endothelial growth factor [VEGF]) and NF-κB activation (TNFα). Cytokines secreted from BM stromal cells activate major signaling pathways (p42/44 MAPK, JAK/STAT3, and/or PI3-K/Akt) and their downstream targets.
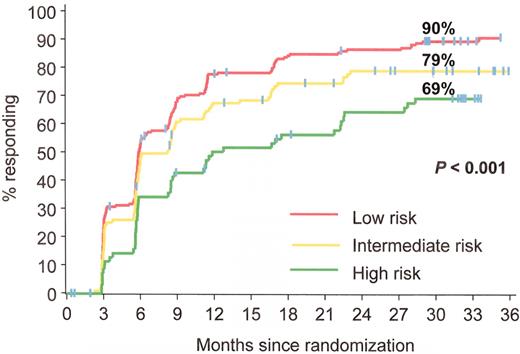
Estimated rates of complete cytogenetic response at 30 months analyzed by Sokal group: patients with the lowest scores (better prognosis group) had the highest complete cytogenetic response rates. IRIS/0106 trial.
Estimated rates of complete cytogenetic response at 30 months analyzed by Sokal group: patients with the lowest scores (better prognosis group) had the highest complete cytogenetic response rates. IRIS/0106 trial.
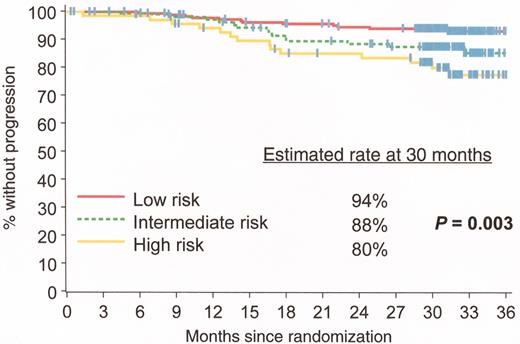
Estimated progression-free survival rates at 30 months analyzed by Sokal score: patients with the lowest scores (better prognosis group) had the highest progression-free survival rates. IRIS/0106 trial.
Estimated progression-free survival rates at 30 months analyzed by Sokal score: patients with the lowest scores (better prognosis group) had the highest progression-free survival rates. IRIS/0106 trial.
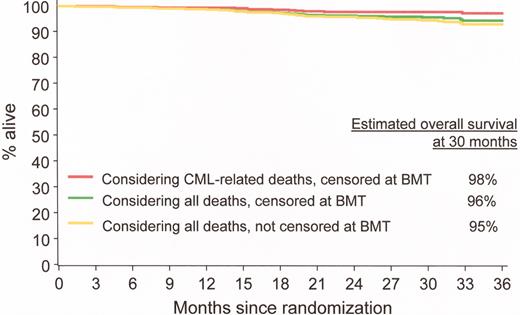
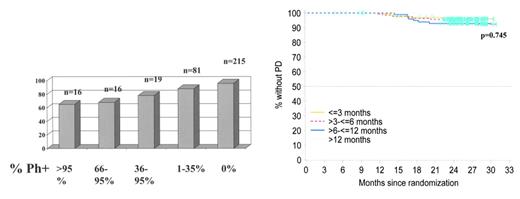
Estimated overall progression-free survival at 30 months in imatinib-treated patients. IRIS/0106 trial.
Estimated overall progression-free survival at 30 months in imatinib-treated patients. IRIS/0106 trial.
Progression-free survival at 24 months based on cytogenetic response at 6 months. Patients who achieve complete cytogenetic remission (CCR) have significantly lower rates of progression at 24 months than patients who have no significant cytogenetic response. IRIS/0106 trial data.
O’Brien Figure 3B. Progression-free survival divided into cohorts based on time to achieve complete cytogenetic remission (CCR). This analysis indicates that patients who take up to, say, 12 months to achieve CCR have similar progression-free survival to those who respond rapidly, i.e., within the first 3 months of treatment. IRIS/0106 trial data.
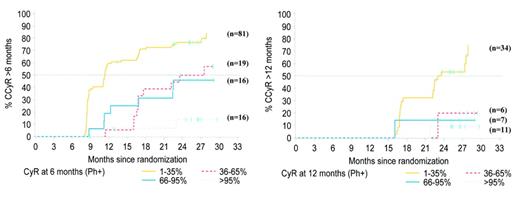
Probability of achieving complete cytogenetic remission (CCR) based on cytogenetic response at 6 months. Patients who have not achieved any significant cytogenetic response at this stage have little chance of ultimately achieving a CCR. IRIS/0106 trial data.
O’Brien Figure 4B. Probability of achieving complete cytogenetic remission (CCR) based on cytogenetic response at 12 months. At 1 year, patients who have not achieved a major cytogenetic response have little chance of ultimately achieving a CCR. IRIS/0106 trial data.
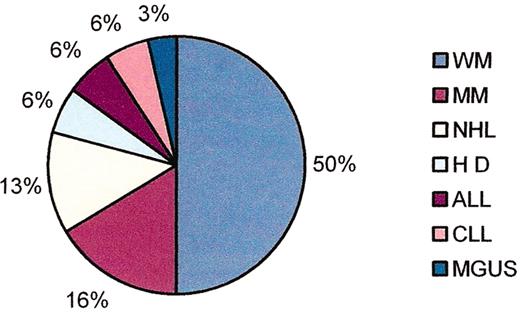
(in Gertz et al). Familial clustering of B-cell disorders in first degree relatives of patients with Waldenström’s macroglobulinemia (WM).
Abbreviations: MM, multiple myeloma; NHL, non-Hodgkin’s lymphoma; HD, Hodgkin’s disease; ALL, acute lymphocytic leukemia; CLL, chronic lymphocytic leukemia; MGUS, monoclonal gammopathy of unknown significance.
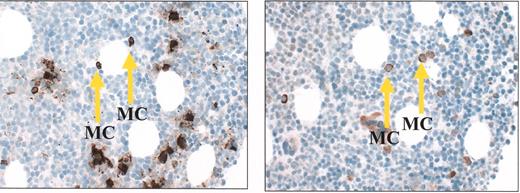
(in Gertz et al). Tryptase staining demonstrating abundant mast cells in a bone marrow clot section taken from a patient with Waldenström’s macroglobulinemia (A); CD40 ligand staining on mast cells from the same clot section (B).
(in Gertz et al). Tryptase staining demonstrating abundant mast cells in a bone marrow clot section taken from a patient with Waldenström’s macroglobulinemia (A); CD40 ligand staining on mast cells from the same clot section (B).
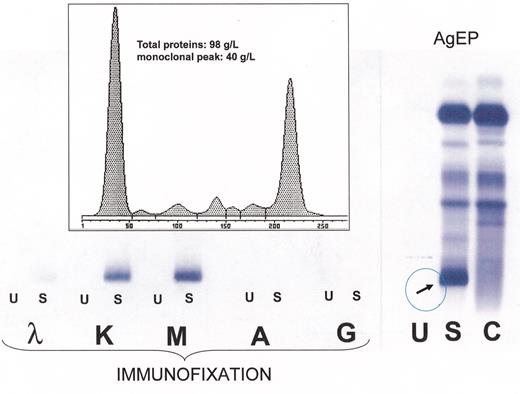
(in Gertz et al).Right: High-resolution agarose gel electrophoresis (AgEP) of control serum (C) and of serum (S) and urine (U) from a patient with Waldenström’s macroglobulinemia (anode above). An important monoclonal component is present in the serum, in the gamma region (arrow).Left: By immunofixation using anti-IgG (G), anti-IgA (A), anti-IgM (M), anti-κ(κ) and anti-λ(λ) antisera the serum monoclonal band is typed as IgMk, while no monoclonal protein is detectable by immunofixation in the urine.Inset: The monoclonal IgMk is quantified by densitometry as being 40 g/L.
(in Gertz et al).Right: High-resolution agarose gel electrophoresis (AgEP) of control serum (C) and of serum (S) and urine (U) from a patient with Waldenström’s macroglobulinemia (anode above). An important monoclonal component is present in the serum, in the gamma region (arrow).Left: By immunofixation using anti-IgG (G), anti-IgA (A), anti-IgM (M), anti-κ(κ) and anti-λ(λ) antisera the serum monoclonal band is typed as IgMk, while no monoclonal protein is detectable by immunofixation in the urine.Inset: The monoclonal IgMk is quantified by densitometry as being 40 g/L.
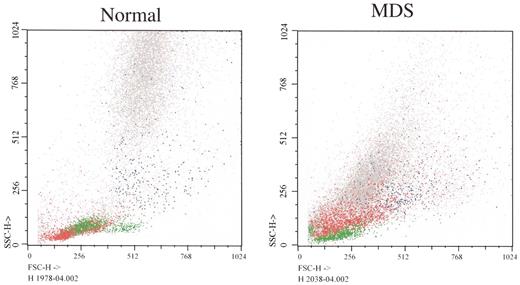
(in List et al). Flow cytometry forward (X axis) versus side (Y axis) light scatter histograms of normal bone marrow cells and marrow cells from a patient with RCMD.
The histogram from the patient shows that glycophorin A+ erythroid precursors (red) are larger in MDS (greater forward light scatter), corresponding to megaloblastic erythropoiesis (lymphocytes painted green as a reference). Note differences between light scatter properties of normal myeloid precursors and those of the MDS patient.
Color key: Red: glycophorin A; Blue: CD14; Green: CD45++ lymphocytes; Gray: CD45+ myeloid precursors
Courtesy of Dr. Anna Porwit-MacDonald, Karolinska University Hospital

![Richardson Figure 10. (in Harousseau et al). Interaction of multiple myeloma (MM) cells and their bone marrow (BM) milieu. Binding of MM cells to BM stem cells (BMSCs) triggers adhesion- and cytokine-mediated MM cell growth, survival, drug resistance, and migration. / MM cell binding to BM stromal cells induces activation of p42/44 MAPK and NF-κB in BM stromal cells. Activation of NF-κB upregulates adhesion molecules on both MM cells and BM stromal cells. Cytokines secreted from MM cells induce interleukin (IL)-6 secretion (tumor necrosis factor-alpha [TNFα], vascular endothelial growth factor [VEGF]) and NF-κB activation (TNFα). Cytokines secreted from BM stromal cells activate major signaling pathways (p42/44 MAPK, JAK/STAT3, and/or PI3-K/Akt) and their downstream targets.](https://ash.silverchair-cdn.com/ash/content_public/journal/hematology/2004/1/10.1182_asheducation-2004.1.503/4/m_harousseau_fig10color.jpeg?Expires=1767707588&Signature=vdbzQWvMx~FP5Dg~fzXo8nm-eF3tNAemaTUIdA16rkrKo~x4HcCWwul9waKPiY6DimSXx0NrRjCj8Wlw5y6Gn-EQIZ~axCadC-Rb1Ve8GZkKnoPPPXuwxQNfvHDAeYZQ8WA4mSWanE3NZwYHvTLVez3xGgci0ofLRbjevuSO~eW6eQUMi4tYbZHMk4eaDNyhmg-1cgDp1orQjxfq8-yFN5RCHwQW6Ji9~YeaVDqLSOXIa~WB3Ud9jpABusUJVLjTFCpzNgJGLtMjmTopBJAd2WCE0dWFZnTt8LfxMDfuIMKG2sxztT8KxI05avWwFPO1NBpgin~3A4TDRShhkPB1eg__&Key-Pair-Id=APKAIE5G5CRDK6RD3PGA)
