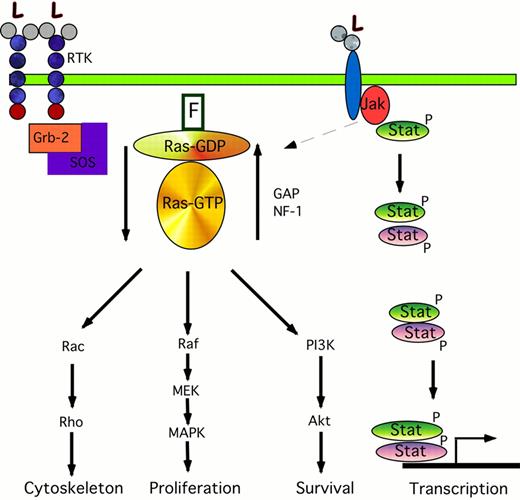
Signal transduction pathways involved in acute myeloid leukemia (AML).
The cartoon on the left shows the signaling transduction pathway from the RTK through ras. Binding of ligand (L) to the RTK causes phosphorylation of Grb-2, which forms a complex with the nucleotide exchange protein SOS. The interaction of Grb-2/SOS with the farnesylated (F) ras protein causes ras-GDP to become activated to ras-GTP. This in turn phosphorylates and activates Rac, Raf, and the PI3K pathways leading to changes in cytoskeletal organization, proliferation, and anti-apoptotic pathways. The activated ras-GTP is inactivated by GAP and NF-1. The cartoon on the right shows the Jak/STAT pathway. Ligand binding causes phosphorylation of Jaks; these in turn may activate the ras pathway (dotted arrow), and phosphorylate Stats. These Stats form either homodimers with like Stats (green ovals) or form heterodimer complexes with other members of the Stat family (purple ovals). These dimers translocate to the nucleus where they activate the transcription of specific gene targets.
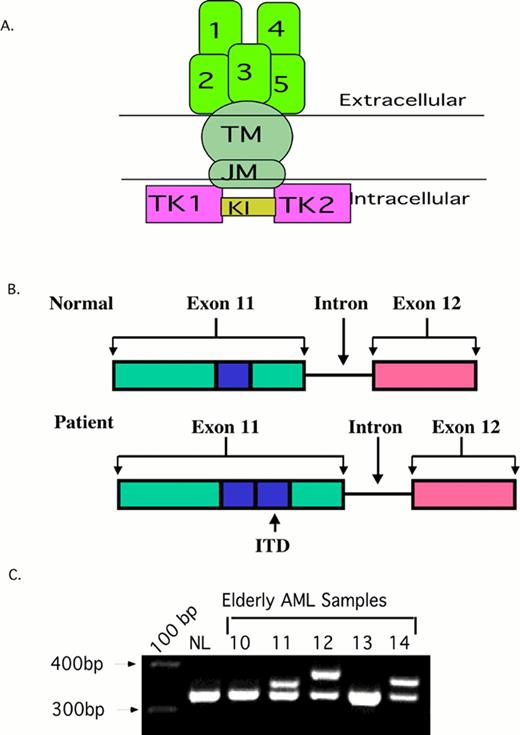
Flt3 internal tandem duplication (ITD).
2A. The structure of normal Flt3. The ITD occurs in the juxta-membrane region (JM).
2B. A Cartoon of the FLT3/ITD. A 20-200 bp region from exon 11-12 (blue box) is duplicated and inserted in a head-to-tail fashion.
2C. PCR of AML samples. Amplification of wild type Flt3 yields a 320 bp PCR amplimer. The higher bands in sample 11, 12, and 14 are Flt3/ITDs.
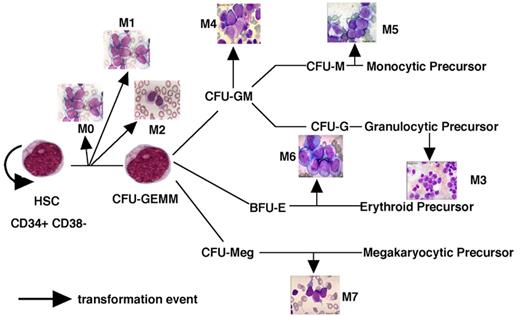
A model of AML heterogeneity that postulates leukemogenic events occurring in cells at different stages of lineage commitment.
A model of AML heterogeneity that postulates leukemogenic events occurring in cells at different stages of lineage commitment.
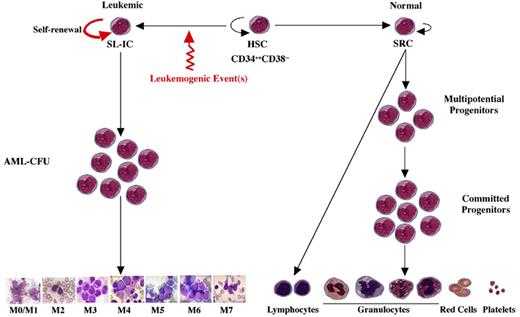
A model of AML heterogeneity that postulates leukemogenic events occurring in primitive stem cells resulting in increased self-renewal, abrogation of normal differentiation, and the creation of a leukemic stem cell that originates a leukemic hierarchy.
A model of AML heterogeneity that postulates leukemogenic events occurring in primitive stem cells resulting in increased self-renewal, abrogation of normal differentiation, and the creation of a leukemic stem cell that originates a leukemic hierarchy.
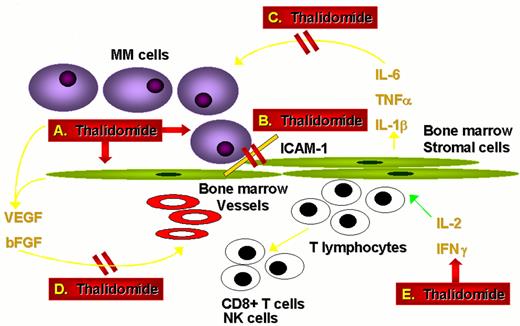
Actions of thalidomide against multiple myeloma.
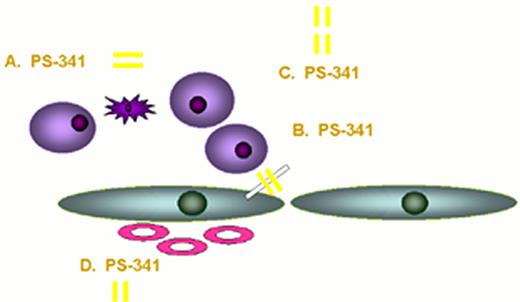
Actions of proteasome inhibitor against multiple myeloma.
Actions of proteasome inhibitor against multiple myeloma.
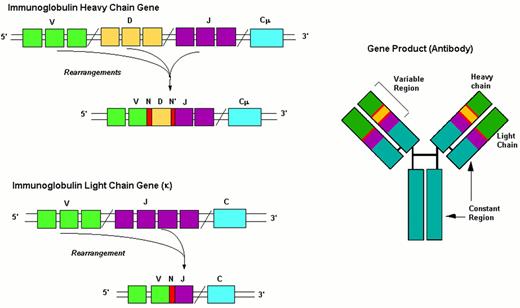
Events in B-cell receptor gene rearrangement.
Schematic representation of the immunoglobulin gene rearrangement and of the resulting protein.
Abbreviations: V, Variability segment; D, Diversity segment; J, Joining segment; C, Constant region; N(N’), hypervariable regions of variable length and composition.
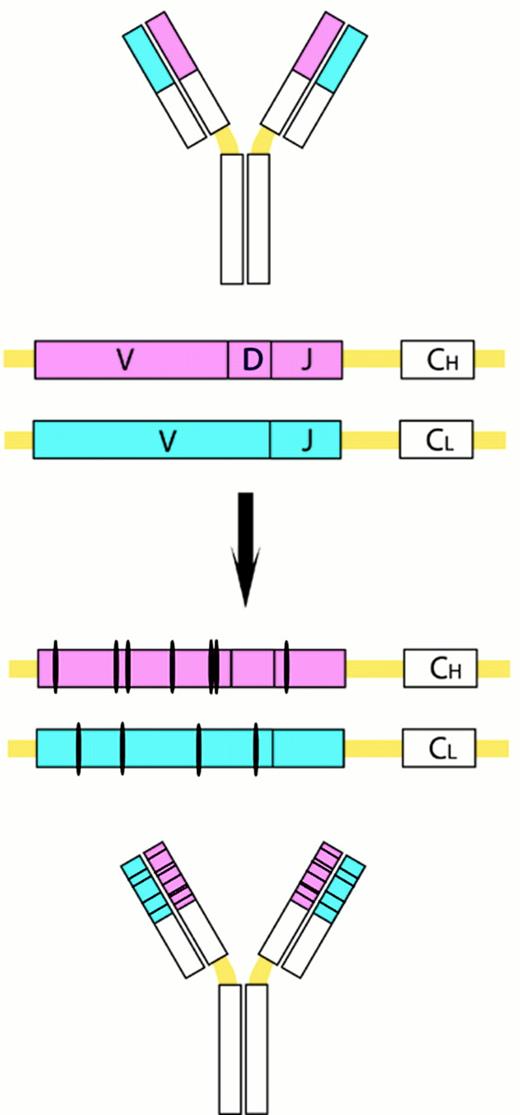
Somatic VH mutations.
This process introduces point mutations and occasional deletions and duplications, especially into the heavy- and light-chain variable-region genes. CH and CL denote the gene segements encoding the constant regions of the heavy and light chains, respectively.
Somatic VH mutations.
This process introduces point mutations and occasional deletions and duplications, especially into the heavy- and light-chain variable-region genes. CH and CL denote the gene segements encoding the constant regions of the heavy and light chains, respectively.
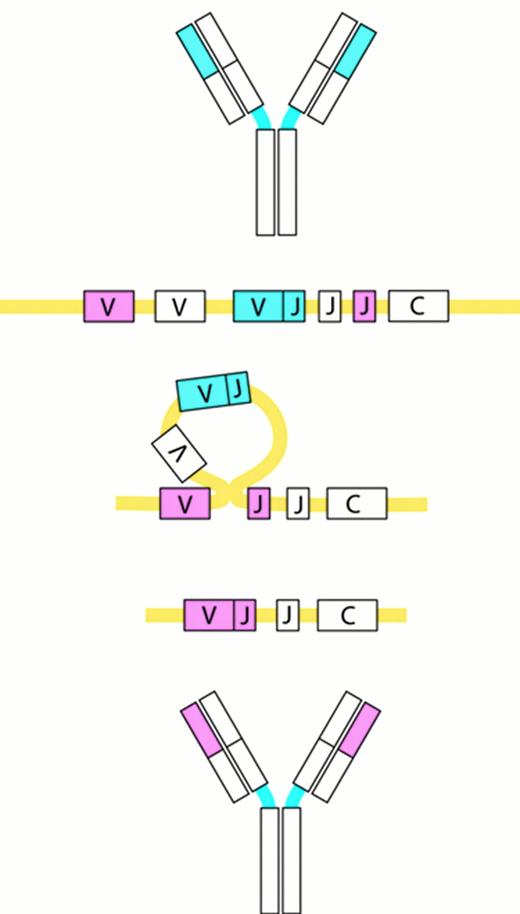
Receptor editing.
Receptor editing modifies the genes encoding the Ig molecules by a process in which an originally rearranged Ig segment, usually the light chain, is replaced by another one. The “new” light chain gene is generated by a secondary rearrangement of the variable region gene in the light chain loci.
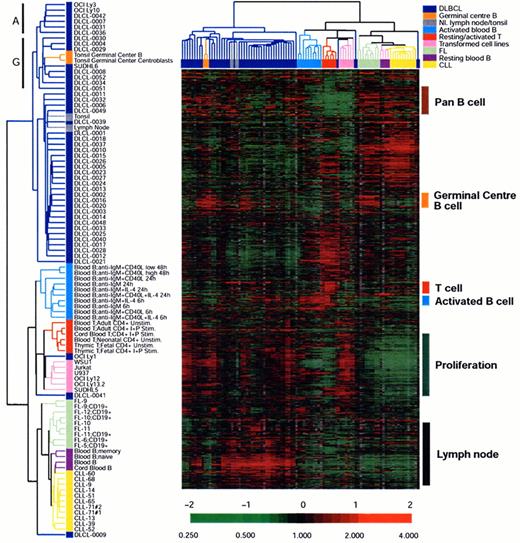
An example of unsupervised clustering of microarray analysis of normal lymphoid tissues, cell lines and lymphoid malignancies.
The dendrogram on the left is an enlargement of the one on top of the expression data matrix. Note that the dendrogram cluster cases according to their similarity of gene expression pattern and the CLL, FL and DLBCL cases are largely in three clusters. Also note the expression data matrix with the red and green color indicating over and under expressed genes respectively compared with the standard RNA pool. Figure reprinted with permission from Nature (Nature 403:503-511,2000)
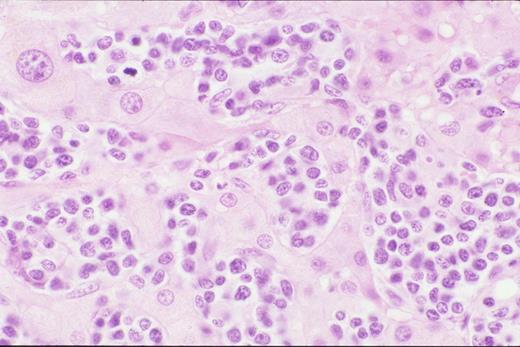
Biopsy of liver shows characteristic sinus infiltration by a uniform population of medium-sized lymphocytes with partially dispersed chromatin and little cytologic dysplasia, typical of hepatosplenic T-cell lymphoma.
Biopsy of liver shows characteristic sinus infiltration by a uniform population of medium-sized lymphocytes with partially dispersed chromatin and little cytologic dysplasia, typical of hepatosplenic T-cell lymphoma.
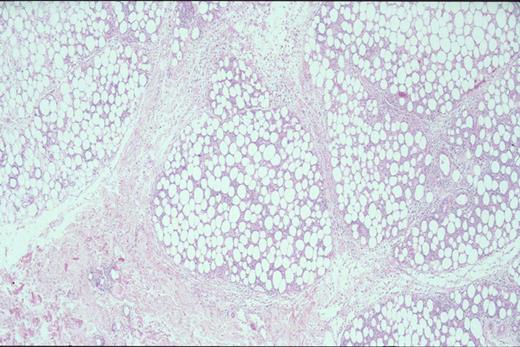
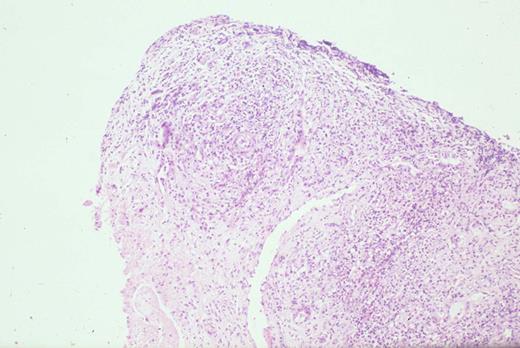
Kinney Figure 2a (Greer et al). At low magnification, this skin biopsy shows a lobular, lacelike pattern of infiltration of the subcutaneous tissue by subcutaneous panniculitis-like T-cell lymphoma.
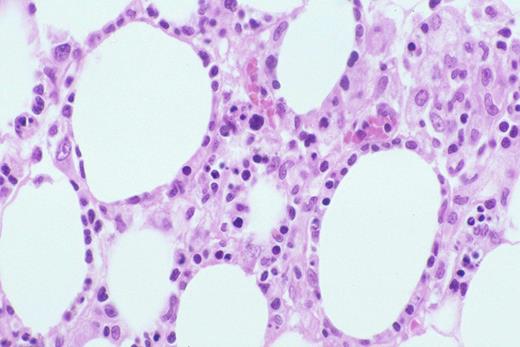
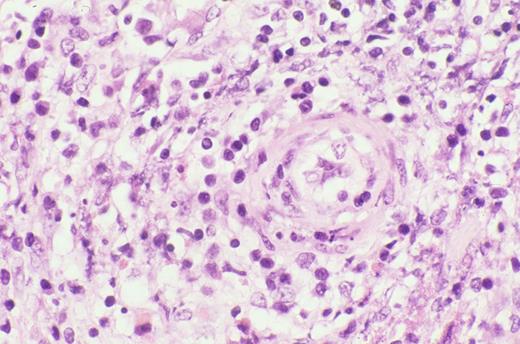
Kinney Figure 2b (Greer et al). The lymphocytes have irregular, dysplastic , hyperchromatic nuclei and rim the fat spaces. Focal necrosis and cytophagocytosis of cellular elements by benign histiocytes is present.
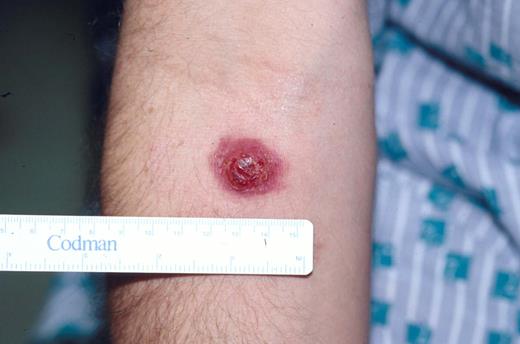
Typical clinical appearance of primary cutaneous ALCL with a large ulcerated mass on the arm.
Typical clinical appearance of primary cutaneous ALCL with a large ulcerated mass on the arm.
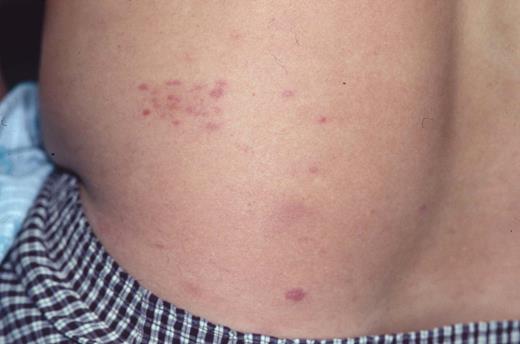
Clinical appearance of lymphomatoid papulosis with multiple small crops of papules on the back that spontaneously regress.
Clinical appearance of lymphomatoid papulosis with multiple small crops of papules on the back that spontaneously regress.
Kinney Figure 4a (Greer et al). Nasal biopsy from a nasal NK/T cell tumor shows zonal necrosis due to an angioinvasive/angiodestructive lymphoid infiltrate.
Kinney Figure 4b (Greer et al). The lymphocytes within the vessel are medium to large with dysplastic, folded nuclei with condensed or dispersed chromatin.
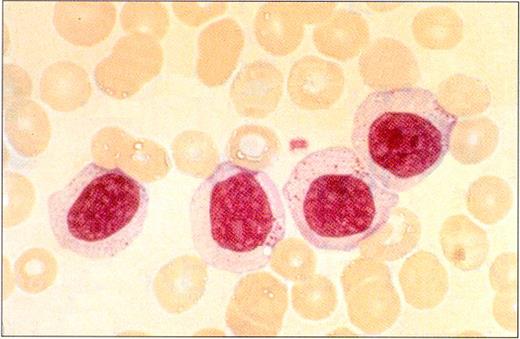
Peripheral blood smear in a patient with LGL leukemia shows the characteristic morphology of large granular lymphocytes: They are larger than normal lymphocytes; they have a relatively large amount of cytoplasm; and they contain azurophilic cytoplasmic granules.
(Photo courtesy of Bruce Cheson, National Cancer Institute).
Defects in programmed call death (apoptosis) have been suggested as the cause of lymphoproliferation in T-LGL leukemia.
Normally, viral infection of a target cell leads to upregulation of the Fas antigen (receptor) on the cell surface, while antigen recognition of viral peptide causes upregulation of Fas ligand on cytotoxic T lymphocytes (CTL) (A). Binding of Fas ligand to Fas receptor results in death of the viral-infected target cell. The cytotoxic T lymphocyte then upregulates Fas antigen and is itself killed by the effects of Fas binding. Viral infection has been hypothesized as an initial stimulus for LGL leukemia (B). Since LGLs are cytotoxic T lymphocytes, they express both Fas antigen and Fas ligand. In this case, activation of the Fas antigen-Fas ligand pathway is defective. The LGLs do not undergo apoptosis. Instead, leukemic LGLs accumulate in the blood.
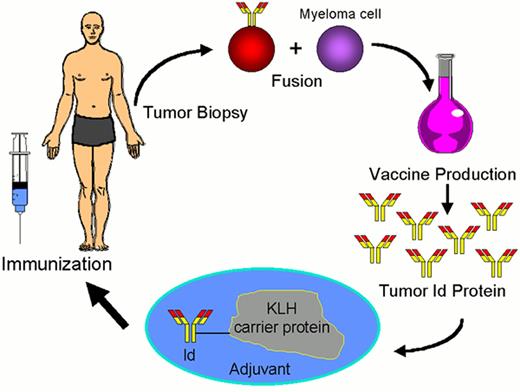
Schema for idiotype-KLH vaccination for lymphoma.
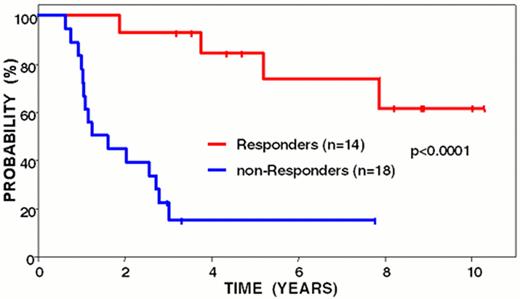
Freedom from disease progression from last chemotherapy of follicular lymphoma patients following idiotype vaccination: immune responders vs. non-responders.
Curves have been updated since initially reported (Blood 89:3133, 1997).
Freedom from disease progression from last chemotherapy of follicular lymphoma patients following idiotype vaccination: immune responders vs. non-responders.
Curves have been updated since initially reported (Blood 89:3133, 1997).
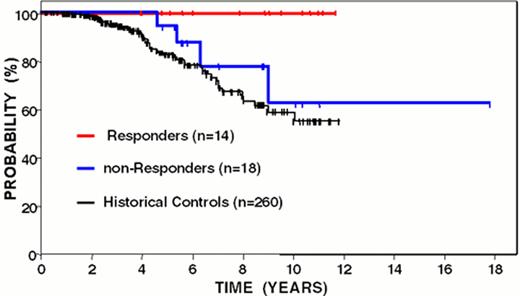
Overall survival from time of diagnosis of follicular lymphoma patients following idiotype vaccination: immune responders versus non-responders.
Curves have been updated since initially reported (Blood 89:3133, 1997).
Overall survival from time of diagnosis of follicular lymphoma patients following idiotype vaccination: immune responders versus non-responders.
Curves have been updated since initially reported (Blood 89:3133, 1997).
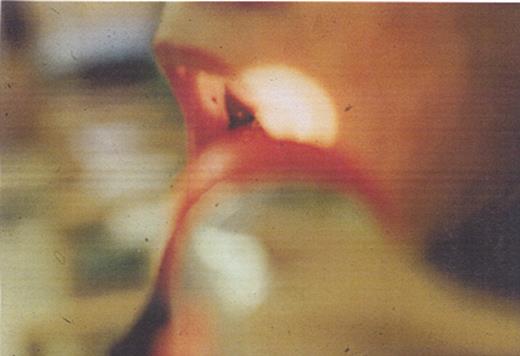
Wet purpura in the buccal mucosa of a patient with ITP. This is a sign that the platelet count is < 10,000/μL.
Wet purpura in the buccal mucosa of a patient with ITP. This is a sign that the platelet count is < 10,000/μL.
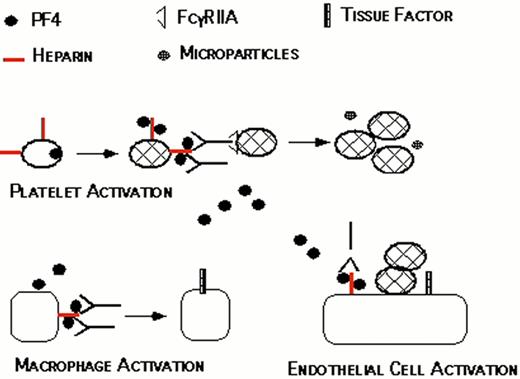
Proposed pathogenesis of HIT/T.
Resting platelets bind heparin and store platelet factor 4 (PF4) in dense granules. When platelets are activated, PF4 is secreted. PF4 binds to the platelet surface through heparin, forming antigenic complexes. HIT/T antibodies bind to these complexes through the Fab’ end while occupying the signal transducing FcRgIIA receptors on the same or neighboring platelets. This amplifies the process of platelet activation, releasing additional PF4 and generating procoagulant microparticles. PF4 released into the circulation binds to monocyte/macrophages and endothelial cell-associated heparin and/or other glycosasminoglycans generating binding sites for HIT/T antibody. Binding of HIT/T antibody promotes tissue factor expression by monocyte/macrophages and endothelial cell, further predisposing to thrombosis
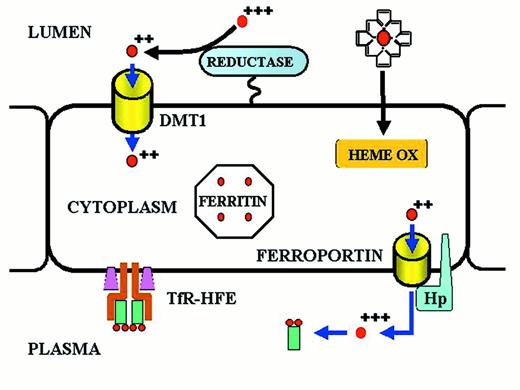
Iron transport across the absorptive enterocyte.
Iron is presented to the enterocyte in the lumen of the gut, either as inorganic ferric iron or as heme iron.
Ferric iron is reduced to ferrous iron by a membrane-bound reductase with high homology to cytochrome b561.35,36 Ferrous iron is then transported across the apical membrane of the enterocyte by a divalent metal transport channel (DMT1).37,38 Heme is passively transferred across the absorptive surface of the enterocyte, and heme iron is liberated by heme oxygenase (HEME OX). Iron is transported across the basolateral membrane of the enterocyte by a transmembrane ferrous iron transporter (FERROPORTIN)39-41 that acts in concert with a membrane-bound multicopper ferroxidase designated hephaestin (Hp).42 A minor pathway of transport across the basolateral membrane of the enterocyte utilizes ferroportin and the plasma multicopper ferroxidase ceruloplasmin. Both hephaestin and ceruloplasmin oxidize ferrous iron to ferric iron. Ferric iron is then bound to transferrin of delivery to cells expressing transferrin receptors. The amount of iron transported from the lumen of the gut to the plasma is “programmed” when the enterocyte resides in the crypt regions of intestinal villi in the duodenum and proximal jejunum. Programming is regulated by the diferric transferrin-transferrin receptor (TfR)-HFE complex on the basolateral membrane of the crypt cell. Programmed crypt cells then migrate to the villus tip where iron absorption occurs. The mechanism by which programming occurs remains unknown. Mutations affecting DMT1 and hephaestin cause impaired iron absorption in rodents,10 but a recently discovered mutation (presumably a gain-of-function mutation) in the ferroportin gene leads to iron overload in humans.43
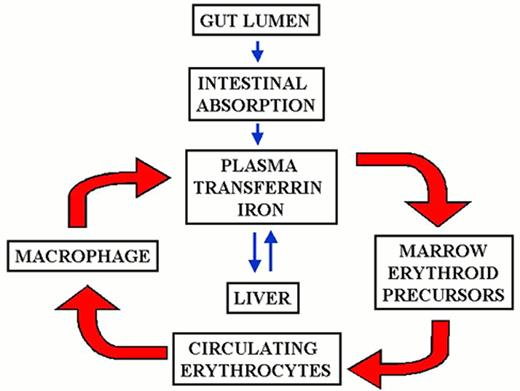
The mammalian iron cycle.
Dietary iron enters the cycle via the absorptive enterocyte. Iron absorbed from the gut lumen is transferred to plasma, bound to circulating apo-transferrin (Tf) and utilized by cells expressing transferrin receptors, mainly red cell precursors. Circulating red cells have a lifetime of approximately 120 days after which they are ingested by tissue macrophages. Heme oxygenase expressed in the macrophage liberates iron from heme, and the iron is recycled to plasma where it again binds to circulating apo-transferrin. Some fraction of dietary and macrophage recycled iron is deposited for storage in hepatocytes as ferritin-bound iron. Hepatocyte iron can be mobilized and returned to the circulation. CP, ceruloplasmin; Hp, hephaestin. For other symbols see Figure 2.
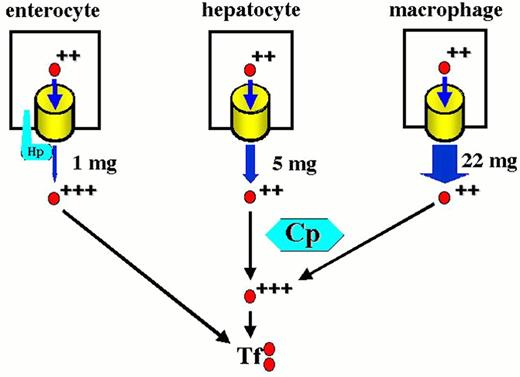
Contributions to the circulating iron pool.
Plasma iron turnover is driven by the demand for transferrin iron by erythroid precursors. The principal source for internal iron exchange is the reticuloendothelial cell followed by the parenchymal cell and finally the absorptive enterocyte.44-46
Contributions to the circulating iron pool.
Plasma iron turnover is driven by the demand for transferrin iron by erythroid precursors. The principal source for internal iron exchange is the reticuloendothelial cell followed by the parenchymal cell and finally the absorptive enterocyte.44-46
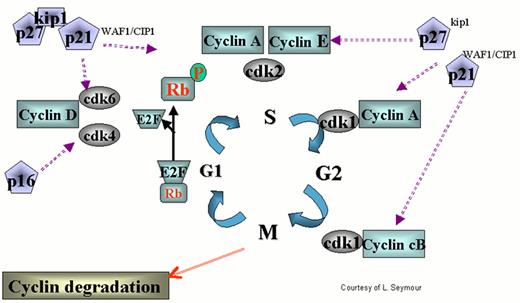
Regulation of the cell cycle by cyclin dependent kinases (cdks).
cdks affect various stages of the cycle by forming complexes with their respective cyclins. The cell cycle begins in G1 during which there is increased synthesis of D-type cyclins that associate with cdks 4 and 6. When the complex is formed, the cdks are activated and then phosphorylate the retinoblastoma (Rb) protein. The latter is necessary to regulate G1 through its restriction point. As the cycle goes through G1, Cyclin E is synthesized and associates with cdk2, which permits the cycle to proceed to S. After cyclin A is synthesized during the G1/S transition phase, it is associated with cdk2 in early S phase and cdk1 in late S phase and early G2. Cyclin B is synthesized late in G2 and M phase and associates with cdk1. The increased cyclins A and B, complexed with cdk1 at the end of M phase, are necessary to move the cell into the next G1 phase.
The action of cyclins/cdks is regulated on multiple levels. For example, along with cyclin synthesis is the process of cyclin degradation. Cyclin/cdk activity is controlled by two families of inhibitors. The first group includes the cyclin and kinase inhibitory proteins (Cip/Kip) p21waf1/cip1, p27kip2 and p57kip2. These appear to function at several points during the cycle inhibiting cdks 4, 6, and 2. p53 helps regulate the cell cycle through transcription of p21, which retains the cell in G1 permitting DNA repair. The other group includes p15ink4a, p15ink4b, p18ink4c and p19ink4d, which specifically inhibit cyclin D-associated cdk4 and cdk6.
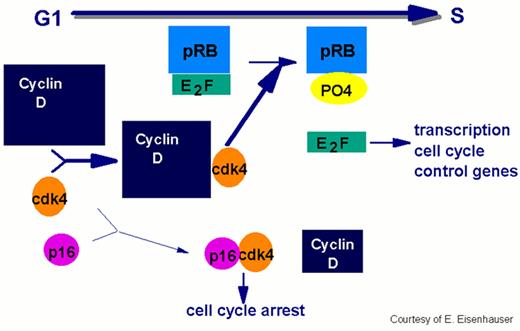
In order for the cell to move from the G1 to the S phase of the cycle, the cell passes the restriction point, the G1 checkpoint.
This process requires phosphorylation of the Rb protein by cdks. The E2F transcription factor dissociates from the Rb protein complex releasing the phosphorylated Rb. E2F facilitates progression by initiating the transcription of the cell cycle control genes. Overexpression of cyclin D has been implicated in the pathogenesis of mantle cell lymphoma by enhancing the transition through G1 to S.
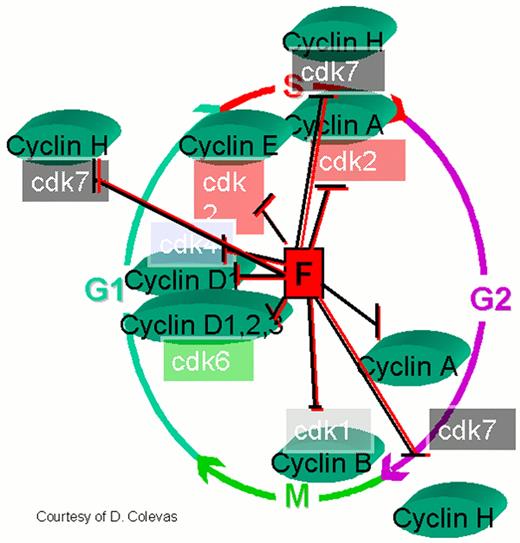
Flavopiridol inhibits a variety of cyclin kinases as well as cyclin D, cdks 1, 2, 4, and 7.
Other effects include depletion of vascular endothelial growth factor-F (VEGF), DNA binding, and inhibition of glycogen phosphorylation. By inhibiting the D cyclins flavopiridol could induce cell cycle arrest, making it a potentially useful therapeutic agent in mantle cell non-Hodgkin's lymphoma and other malignancies.
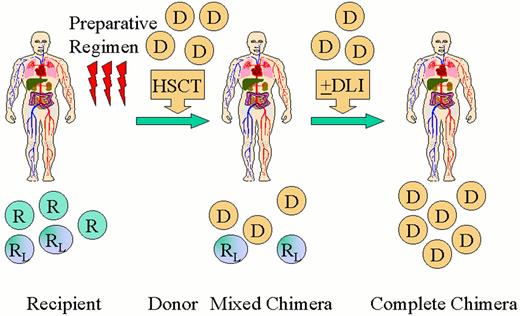
Scheme for nonablative hematopoietic transplantation for hematologic malignancy.
Recipients (R) receive a nonmyeloablative preparative regimen designed to achieve engraftment of an allogeneic hematopoietic cell transplant (HSCT). A short course immunosuppressive treatment is given to prevent GVHD. Initially mixed chimerism is present with coexistence of donor (D) cells with recipient-derived normal (R) and leukemia/lymphoma (RL) cells. Recipient and donor patterns of restriction fragment length polymorphisms are shown. Donor-derived T-cells act to eradicate residual recipient-derived normal and malignant hematopoietic cells leading to complete chimerism and remission. Donor lymphocyte infusions (DLI) may be administered to enhance graft-versus-malignancy effects.

