The significance of enrichment of stemness-related gene sets
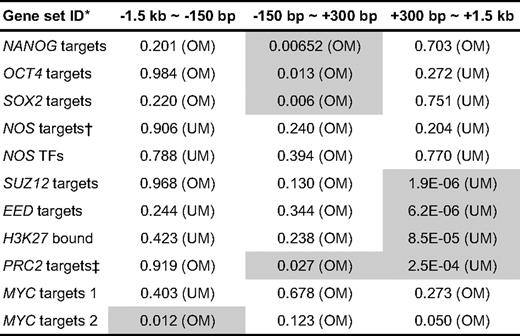
For each gene set, 1.5 kb upstream and downstream of TSS regions were subdivided into −1.5 kb ∼ −150 bp, −150 bp ∼ +300 bp, and +300 bp ∼ +1.5 kb. Mean log2 ratios of the 3 promoter regions were calculated, and the significance of enrichment was calculated using the PAGE algorithm, while discriminating between relative overmethylation (OM) and undermethylation (UM) of the gene sets in CD34+ cells relative to CD34− cells. Significant (P < .05) enrichment is indicated by the shaded boxes.
Eleven stemness-related gene sets were selected from previously published literature.
NOS targets represent the overlap of the NANOG, OCT4, and SOX2 gene sets.
PRC2 targets represent the overlap of SUZ, EED, and H3K27 target genes.